interactive activity
Chapter 7
Taxes
1. The United States imposes an excise tax on the sale of domestic airline tickets.
Let’s assume that in 2015 the total excise tax was $6.10 per airline ticket (consist–
ing of the $3.60 flight segment tax plus the $2.50 September 11 fee). According to
data from the Bureau of Transportation Statistics, in 2015, 643 million passengers
traveled on domestic airline trips at an average price of $380 per trip. The accom–
panying table shows the supply and demand schedules for airline trips. The quan–
tity demanded at the average price of $380 is actual data; the rest is hypothetical.
Quantity of trips Quantity of trips
Price of trip demanded (millions) supplied (millions)
$380.02 642 699
378.00 693 693
373.82 913 642
a. What is the government tax revenue in 2015 from the excise tax?
1. a. Tax revenue is $6.10 per trip × 643 million trips = $3,922.3 million.
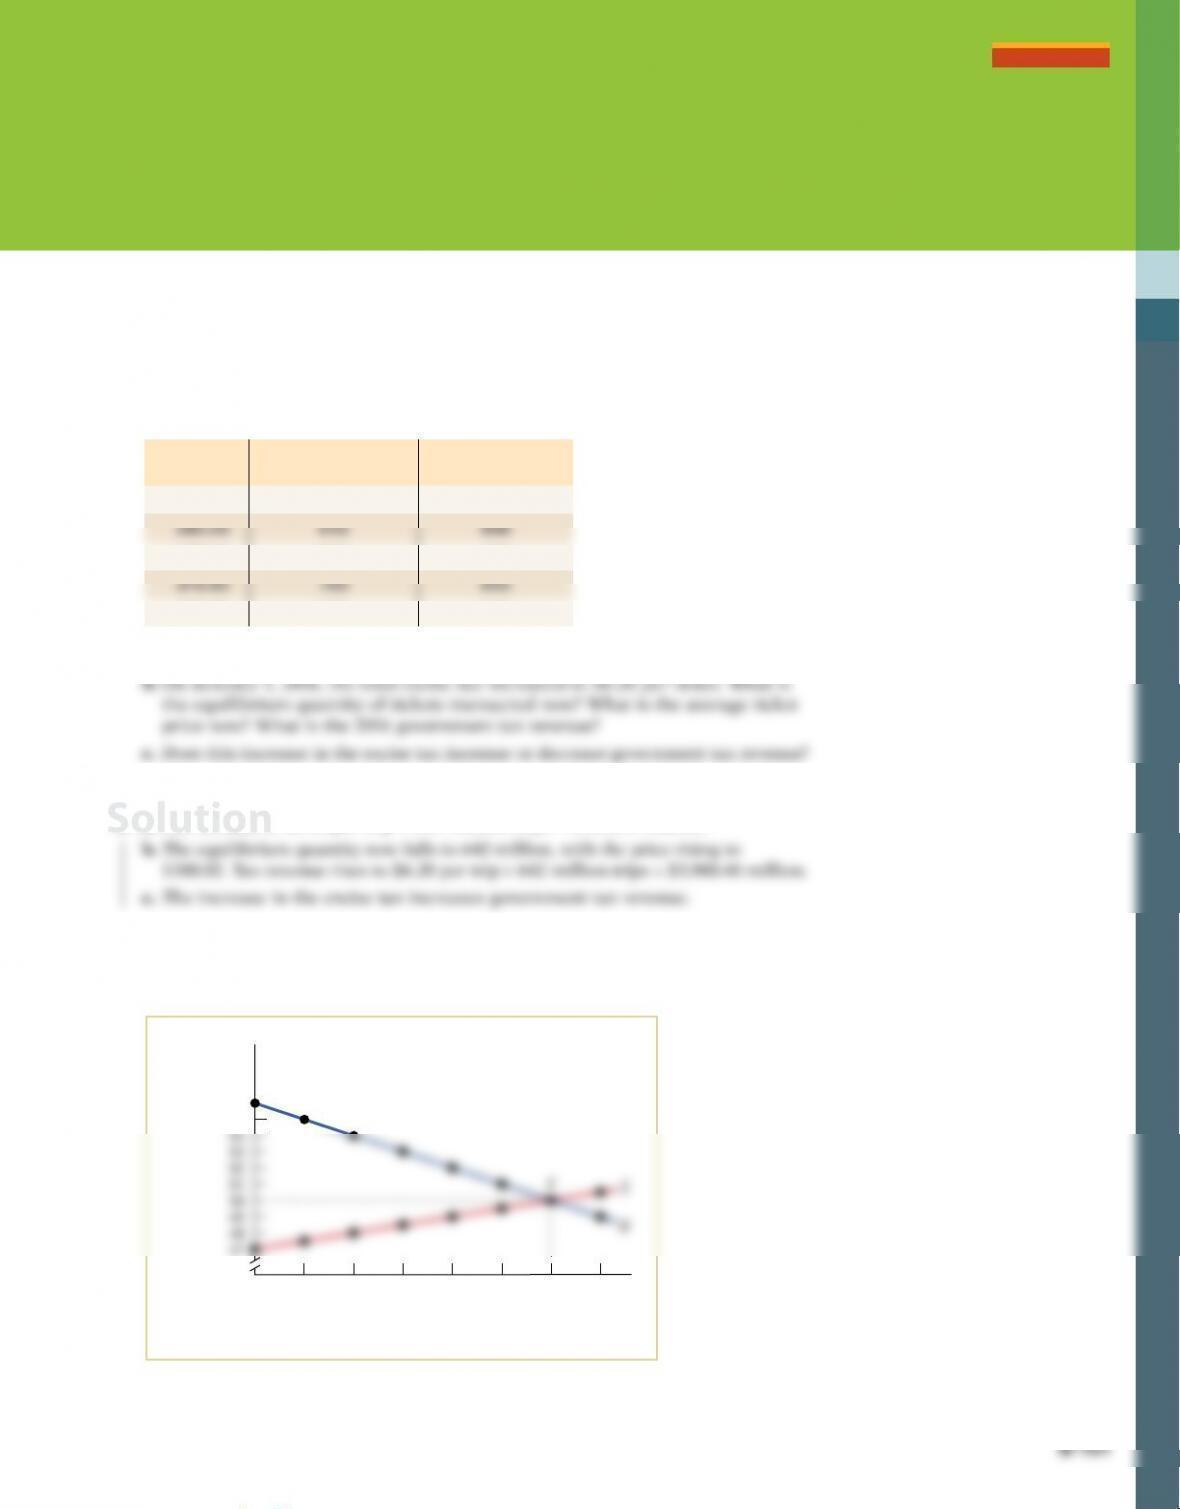
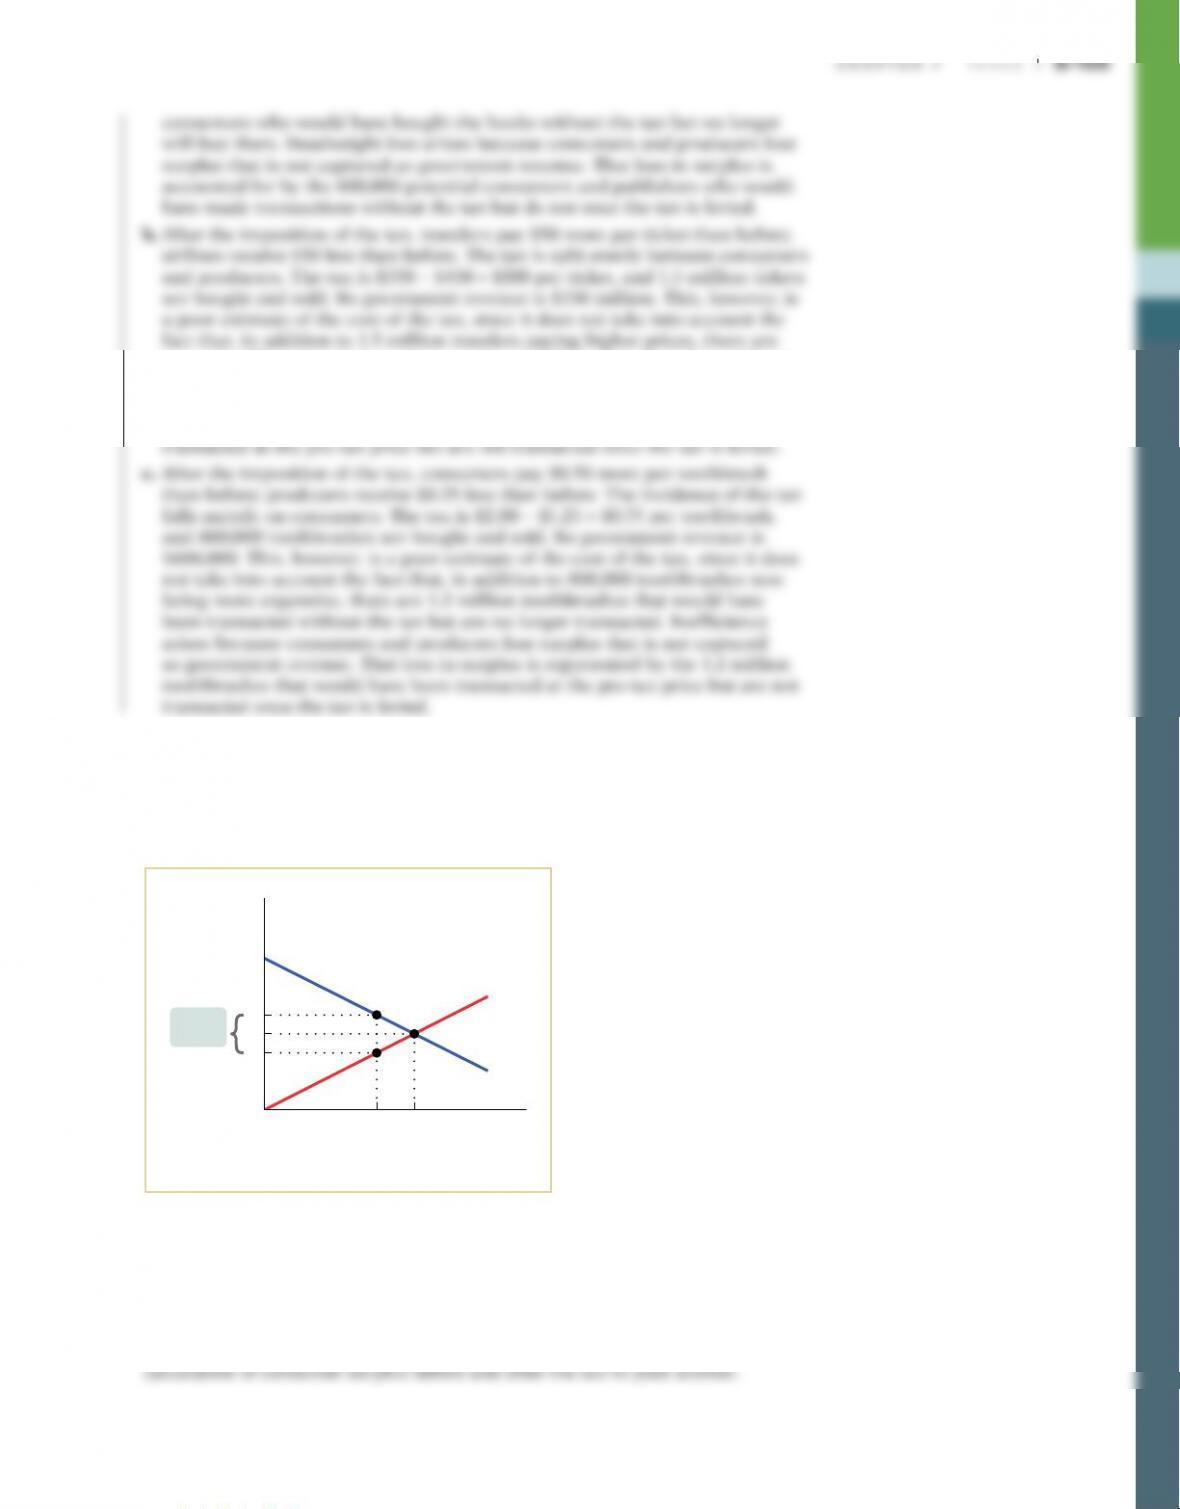
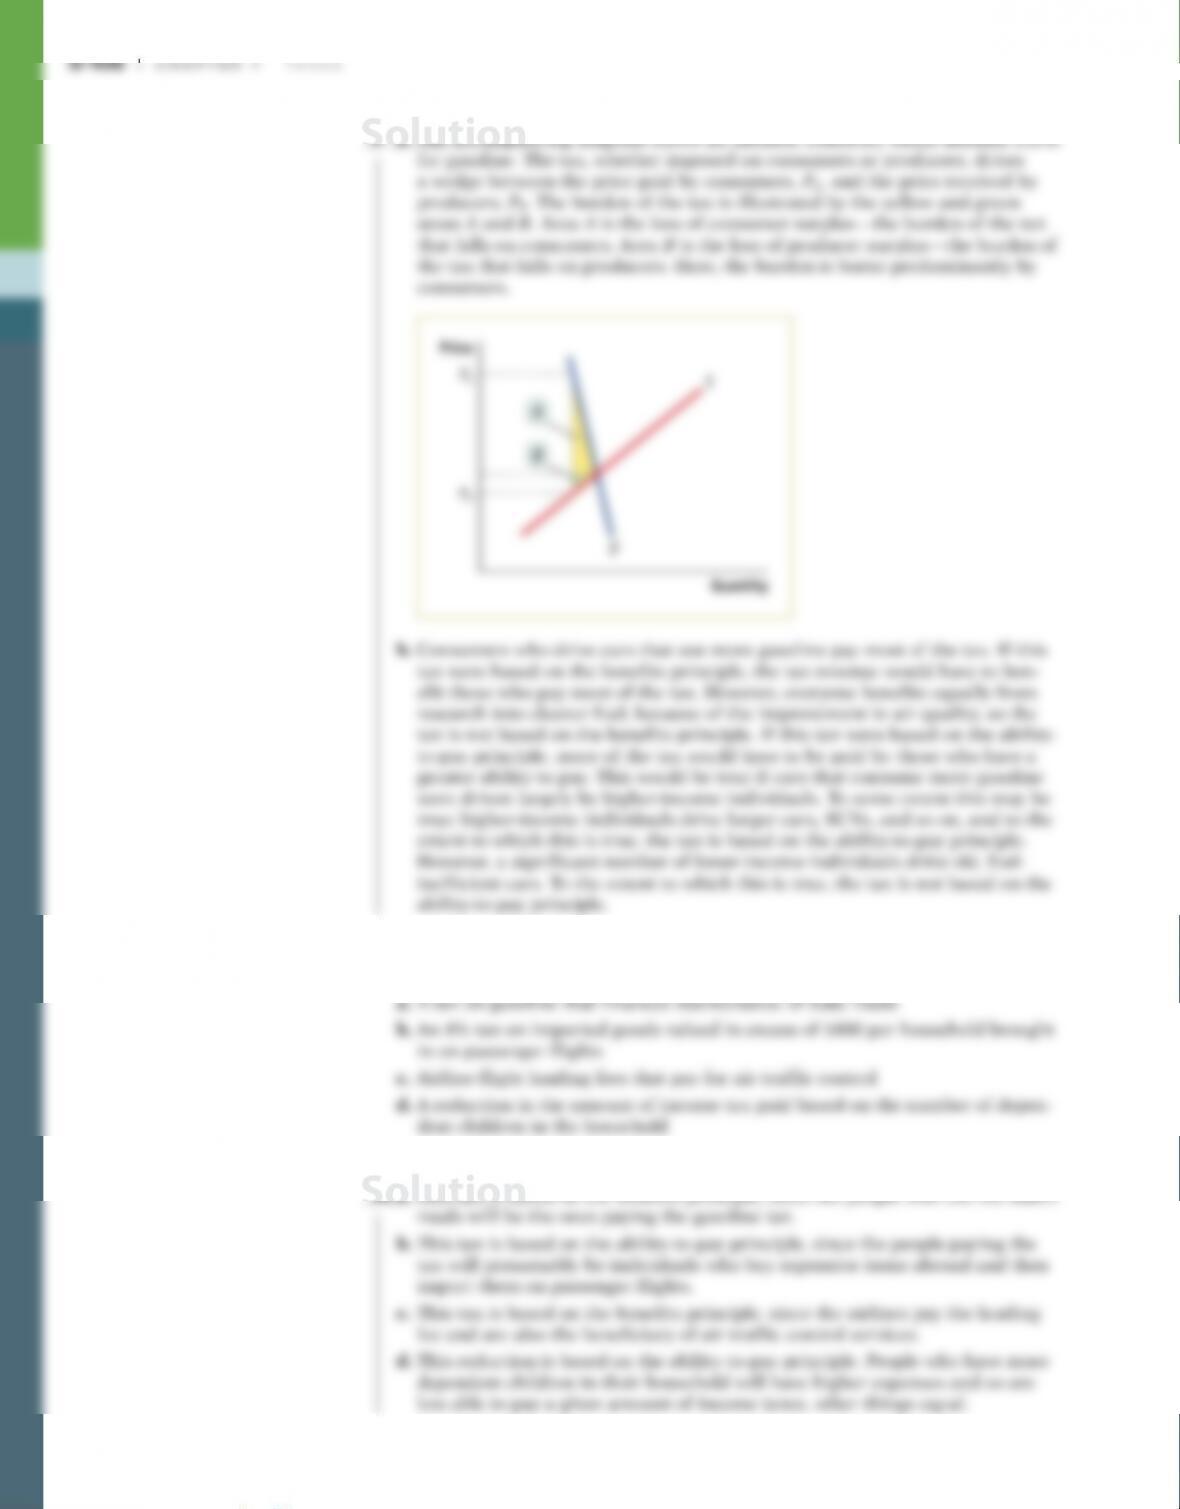
2. In 1990, the United States began to levy a tax on sales of luxury cars. For simplic–
ity, assume that the tax was an excise tax of $6,000 per car. The accompanying
figure shows hypothetical demand and supply curves for luxury cars.
120804020 60 100 140
0
$56
55
Price of car
(thousands
of dollars)
Quantity of car
s
(thousands)
Solution
S-102 Chapter 7 Ta x e s
a. Under the tax, what is the price paid by consumers? What is the price received
by producers? What is the government tax revenue from the excise tax?
b. After the reduction in the excise tax from $6,000 to $4,500 per car, what is the
price paid by consumers? What is the price received by producers? What is tax
revenue now?
c. The government tax revenue rose as a result of the reduction in the excise tax.
This occurs because the supply of and the demand for luxury automobiles
are both highly elastic: a fall in the price paid by consumers leads to a large
3. All states impose excise taxes on gasoline. According to data from the Federal
Highway Administration, the state of California imposes an excise tax of $0.40
per gallon of gasoline. In 2015, gasoline sales in California totaled 14.6 billion
gallons. What was California’s tax revenue from the gasoline excise tax? If Cali-
fornia doubled the excise tax, would tax revenue double? Why or why not?
4. In the United States, each state government can impose its own excise tax on
the sale of cigarettes. Suppose that in the state of North Texarkana, the state
government imposes a tax of $2.00 per pack sold within the state. In contrast,
the neighboring state of South Texarkana imposes no excise tax on cigarettes.
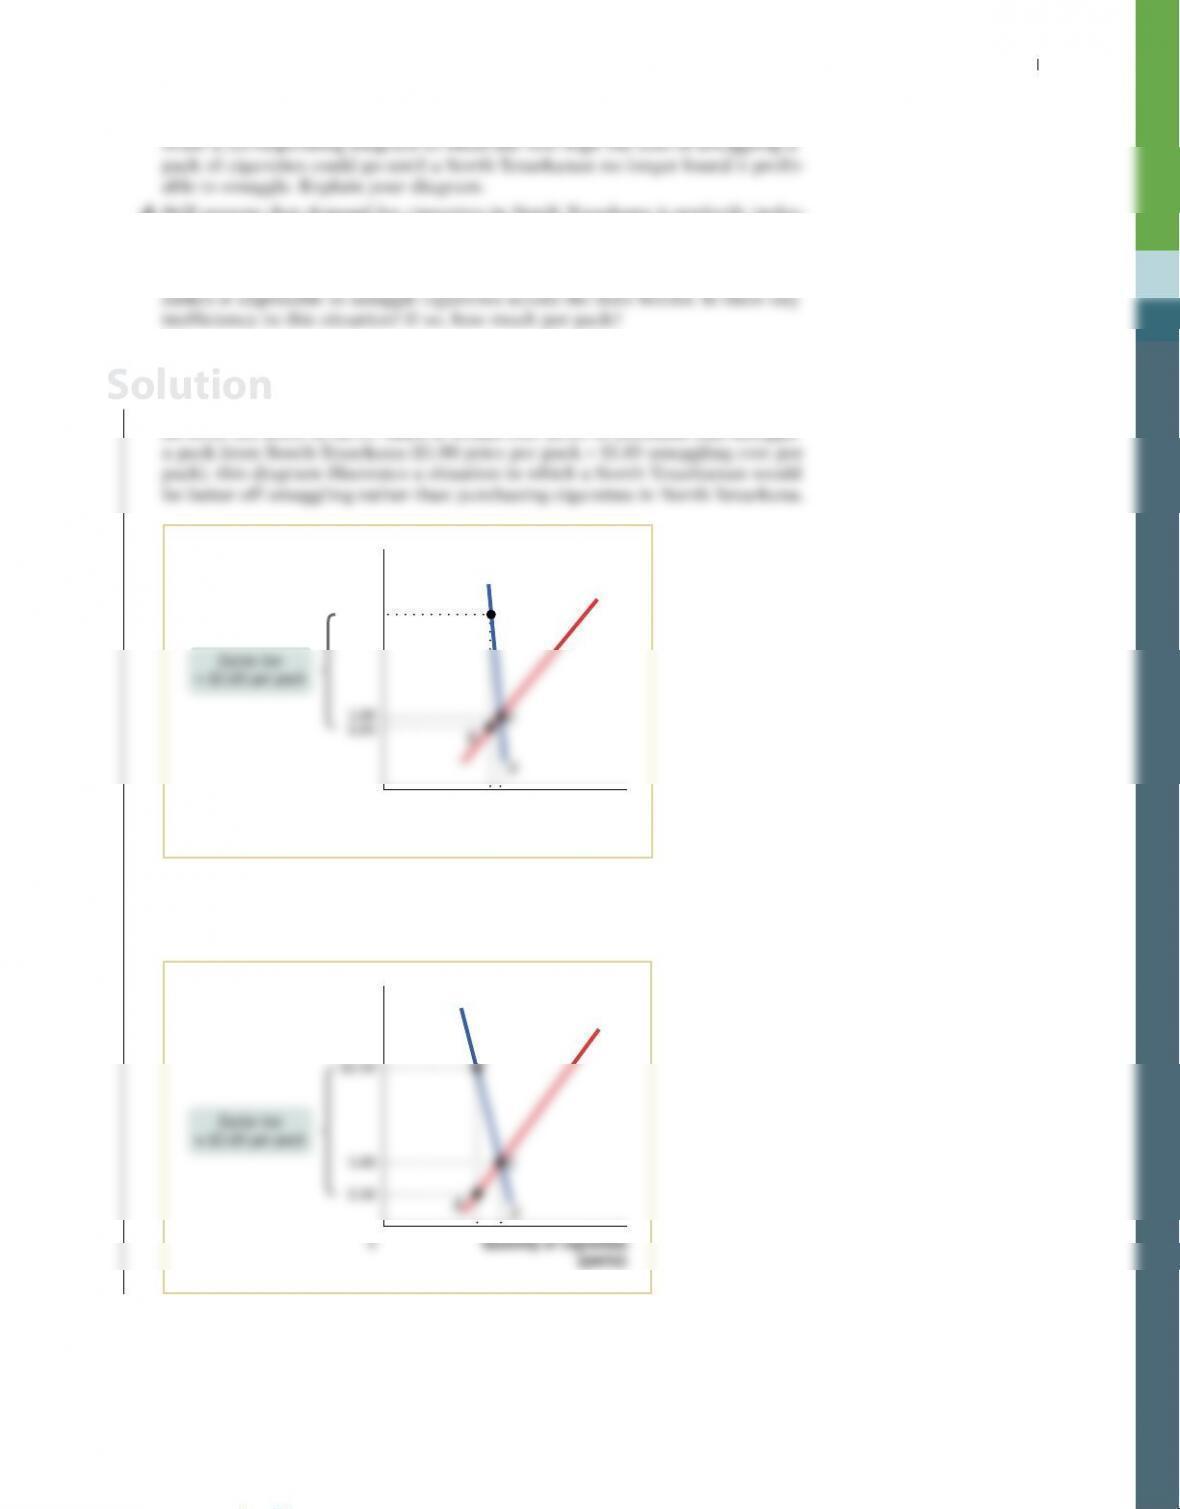
a. Draw a diagram of the supply and demand curves for cigarettes in North
Texarkana showing a situation in which it makes economic sense for a
North Texarkanan to smuggle a pack of cigarettes from South Texarkana to
North Texarkana. Explain your diagram.
b. Draw a corresponding diagram showing a situation in which it does not make
economic sense for a North Texarkanan to smuggle a pack of cigarettes from
South Texarkana to North Texarkana. Explain your diagram.
Chapter 7 Ta x e s S-103
c. Suppose the demand for cigarettes in North Texarkana is perfectly inelastic.
d. Still assume that demand for cigarettes in North Texarkana is perfectly inelas–
tic and that all smokers in North Texarkana are smuggling their cigarettes at
a cost of $1.85 per pack, so no tax is paid. Is there any inefficiency in this situ-
ation? If so, how much per pack? Suppose chip–embedded cigarette packaging
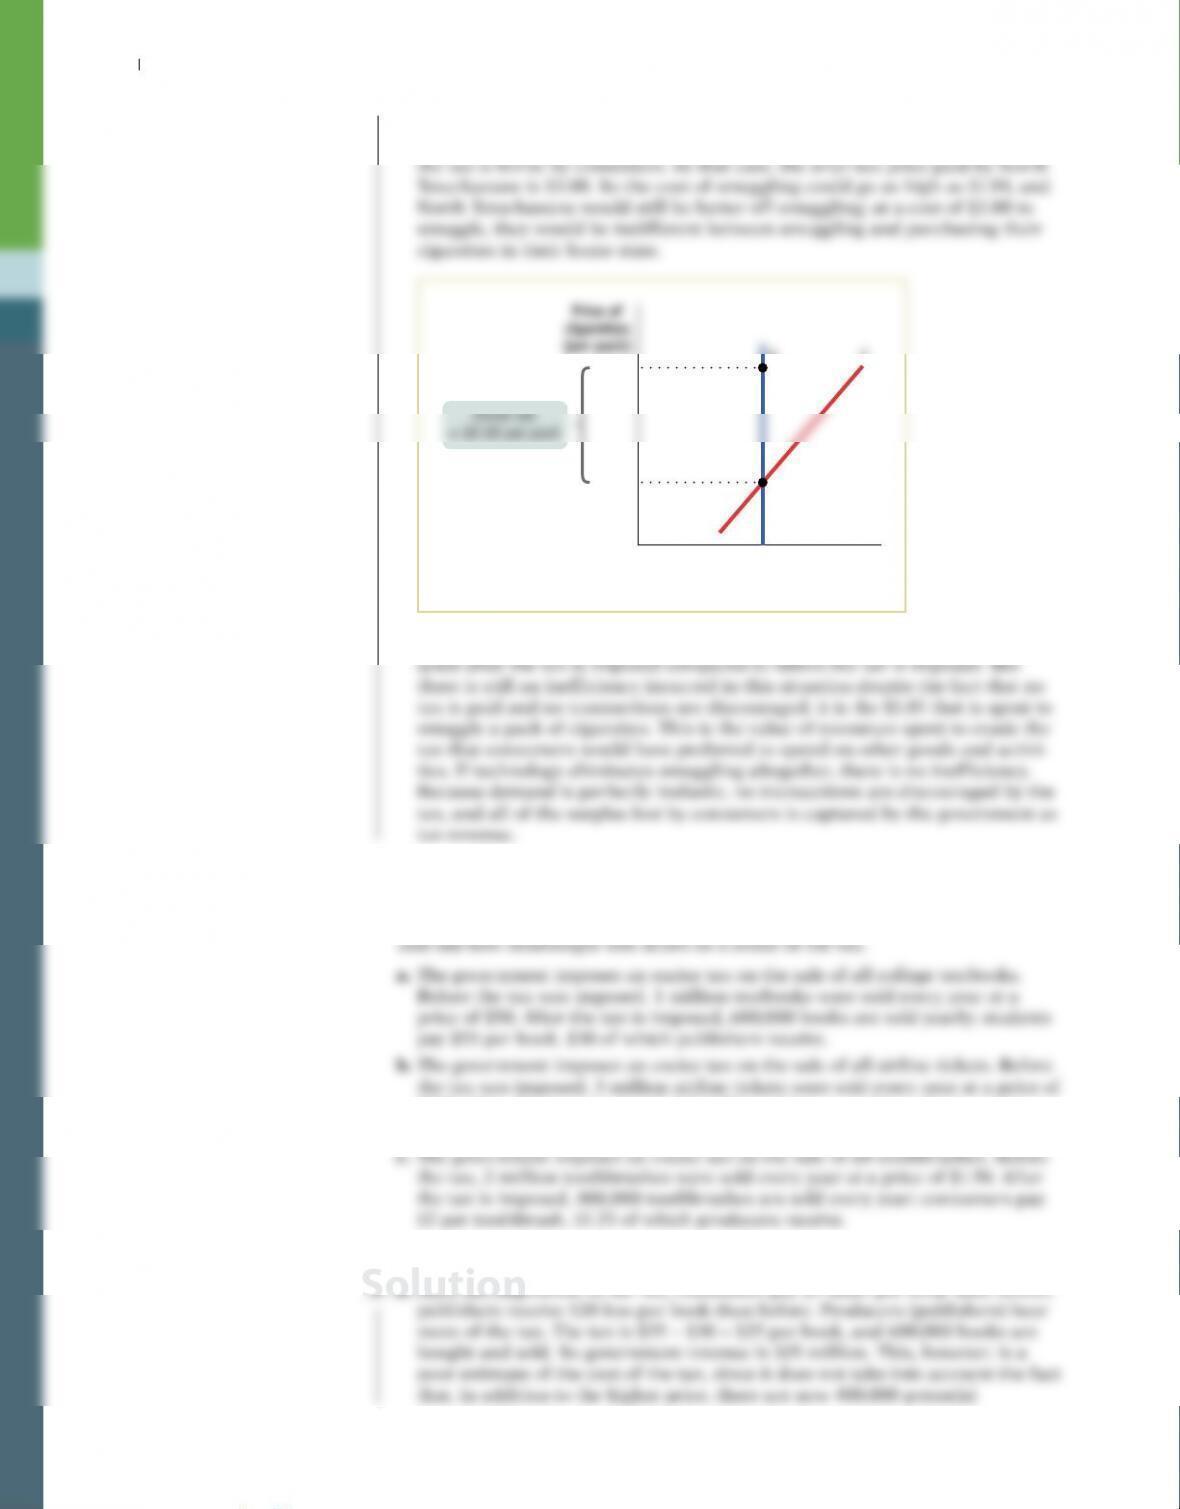
4. a. In the accompanying figure, the demand for cigarettes in North Texarkana is
relatively inelastic. So most of the $2.00 tax is borne by consumers, who pay
an after-tax price of $2.95. Since it would cost $2.85 to purchase and smuggle
$2.95
0
A
S
Price of
cigarettes
(per pack)
Quantity of cigar
ettes
(packs)
b. In the accompanying diagram, the demand in North Texarkana is less inelas-
tic. As a result, consumers pay an after-tax price of $2.50. In this case, it does
not make economic sense to smuggle.
S
A
Price of
cigarettes
(per pack)
Solution
S-104 Chapter 7 Ta x e s
c. As shown in the accompanying diagram, if the demand for cigarettes in North
Texarkana is perfectly inelastic, the demand curve is a vertical line and all of
$3.00
1.00
0
AS
E
D
Price of
cigarettes
(per pack)
Excise tax
= $2.00 per pack
Quantity of cigar
ettes
(packs)
d. Since demand is perfectly inelastic, the same number of cigarettes are trans–
5. In each of the following cases involving taxes, explain: (i) whether the incidence
of the tax falls more heavily on consumers or producers, (ii) why government
revenue raised from the tax is not a good indicator of the true cost of the tax,
$500. After the tax is imposed, 1.5 million tickets are sold yearly; travelers pay
$550 per ticket, $450 of which the airlines receive.
now 1.5 million potential consumers who would have bought tickets without
the tax but no longer buy tickets. Deadweight loss arises because consumers
and producers lose surplus that is not captured as government revenue. That
loss in surplus is represented by the 1.5 million tickets that would have been
6. The accompanying diagram shows the market for cigarettes. The current equi-
librium price per pack is $4, and every day 40 million packs of cigarettes are
sold. In order to recover some of the health care costs associated with smoking,
the government imposes a tax of $2 per pack. This will raise the equilibrium
price to $5 per pack and reduce the equilibrium quantity to 30 million packs.
40
Price of
cigarettes
(per pack)
Quantity of cigar
ettes
(millions of packs per day)
30
D
S
E
4
3
0
5
$8
Excise
tax = $2
The economist working for the tobacco lobby claims that this tax will reduce
consumer surplus for smokers by $40 million per day, since 40 million packs
now cost $1 more per pack. The economist working for the lobby for sufferers
of second-hand smoke argues that this is an enormous overestimate and that
the reduction in consumer surplus will be only $30 million per day, since after
the imposition of the tax only 30 million packs of cigarettes will be bought and
each of these packs will now cost $1 more. They are both wrong. Why? Include a
S-106 Chapter 7 Ta x e s
7. Consider the original market for pizza in Collegetown, illustrated in the accom-
panying table. Collegetown officials decide to impose an excise tax on pizza of
$4 per pizza.
Quantity of pizza Quantity of pizza
Price of pizza demanded supplied
$10 0 6
9 1 5
8 2 4
7 3 3
6 4 2
5 5 1
4 6 0
3 7 0
2 8 0
1 9 0
a. What is the quantity of pizza bought and sold after the imposition of the tax?
What is the price paid by consumers? What is the price received by producers?
b. Calculate the consumer surplus and the producer surplus after the imposition
of the tax. By how much has the imposition of the tax reduced consumer sur-
plus? By how much has it reduced producer surplus?
c. How much tax revenue does Collegetown earn from this tax?
$0). Compared to the situation before the imposition of the tax, where the
$0.) Similarly, the producer of the one pizza has a cost of $5, and this is
Chapter 7 Ta x e s S-107
the price he receives, so producer surplus is also zero. Compared to pre-tax
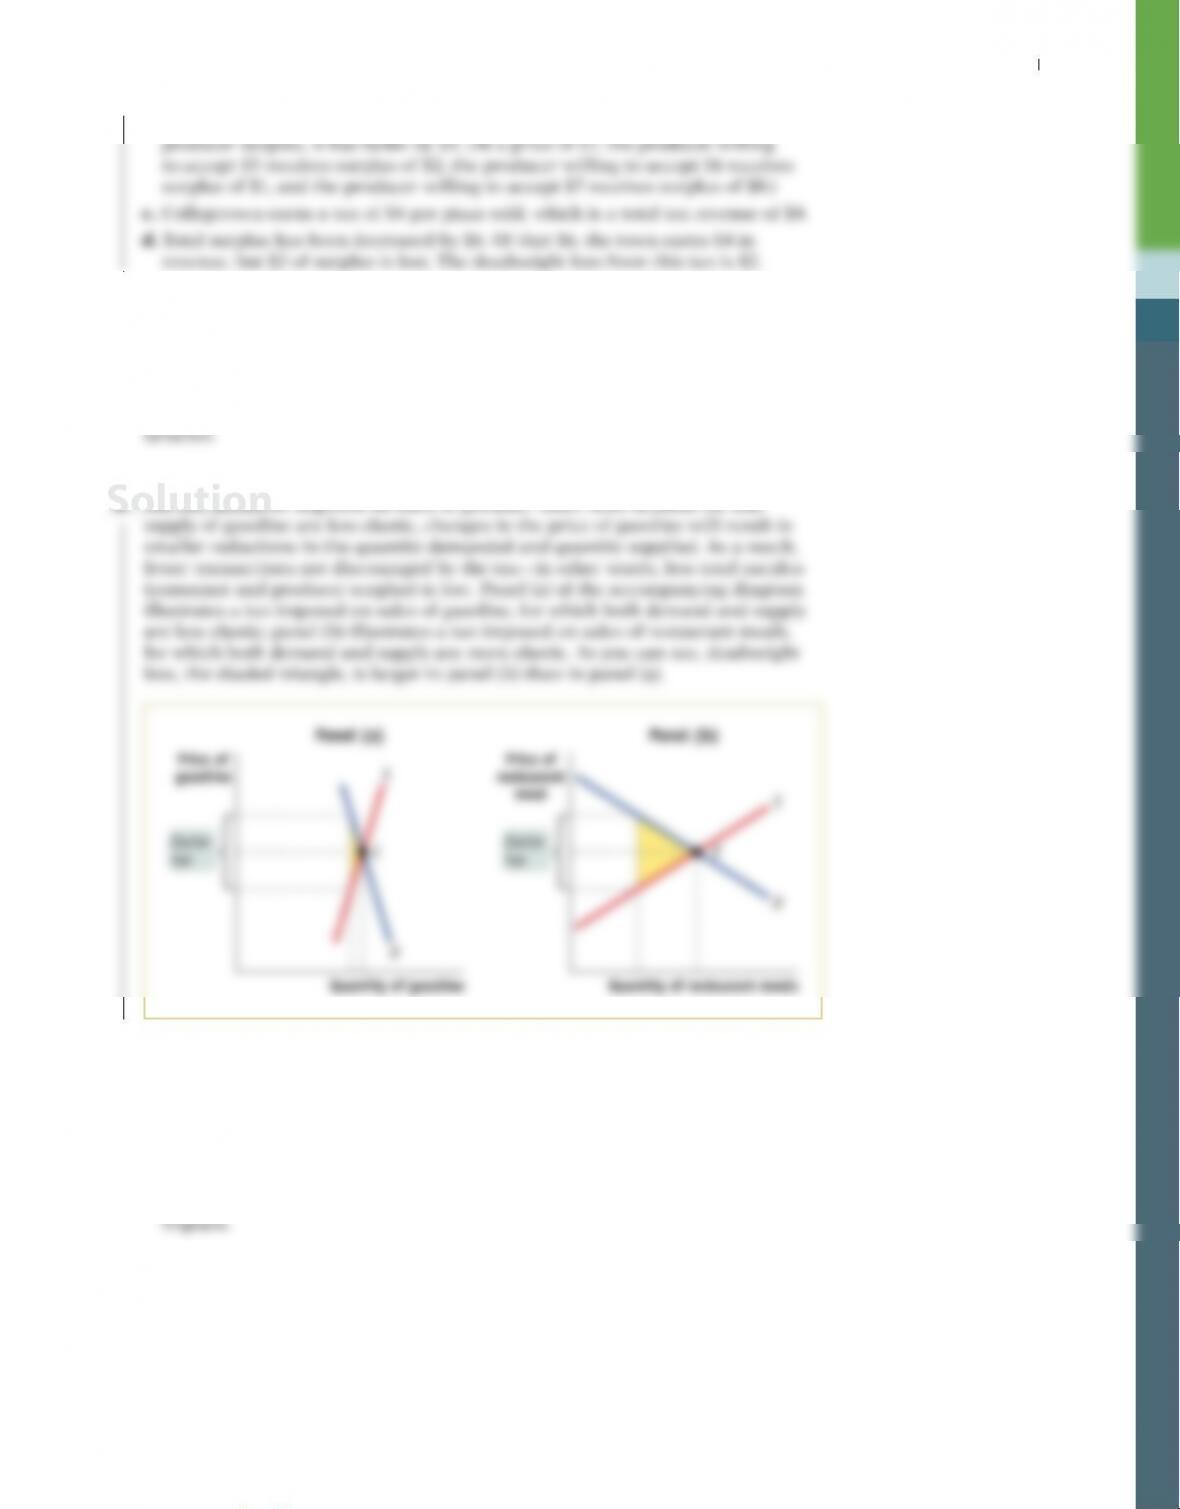
8. The state needs to raise money, and the governor has a choice of imposing an
excise tax of the same amount on one of two previously untaxed goods: restau-
rant meals or gasoline. Both the demand for and the supply of restaurant meals
are more elastic than the demand for and the supply of gasoline. If the governor
wants to minimize the deadweight loss caused by the tax, which good should be
taxed? For each good, draw a diagram that illustrates the deadweight loss from
8. The tax should be imposed on sales of gasoline. Since both demand for and
Quantity of gasoline
D
Quantity of restaurant meals
D
9. Assume that demand for gasoline is inelastic and supply is relatively elastic. The
government imposes a sales tax on gasoline. The tax revenue is used to fund
research into clean fuel alternatives to gasoline, which will improve the air we
all breathe.
a. Who bears more of the burden of this tax, consumers or producers? Show in a
diagram who bears how much of the excess burden.
b. Is this tax based on the benefits principle or the ability-to-pay principle?
Solution
10. Assess the following four tax policies in terms of the benefits principle versus the
ability-to–pay principle.
11. For this Discovering Data exercise, use FRED (fred.stlouisfed.org) to
create a graph comparing the sources of government tax revenue for the
United States over time. Under the tools tab select “Published Data Lists.” Find
the list “Government Revenue by Source” and create a line graph that combines
all three series.
a. Using data from your graph, which source of government revenue is the larg-
est? How have revenue sources changed over time?
To measure the growth of government revenue since the start of the 2007
recession, follow these steps to format your graph as an index graph where
2007-12–01 = 100.
i. Select “Edit Graph” and under “Edit Line 1” change “Units” to
“Index (Scale value to 100 for chosen data).”
ii. In the box “U.S. recession” select “2007–12-01 Start” and then
“Copy to All.”
iii. In the graph frame change the time span from 2007-10–01 to
today.
b. Using the values in the graph, calculate the growth rate of each source of
government revenue since 2007–12-01. Which has grown the fastest?
11. a. Answers to this Discovering Data exercise can be found online.
12. You are advising the government on how to pay for national defense. There are
two proposals for a tax system to fund national defense. Under both proposals,
the tax base is an individual’s income. Under proposal A, all citizens pay exactly
the same lump-sum tax, regardless of income. Under proposal B, individuals
with higher incomes pay a greater proportion of their income in taxes.
a. Is the tax in proposal A progressive, proportional, or regressive? What about
the tax in proposal B?
Solution
S-110 Chapter 7 Ta x e s
c. In terms of efficiency, the lump-sum tax is better. The lump-sum tax cre–
ates a marginal tax rate of zero: once the tax is paid, every additional dollar
13. Each of the following tax proposals has income as the tax base. In each case,
calculate the marginal tax rate for each level of income. Then calculate the
percentage of income paid in taxes for an individual with a pre-tax income
of $5,000 and for an individual with a pre-tax income of $40,000. Classify the
tax as being proportional, progressive, or regressive. (Hint: You can calculate
the marginal tax rate as the percentage of an additional $1 in income that is
taxed away.)
a. All income is taxed at 20%.
d. Each individual who earns more than $10,000 pays a lump–sum tax of $10,000.
If the individual’s income is less than $10,000, that individual pays in taxes
exactly what his or her income is.
e. Of the four tax policies, which is likely to cause the worst incentive problems?
14. In Transylvania the basic income tax system is fairly simple. The first 40,000 syl-
vers (the official currency of Transylvania) earned each year are free of income
tax. Any additional income is taxed at a rate of 25%. In addition, every indi-
vidual pays a social security tax, which is calculated as follows: all income up
to 80,000 sylvers is taxed at an additional 20%, but there is no additional social
security tax on income above 80,000 sylvers.
a. Calculate the marginal tax rates (including income tax and social security tax)
for Transylvanians with the following levels of income: 20,000 sylvers, 40,000
sylvers, and 80,000 sylvers. (Hint: You can calculate the marginal tax rate as
the percentage of an additional 1 sylver in income that is taxed away.)
b. Is the income tax in Transylvania progressive, regressive, or proportional? Is
the social security tax progressive, regressive, or proportional?
15. You work for the Council of Economic Advisers, providing economic
advice to the White House. The president wants to overhaul the income tax sys-
tem and asks your advice. Suppose that the current income tax system consists
of a proportional tax of 10% on all income and that there is one person in the
country who earns $110 million; everyone else earns less than $100 million. The
president proposes a tax cut targeted at the very rich so that the new tax system
would consist of a proportional tax of 10% on all income up to $100 million and
a marginal tax rate of 0% (no tax) on income above $100 million. You are asked
to evaluate this tax proposal.
a. For incomes of $100 million or less, is this proposed tax system progressive,
regressive, or proportional? For incomes of more than $100 million? Explain.

S-112 Chapter 7 Ta x e s
b. Would this tax system create more or less tax revenue, other things equal? Is
this tax system more or less efficient than the current tax system? Explain.
15. a. This tax system is proportional up to an income of $100 million. Above $100
16. The U.S. government wants to help the American auto industry compete
against foreign automakers that sell trucks in the United States. It can do
this by imposing an excise tax on each foreign truck sold in the United
States. The hypothetical pre-tax demand and supply schedules for imported
trucks are given in this table.
Price of
Quantity of imported trucks
(thousands)
imported truck Quantity demanded Quantity supplied
$32,000 100 400
31,000 200 350
30,000 300 300
29,000 400 250
28,000 500 200
27,000 600 150
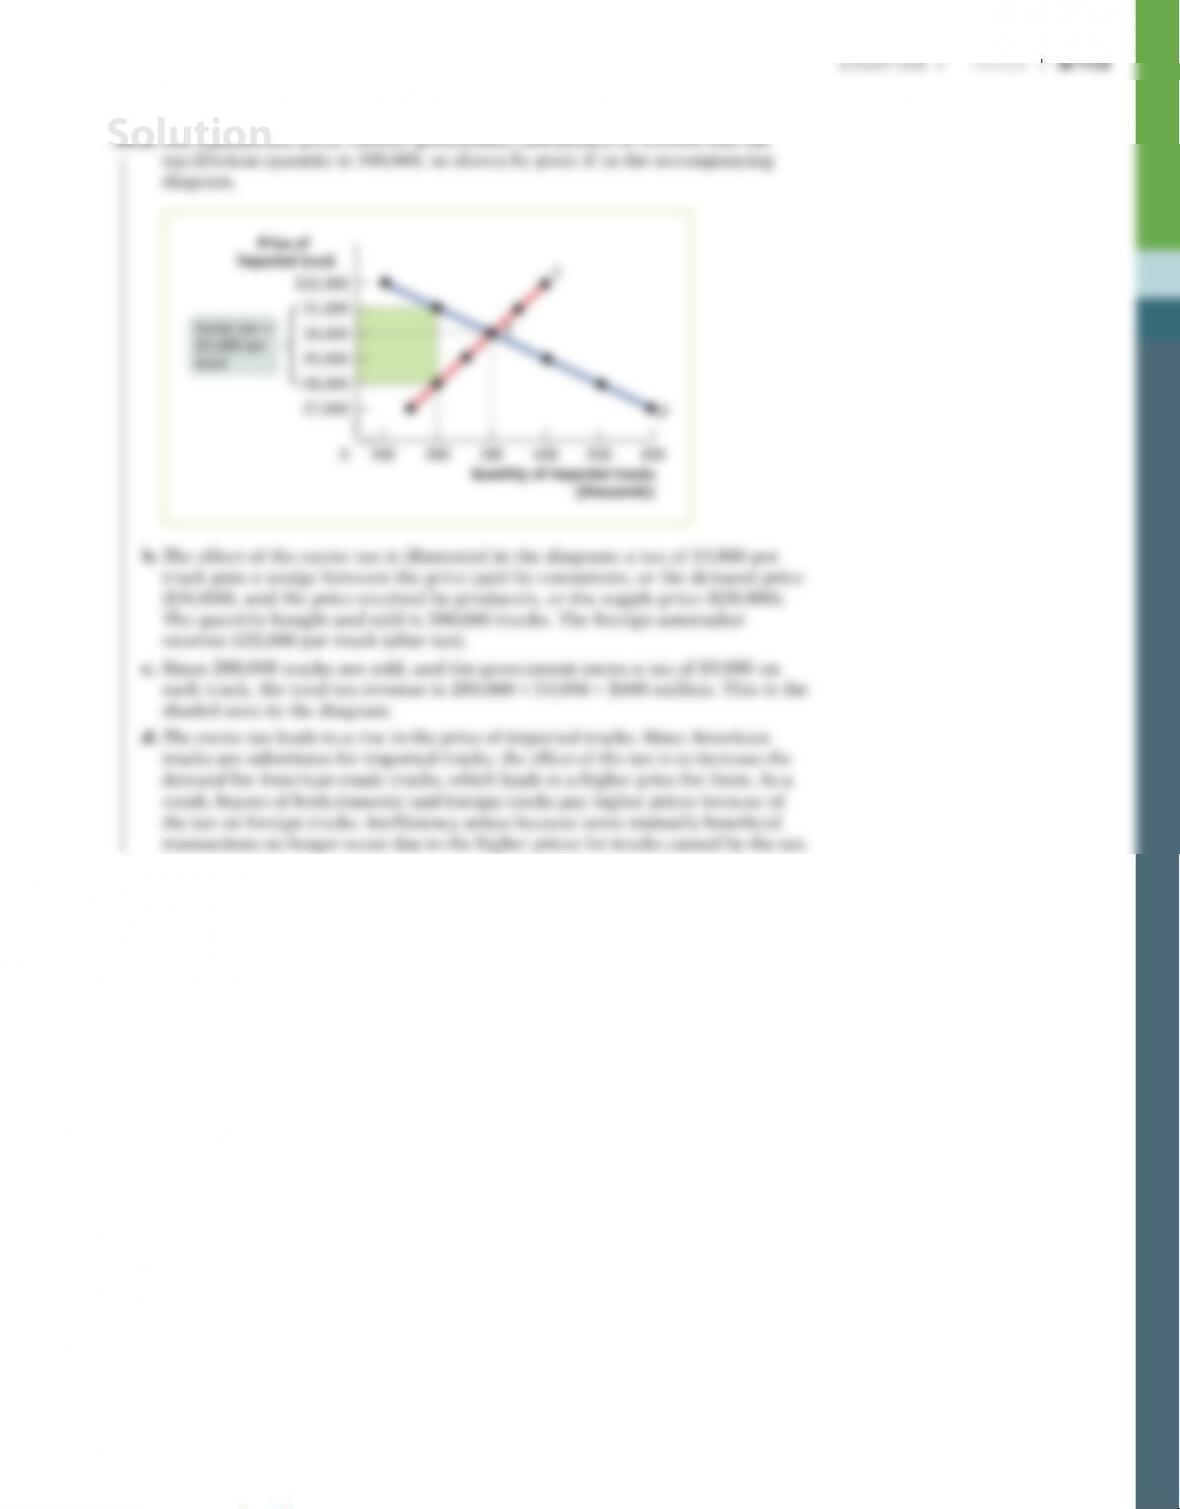
a. In the absence of government interference, what is the equilibrium
price of an imported truck? The equilibrium quantity? Illustrate with a
diagram.
b. Assume that the government imposes an excise tax of $3,000 per imported
truck. Illustrate the effect of this excise tax in your diagram from part a.
How many imported trucks are now purchased and at what price? How
much does the foreign automaker receive per truck?
c. Calculate the government revenue raised by the excise tax in part b. Illus–
trate it on your diagram.
d. How does the excise tax on imported trucks benefit American automak–
ers? Whom does it hurt? How does inefficiency arise from this govern-
ment policy?
Solution