interactive activity
Chapter 7
GDP and the CPI:
Tracking the
Macroeconomy
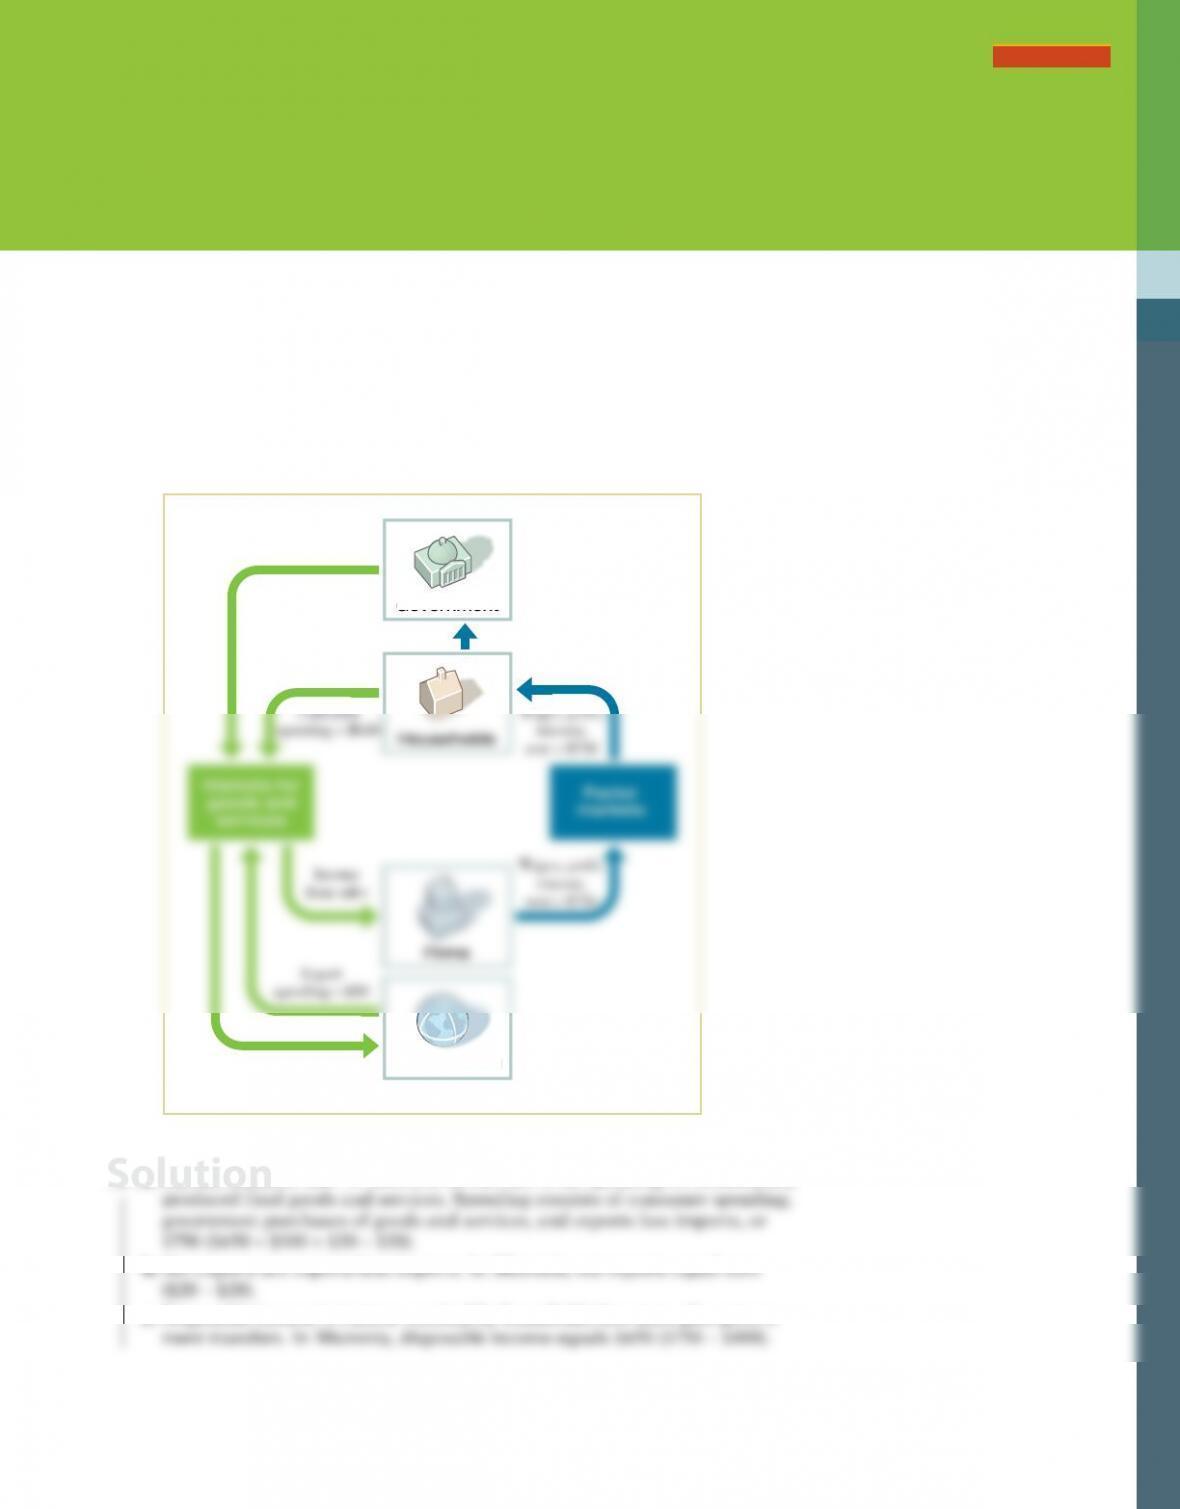
1. Below is a simplified circular-flow diagram for the economy of Micronia.
(Note that there is no investment spending and no transfers in Micronia.)
a. What is the value of GDP in Micronia?
b. What is the value of net exports?
c. What is the value of disposable income?
d. Does the total flow of money out of households—the sum of taxes paid and
consumer spending—equal the total flow of money into households?
e. How does the government of Micronia finance its purchases of goods and services?
Households
Government
Government
House
h
o
l
ds
Government
Income
from sales
Consumer
spending = $650
Wages, profit,
interest,
rent = $750
Wages, profit,
interest,
rent = $750
Government
purchases = $100
Taxes = $100
S-100 Chapter 7 GDP anD the CPI: traCkInG the MaCroeConoMy
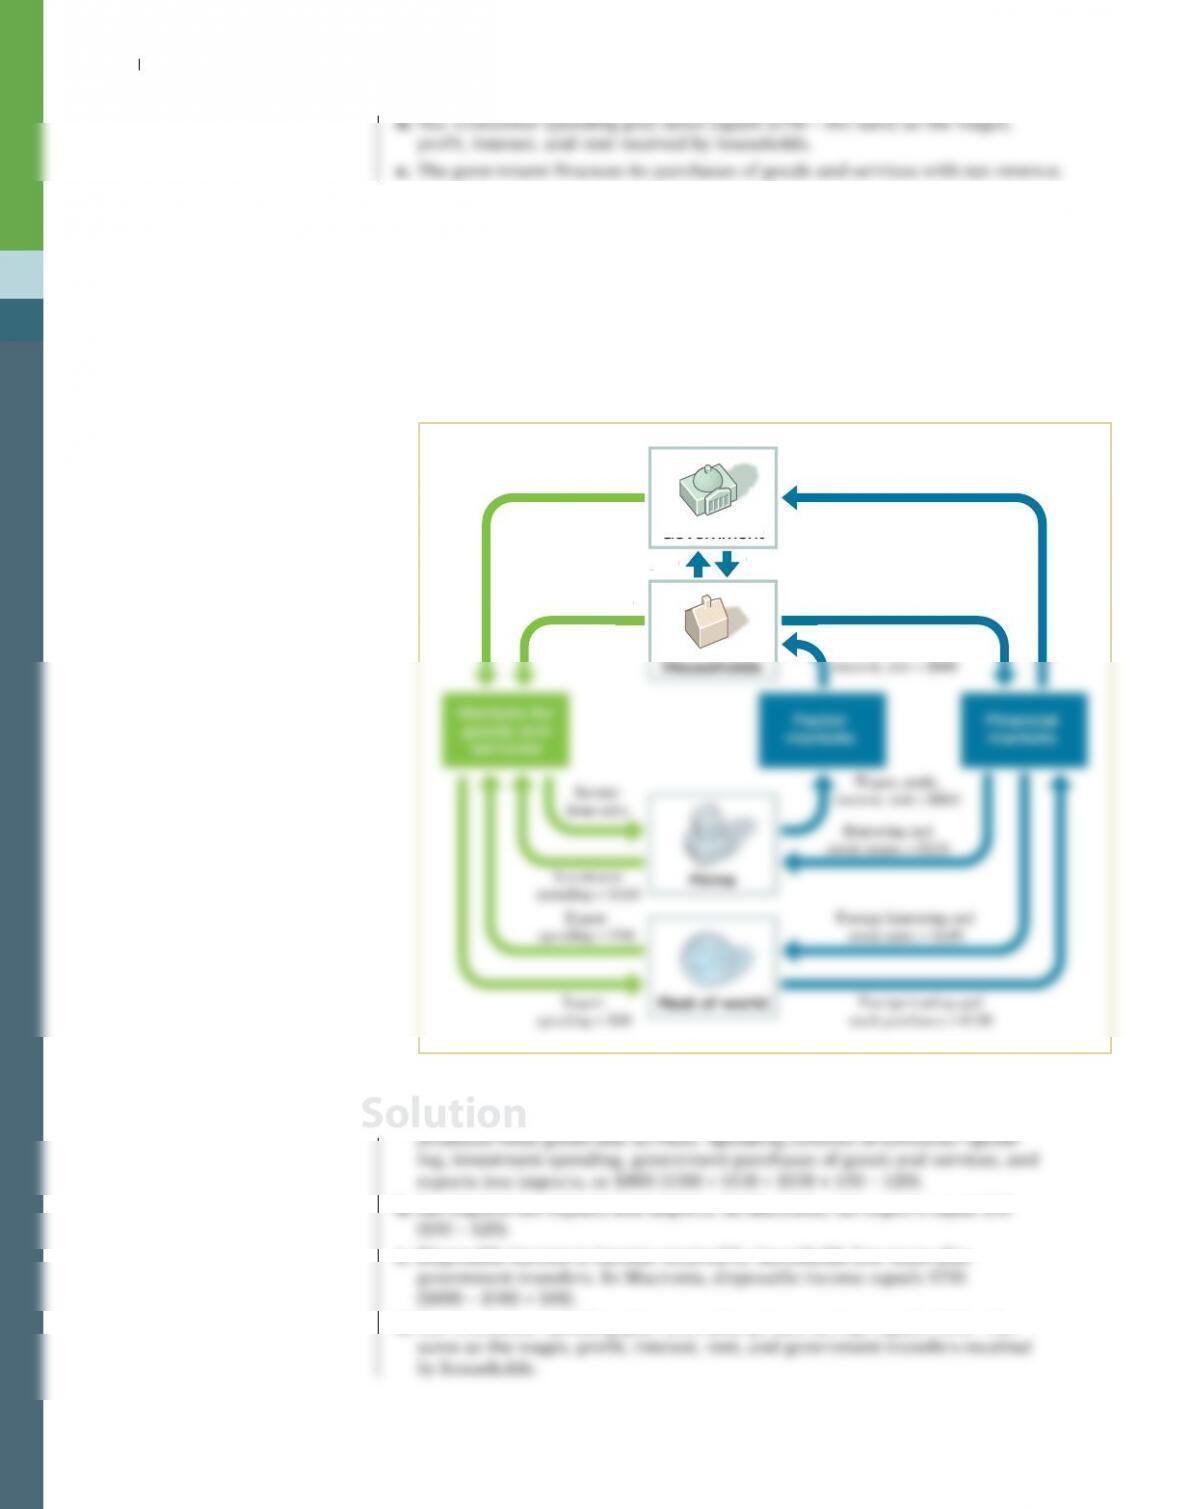
2. A more complex circular-flow diagram for the economy of Macronia is shown
below.
a. What is the value of GDP in Macronia?
b. What is the value of net exports?
c. What is the value of disposable income?
d. Does the total flow of money out of households—the sum of taxes paid, con-
sumer spending, and private savings—equal the total flow of money into
households?
Transfers = $10Taxes = $100
Wages, profit,
Markets for
Government
$
Government
Private savings = $200
Consumer
spending = $510
xes = $100
T
ransfers =
$
100
Government
5
10
Government
purchases = $150
Government
borrowing = $60
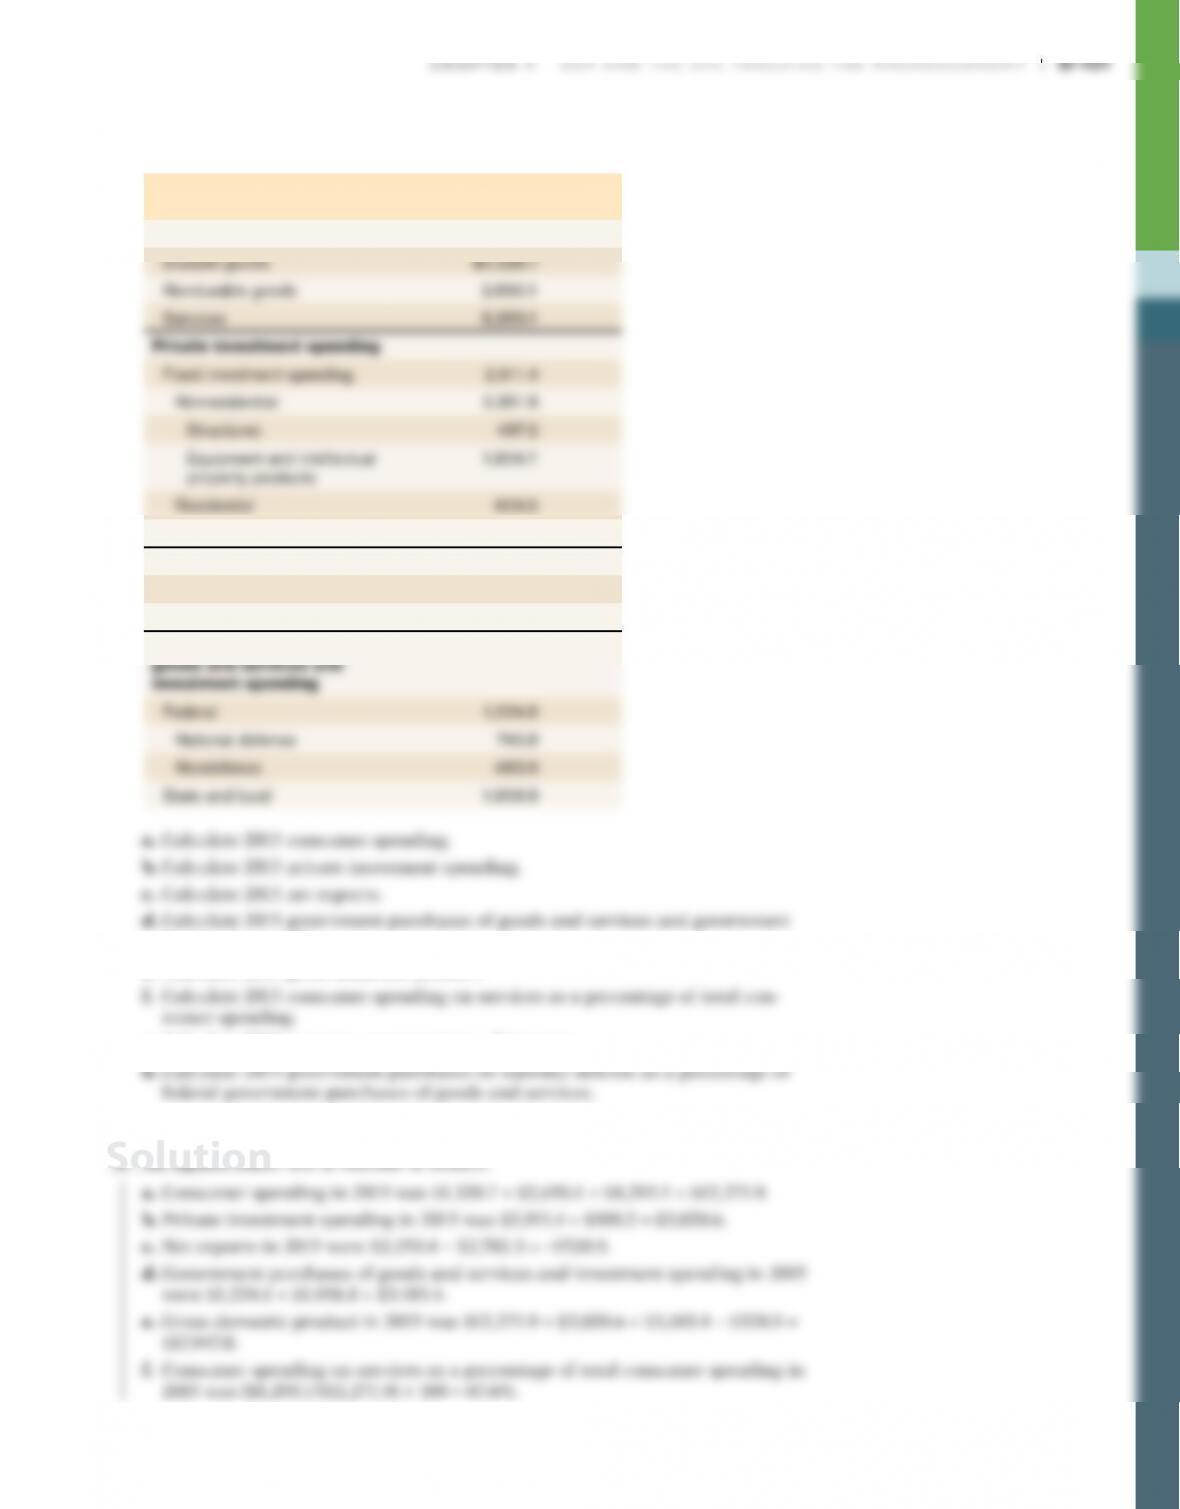
3. The components of GDP in the accompanying table were produced by the
Bureau of Economic Analysis.
Category
Components of GDP in 2015
(billions of dollars)
Consumer spending
Change in private inventories 109.2
Net exports
Exports
Imports
2,253.4
2,782.3
Government purchases of
investment spending.
e. Calculate 2015 gross domestic product.
g. Calculate 2015 exports as a percentage of imports.
3. All figures below are in billions of dollars.
Solution
S-102 Chapter 7 GDP anD the CPI: traCkInG the MaCroeConoMy
g. Exports as a percentage of imports in 2015 were ($2,253.4/$2,782.3) ×
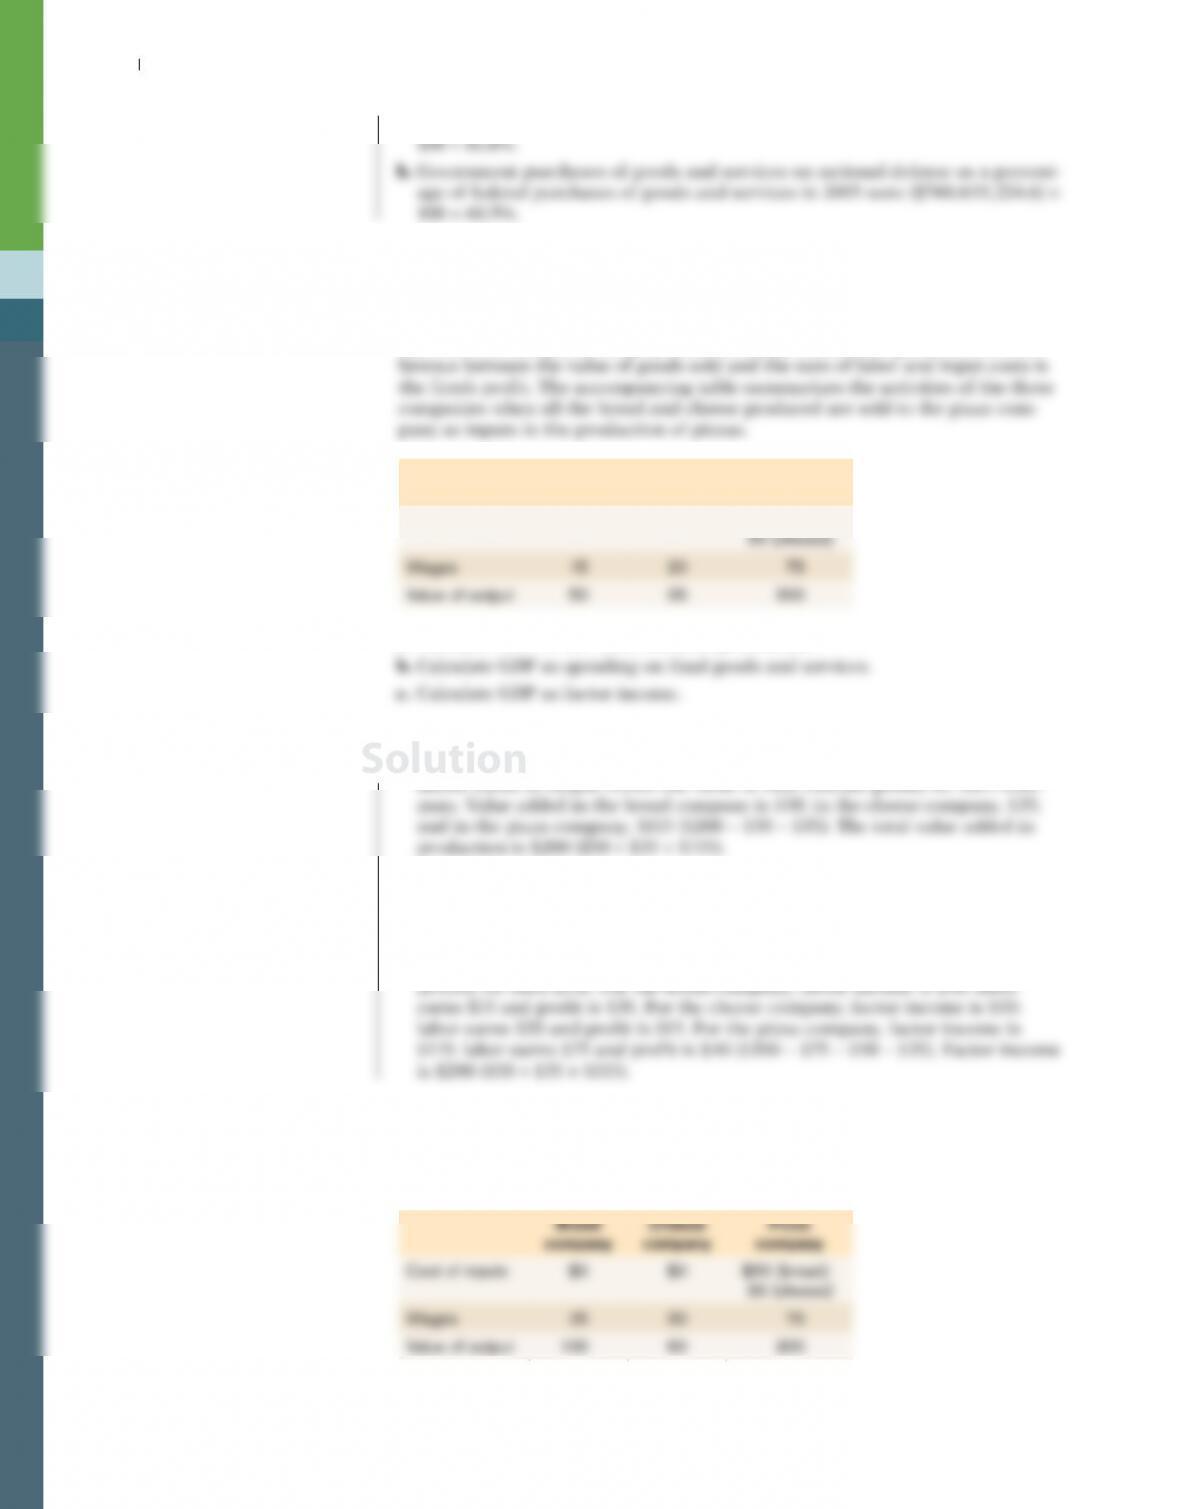
4. The small economy of Pizzania produces three goods (bread, cheese, and pizza),
each produced by a separate company. The bread and cheese companies pro–
duce all the inputs they need to make bread and cheese, respectively. The pizza
company uses the bread and cheese from the other companies to make its piz-
zas. All three companies employ labor to help produce their goods, and the dif-
Bread
company
Cheese
company
Pizza
company
Cost of inputs $0 $0 $50 (bread)
a. Calculate GDP as the value added in production.
4. a. To calculate GDP as the value added in production, we need to sum all value
added (value of output minus the value of intermediate goods) for each com-
b. To calculate GDP as spending on final goods and services, we only need to
include the value of pizzas because all bread and cheese produced are inter-
mediate goods used in the production of pizzas. Spending on final goods and
services is $200.
c. To calculate GDP as factor income, we need to sum factor income (wages and
5. In the economy of Pizzania (from Problem 4), bread and cheese produced are
sold both to the pizza company for inputs in the production of pizzas and to con-
sumers as final goods. The accompanying table summarizes the activities of the
three companies.
Solution
Chapter 7 GDP anD the CPI: traCkInG the MaCroeConoMy S-103
a. Calculate GDP as the value added in production.
5. a. To calculate GDP as the value added in production, we need to sum all value
b. To calculate GDP as spending on final goods and services, we need to sum the
value of bread, cheese, and pizzas sold as final goods. The bread company pro–
duces a value of output of $50, which goes to the pizza company as an inter-
c. To calculate GDP as factor income, we need to sum factor income (labor and
profits) for each firm. For the bread company, factor income is $100: labor
6. Which of the following transactions will be included in GDP for the United
States?
a. Coca-Cola builds a new bottling plant in the United States.
b. Delta sells one of its existing airplanes to Korean Air.
c. Ms. Moneybags buys an existing share of Disney stock.
6. a. When Coca–Cola builds a new bottling plant, it is investment spending and
included in GDP.
b. If Delta sells one of its airplanes to Korean Air, this transaction is not included
in GDP because it does not represent production during the current time
period. The airplane would have been included in GDP when it was produced;
now it is just a sale of a used item.
c. When an individual buys an existing share of stock, the transaction is not
included in GDP because there is no production.
Solution
Solution
7. Access the Discovering Data exercise for Chapter 7 online to answer the
following questions.
a. What was GDP for the United States last year?
c. Which component of GDP was the largest last year? Which was the smallest?
What is the most recent year in which net exports were positive?
d. What happened to the size of government spending during the 1940s? What
factors likely caused the shift?
8. The accompanying table shows data on nominal GDP (in billions of dollars), real
GDP (in billions of 2009 dollars), and population (in thousands) of the United
States in 1965, 1975, 1985, 1995, 2005, and 2015. The U.S. price level rose consis–
tently over the period 1965–2015.
Nominal GDP
(billions of
dollars)
Real GDP
(billions of 2009
dollars)Year
Population
(thousands)
1965 $743.7 $3,976.7 194,250
1975 1,688.9 5,385.4 215,891
a. Why is real GDP greater than nominal GDP for all years until 2005 and lower
for 2015?
b. Calculate the percent change in real GDP from 1965 to 1975, 1975 to 1985,
1985 to 1995, 1995 to 2005, and 2005 to 2015. Which period had the highest
growth rate?
c. Calculate real GDP per capita for each of the years in the table.
d. Calculate the percent change in real GDP per capita from 1965 to 1975, 1975
to 1985, 1985 to 1995, 1995 to 2005, and 2005 to 2015. Which period had the
highest growth rate?
8. a. The base year is 2009, and from 1965–2005, prices rose. To calculate real GDP
for the years 1965, 1975, 1985, 1995, 2005, we would multiply output in those
years by the higher prices that existed in 2009. To calculate nominal GDP,
we would multiply output by the lower prices that existed in those particular
Solution
Chapter 7 GDP anD the CPI: traCkInG the MaCroeConoMy S-105
b. The accompanying table shows the percent change in real GDP from 1965 to
1975, 1975 to 1985, 1985 to 1995, 1995 to 2005, and 2005 to 2015. The percent
change in real GDP was the highest from 1975 to 1985.
Year
Real GDP
(billions of
2009 dollars)
Percent
change in
real GDP
1965 $3,976.7
1975 5,385.4 35.4%
c. Real GDP per capita (2009 dollars)
1965 $20,472
1975 24,945
1985 31,851
d. The years from 1975 through 1985 had the highest growth rate, as shown in
the table.
Percent change in real GDP per capita
1965–1975 21.8%
1975–1985 27.7%
e. For a given time period, the percent change in real GDP is consistently larger
than the percent change in real GDP per capita. We should expect this pattern
because the U.S. population was growing from 1965 to 2015.
9. Eastland College is concerned about the rising price of textbooks that students
must purchase. To better identify the increase in the price of textbooks, the dean
asks you, the Economics Department’s star student, to create an index of text-
book prices. The average student purchases three English, two math, and four
economics textbooks per year. The prices of these books are given in the accom-
panying table.
2014 2015 2016
English textbook $100 $110 $114
a. What is the percent change in the price of an English textbook from 2014 to
2016?
b. What is the percent change in the price of a math textbook from 2014 to 2016?
S-106 Chapter 7 GDP anD the CPI: traCkInG the MaCroeConoMy
d. Using 2015 as a base year, create a price index for these books for all years.
e. What is the percent change in the price index from 2014 to 2016?
d. To create an index of textbook prices, you must first calculate the cost of the
market basket (three English, two math, and four economics textbooks) in
each of the three years; then normalize it by dividing the cost of the market
basket in a given year by the cost of the market basket in the base period; and
then multiply by 100 to get an index value (base period of 2015 = 100).
Cost of textbooks in 2014 = (3 × $100) + (2 × $140) + (4 × $160) = $1,220
Cost of textbooks in 2015 = (3 × $110) + (2 × $144) + (4 × $180) = $1,338
e. The percent change in the price index for textbooks from 2014 to 2016 is 17.9%
(equal to ((107.5 − 91.2)/91.2) × 100).
10. The consumer price index, or CPI, measures the cost of living for a typical urban
household by multiplying the price for each category of expenditure (housing,
food, and so on) times a measure of the importance of that expenditure in the
average consumer’s market basket and summing over all categories. However,
using data from the consumer price index, we can see that changes in the cost
of living for different types of consumers can vary a great deal. Let’s compare
CPI
May 2016
Housing 242.8
Food 248.0
Calculate the overall CPI for the retired person and for the college student by
multiplying the CPI for each of the categories by the relative importance of that
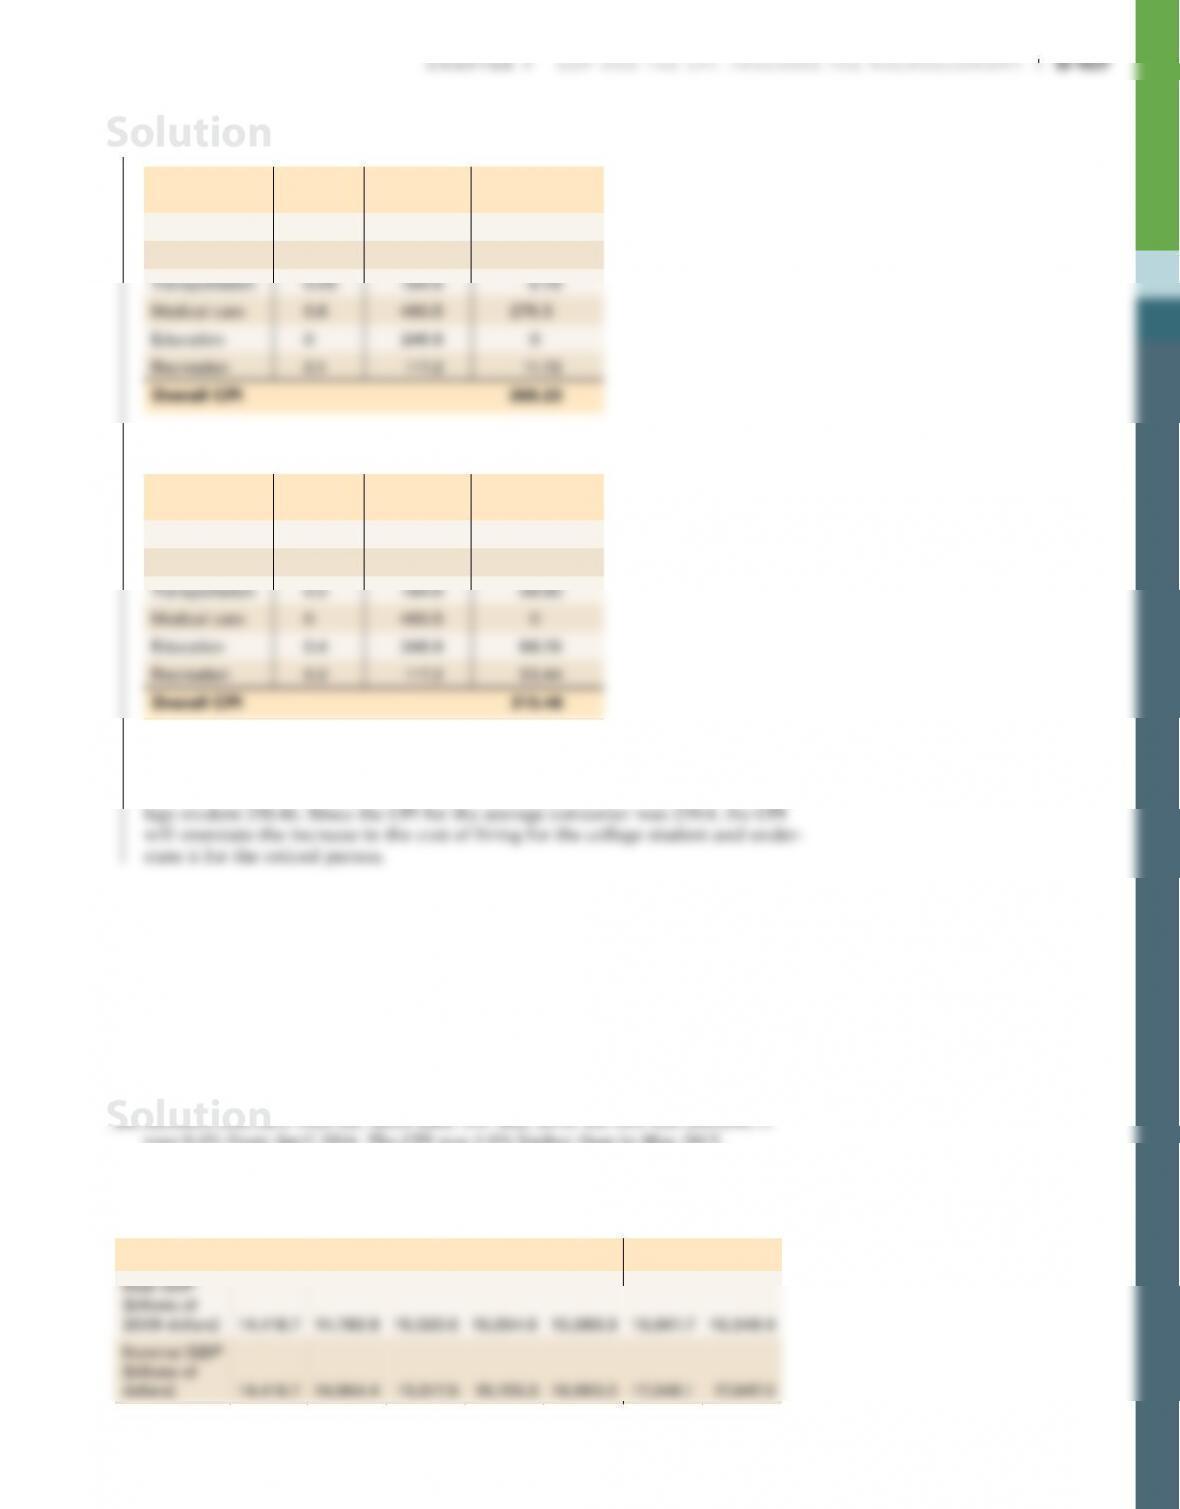
10. For the retired person:
Weight
CPI
May 2016
CPI
Contribution
Housing 0.1 242.8 24.28
Food 0.15 248.0 37.2
For the college student:
Weight
CPI
May 2016
CPI
Contribution
Housing 0.05 242.8 12.14
Food 0.15 248.0 37.2
To calculate the CPI for the retired person and for the college student, we need
to weight the CPI for each component with the importance of that component in
his or her market basket. The CPI for the retired person is 359.23 and for the col-
11. Go to The Bureau of Labor Statistics home page at www.bls.gov. Place the cur-
sor over the “Economic Releases” tab and then click on “Major Economic Indi-
cators” in the drop–down menu that appears. Once on the “Major Economic
Indicators” page, click on “Consumer Price Index.” On that page, under “Table
of Contents,” click on “Table 1: Consumer Price Index for All Urban Consumers.”
Using the “unadjusted” figures, determine what the CPI was for the previous
month. How did it change from the previous month? How does the CPI compare
to the same month one year ago?
rose 0.4% from April 2016. The CPI was 1.0% higher than in May 2015.
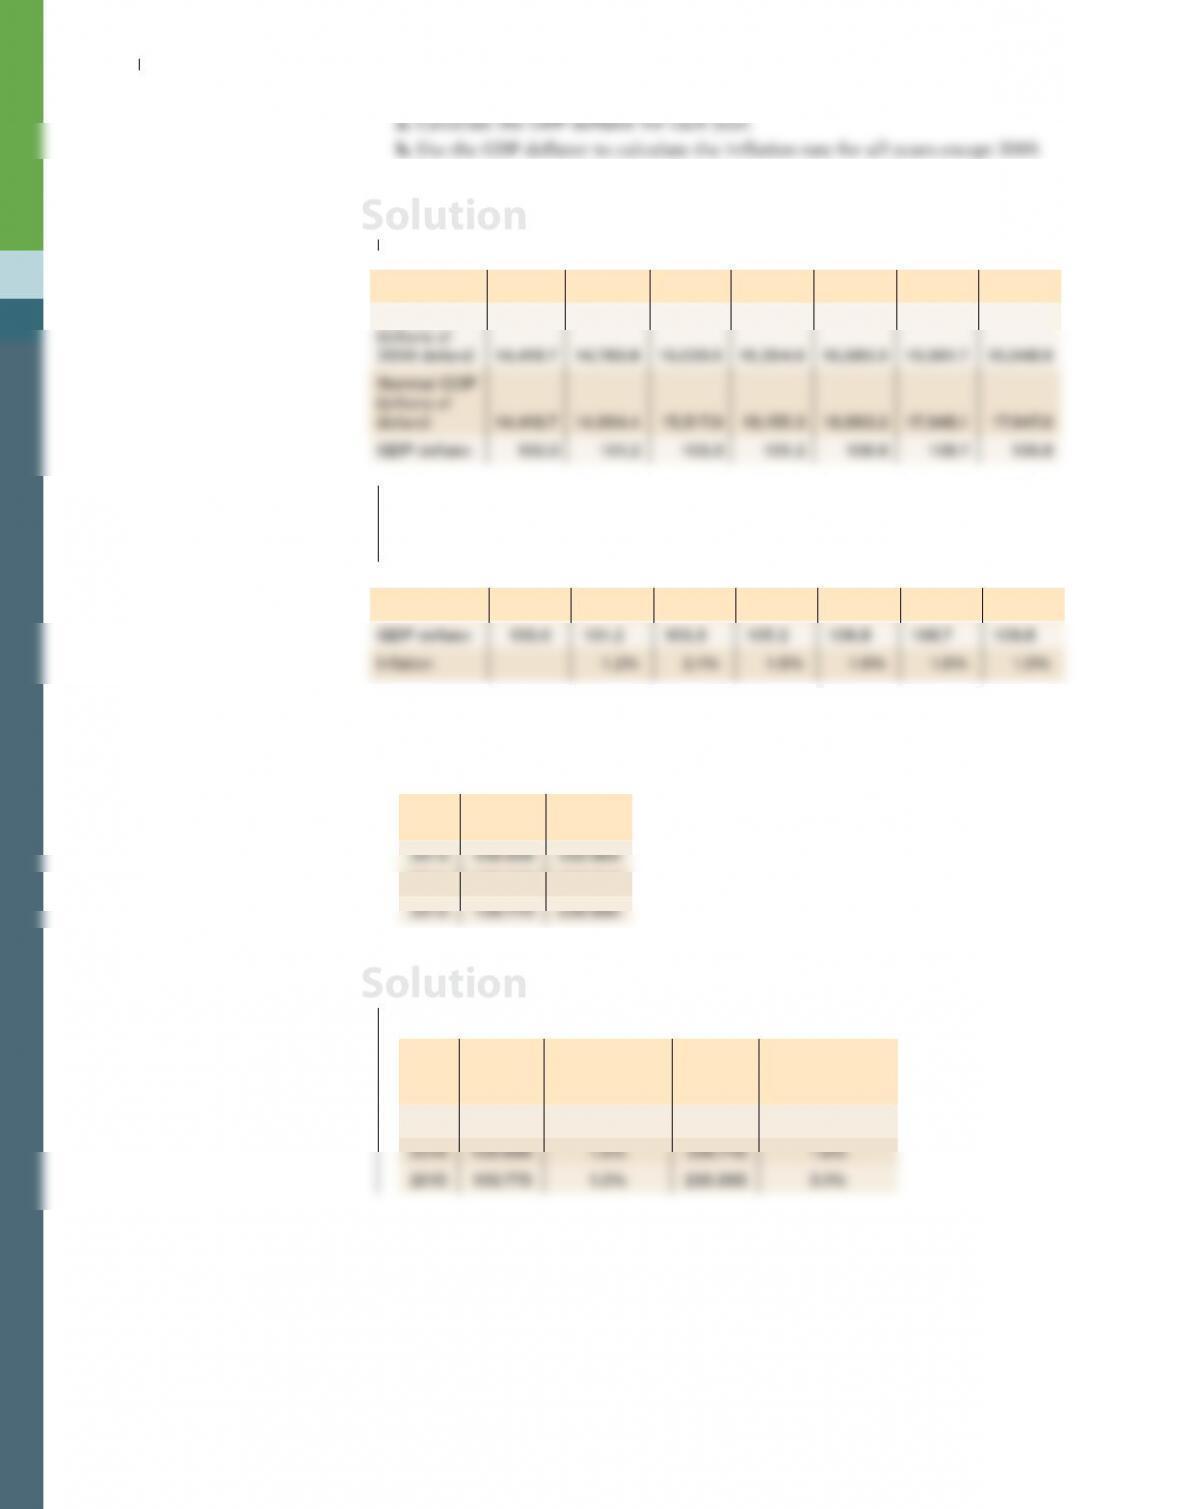
12. The accompanying table provides the annual real GDP (in billions of 2009
dollars) and nominal GDP (in billions of dollars) for the United States.
2009 2010 2011 2012 2013 2014 2015
Solution
S-108 Chapter 7 GDP anD the CPI: traCkInG the MaCroeConoMy
12. a. The GDP deflator in a given year is 100 times the ratio of nominal GDP to real
GDP, yielding the figures in the accompanying table.
2010 2011 2012 2013 2014 2015
Real GDP
2009
b. The inflation rate obtained by using the GDP deflator is calculated using the
formula ((current GDP deflator − GDP deflator in the previous year)/(GDP
deflator in the previous year)) × 100, yielding the figures in the accompanying
table.
2009 2010 2011 2012 2013 2014 2015
13. The accompanying table contains two price indexes for the years 2013, 2014, and
2015: the GDP deflator and the CPI. For each price index, calculate the inflation
rate from 2013 to 2014 and from 2014 to 2015.
Year
GDP
deflator CPI
2014 108.686 236.715
13. The accompanying table calculates the inflation rates based on the GDP deflator
and on the CPI.
Year
GDP
deflator
Inflation rate
(based on
GDP deflator)
CPI
Inflation rate
(based on CPI)
2013 106.929 232.964
Solution
Solution
Chapter 7 GDP anD the CPI: traCkInG the MaCroeConoMy S-109
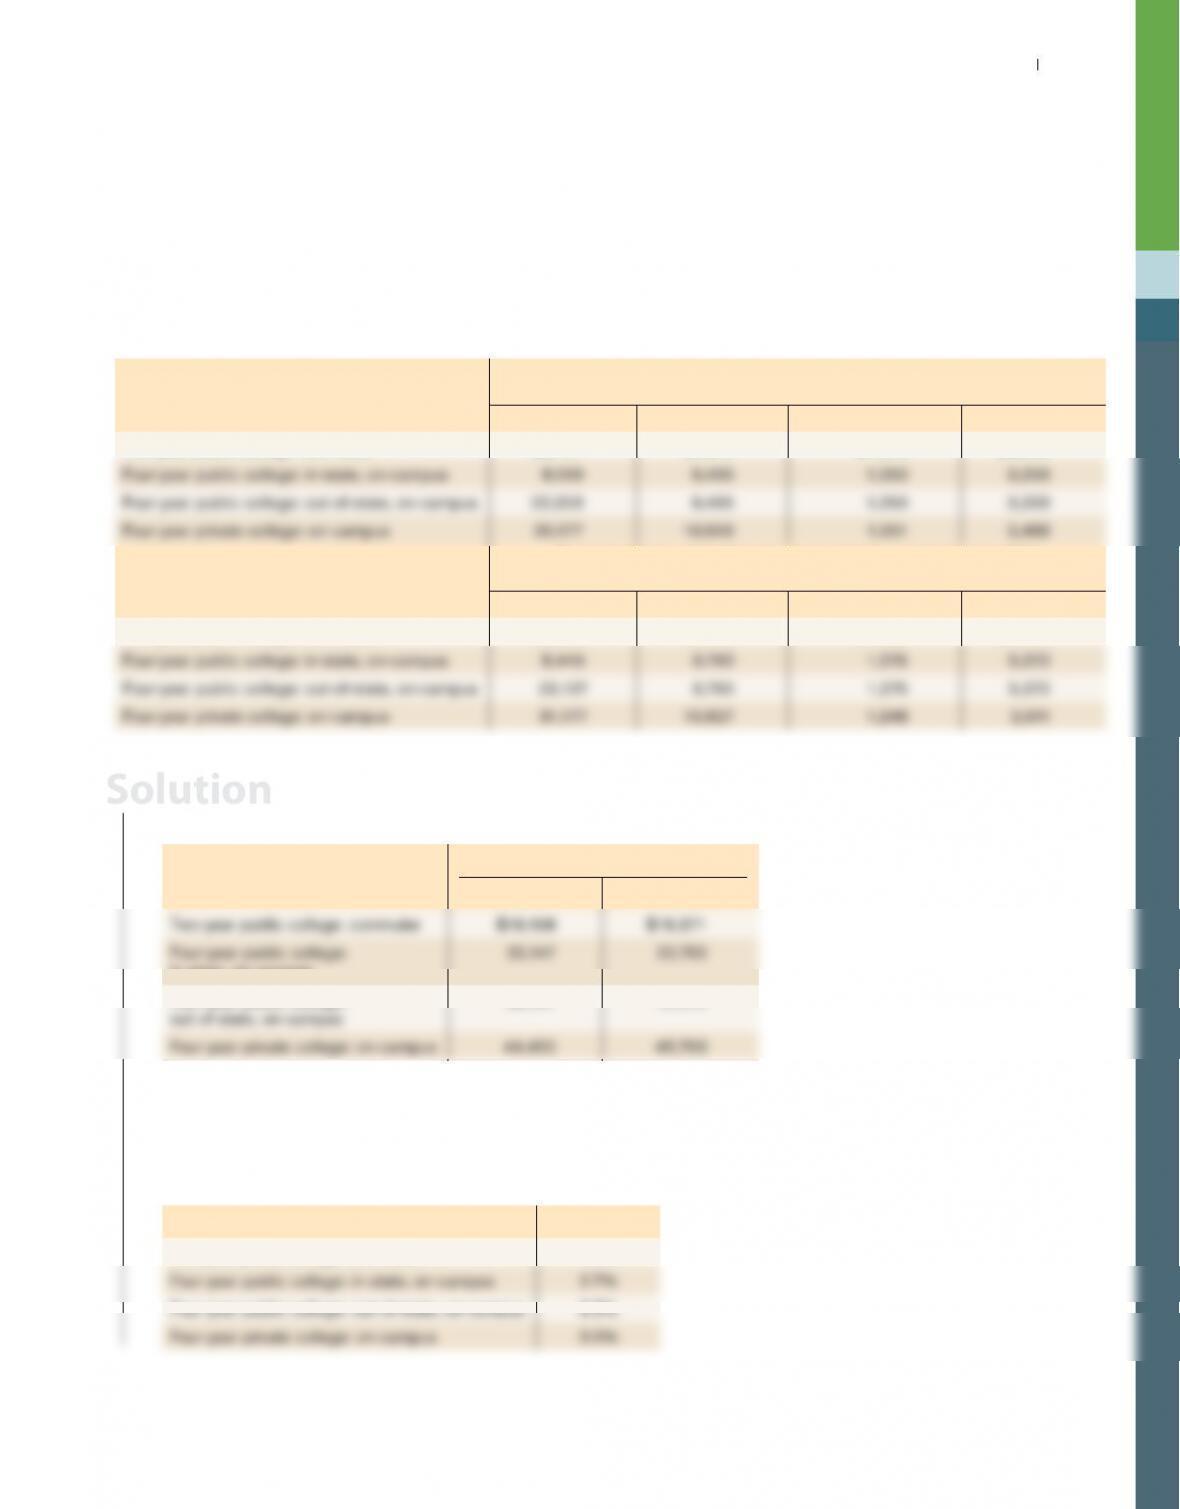
14. The cost of a college education in the United States is rising at a rate faster than
inflation. The following table shows the average cost of a college education in
the United States during the academic year that began in 2014 and the academic
year that began in 2015 for public and private colleges. Assume the costs listed
in the table are the only costs experienced by the various college students in a
single year.
a. Calculate the cost of living for an average college student in each category for
2014 and 2015.
b. Calculate an inflation rate for each type of college student between 2014 and
2015.
Cost of college education during academic year beginning 2014
(averages in 2014 dollars)
Tuition and fees Room and board Books and supplies Other expenses
Two-year public college: commuter $3,161 $7,810 $1,378 $3,809
Cost of college education during academic year beginning 2015
(averages in 2015 dollars)
Tuition and fees Room and board Books and supplies Other expenses
Two-year public college: commuter $3,270 $7,918 $1,422 $3,761
14. a. To calculate the cost of living, we add all the costs in each category. The cost
of living for each type of student is calculated in the accompanying table.
Average cost of attendance in dollars
2014 2015
in-state, on-campus
Four-year public college:
36,151 37,414
b. The inflation rate for each type of student is calculated as follows: ((price
index in 2015 − price index in 2014)/(price index in 2014)) × 100. Because each
type of student consumes the same goods and services in 2014 and 2015, the
cost of living can be used as a price index. Using the formula, the inflation
rates are calculated in the following table.
Inflation rate
Two-year public college: commuter 1.3%
Solution
S-110 Chapter 7 GDP anD the CPI: traCkInG the MaCroeConoMy
Solution
WORK IT OUT Interactive step-by-step help with solving this
problem can be found online.
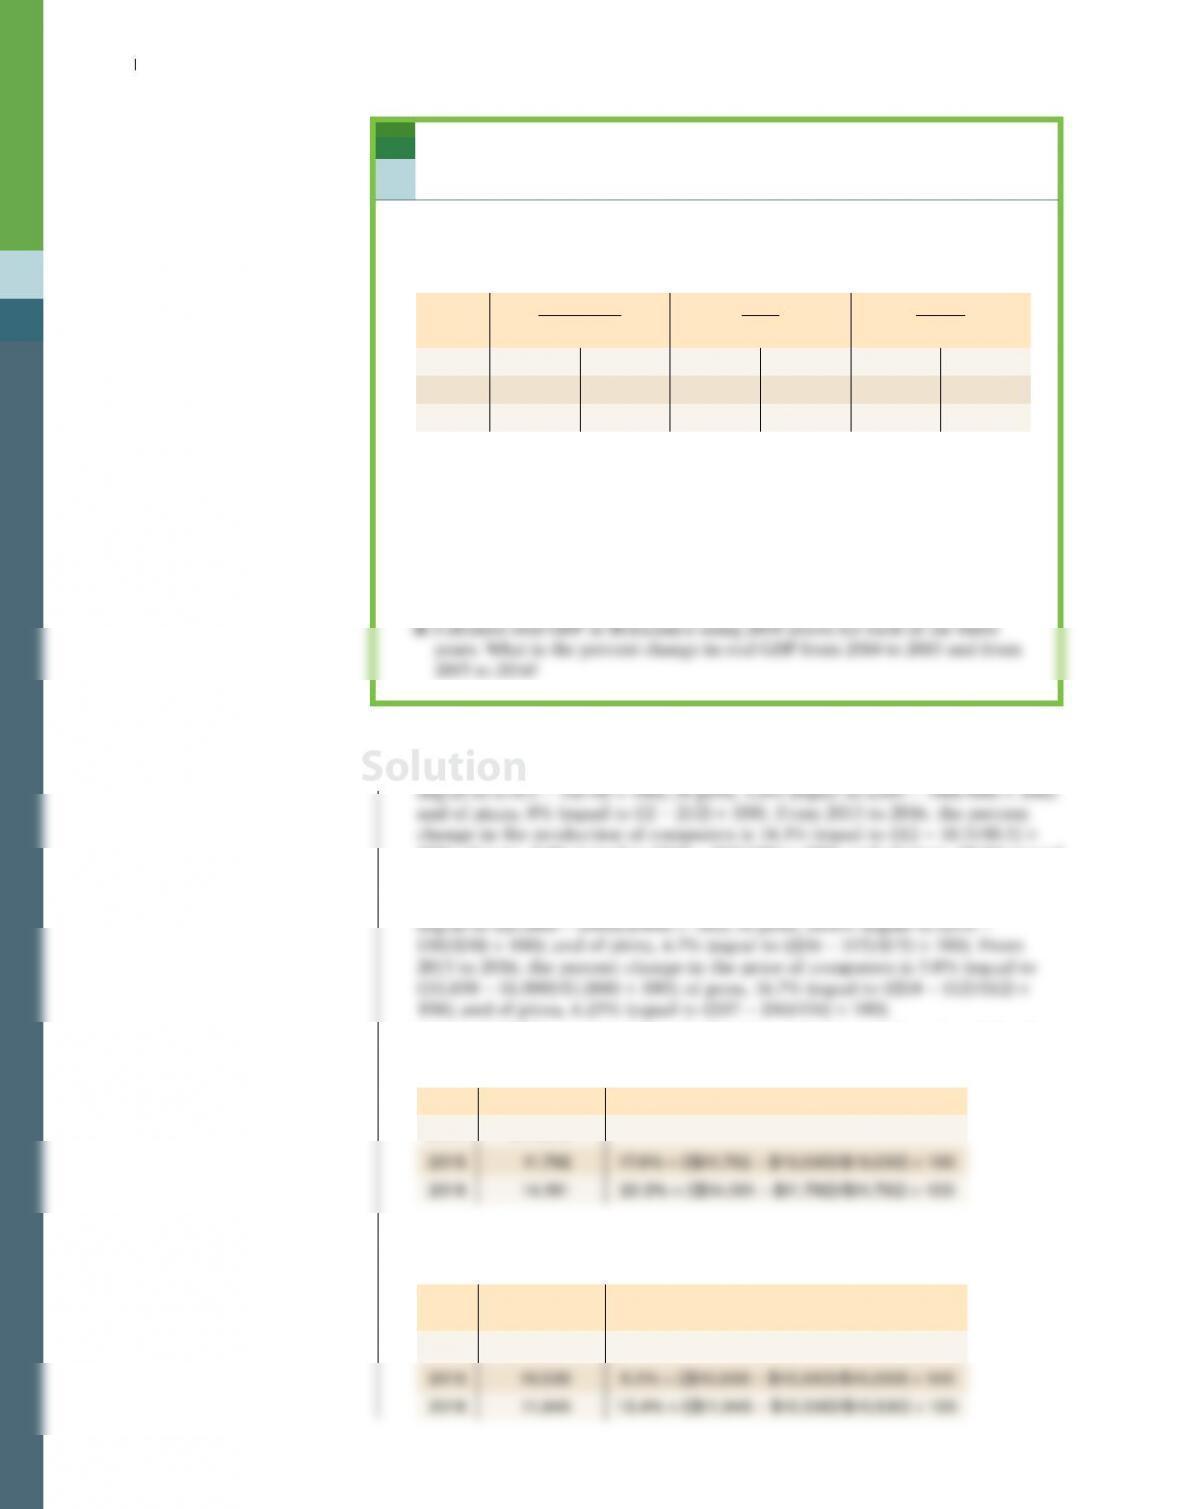
15. The economy of Britannica produces three goods: computers, pens, and
pizza. The accompanying table shows the prices and output of the three
goods for the years 2014, 2015, and 2016.
Computers Pens Pizzas
Year Price Quantity Price Quantity Price Quantity
2014 $900 10 $10 100 $15 2
2015 1,000 10.5 12 105 16 2
2016 1,050 12 14 110 17 3
a. What is the percent change in production of each of the goods from 2014
to 2015 and from 2015 to 2016?
b. What is the percent change in prices of each of the goods from 2014 to
2015 and from 2015 to 2016?
c. Calculate nominal GDP in Britannica for each of the three years. What is
the percent change in nominal GDP from 2014 to 2015 and from 2015 to
2016?
15. a. From 2014 to 2015, the percent change in the production of computers is 5.0%
100); of pens, 4.8% (equal to ((110 − 105)/105) × 100); and of pizza, 50.0% (equal
to ((3 − 2)/2) × 100).
b. From 2014 to 2015, the percent change in the price of computers is 11.1%
c. Nominal GDP for each year is calculated by summing up the value of the three
goods produced in that year:
Year Nominal GDP Percent change in nominal GDP
2014 $10,030
d. Real GDP in 2014 prices is calculated by summing up the value of the three
goods produced each year using 2014 prices:
Year
Real GDP
(2014 dollars) Percent change in real GDP
2014 $10,030