Chapter 7
Measuring Productivity
Note: Special icons in the margin identify problems requiring a computer or calculator .
◼ Solutions to Problems
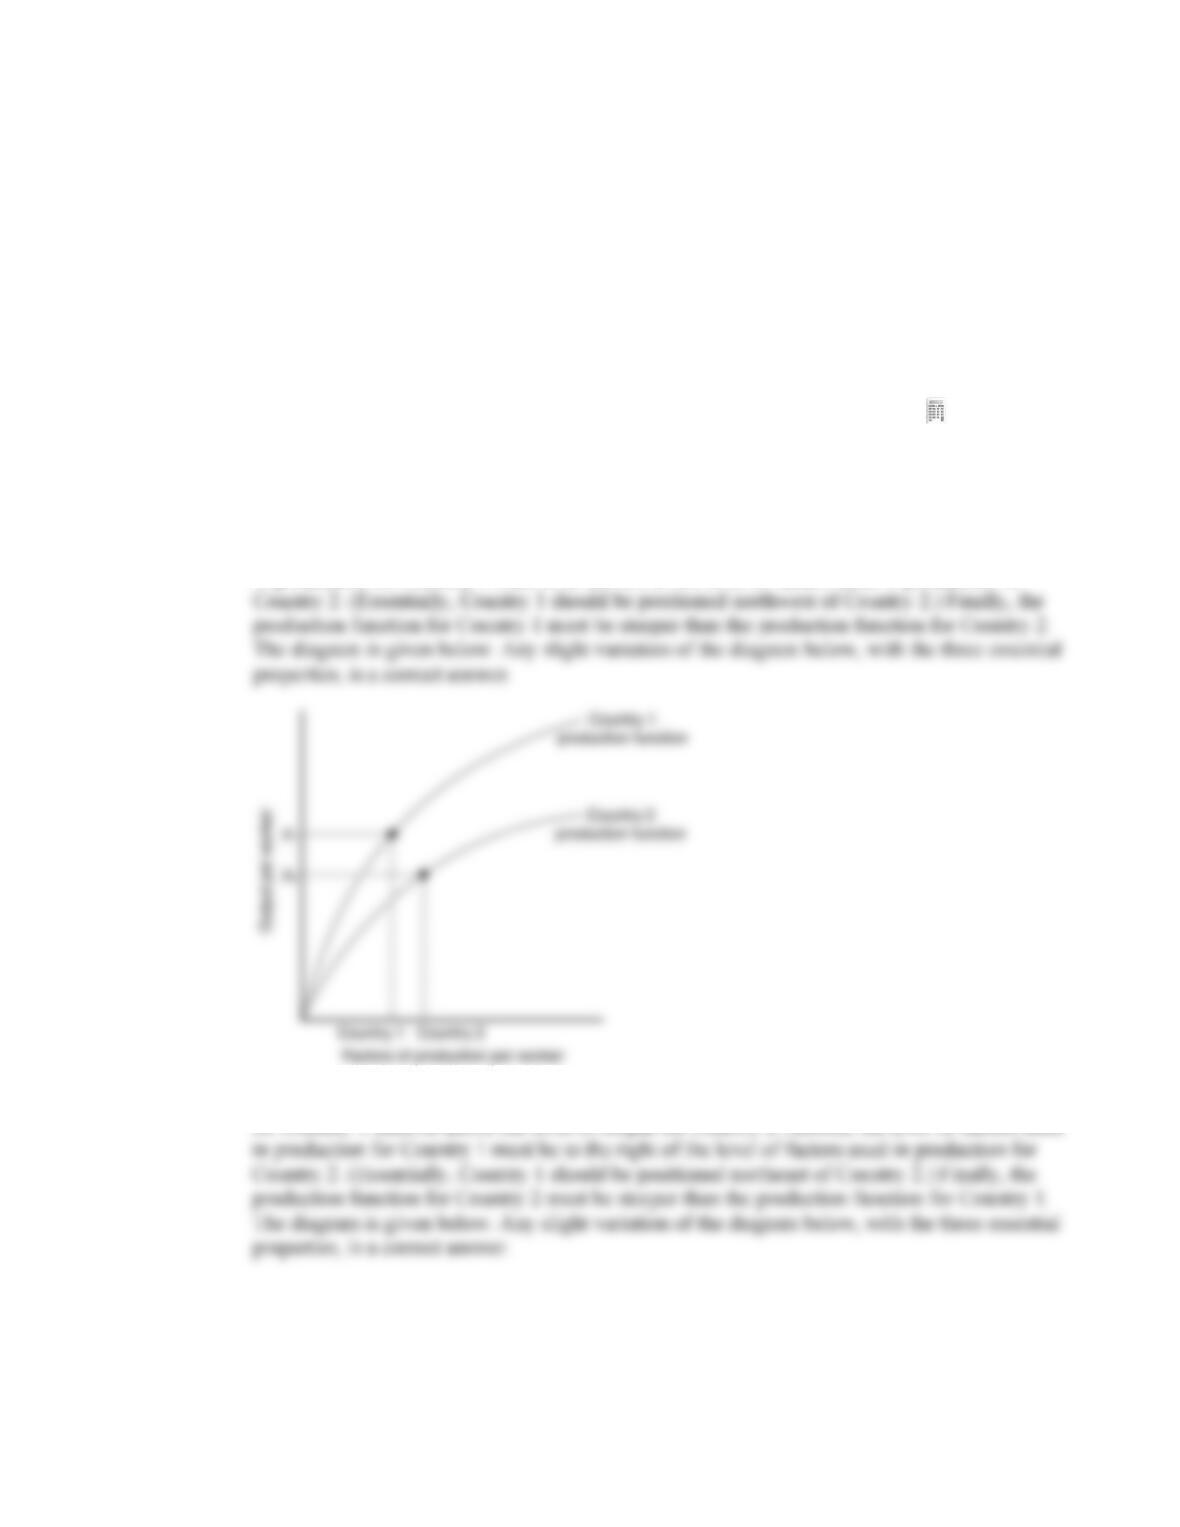
1. a. There are three essential components to answering this question. First, the level of output for
Country 1 must be above the level of output for Country 2. Second, the level of factors used
in production for Country 1 must be to the left of the level of factors used in production for
b. Again, there are three essential components to answering this question. First, the level of output
for Country 1 must be above the level of output for Country 2. Second, the level of factors used
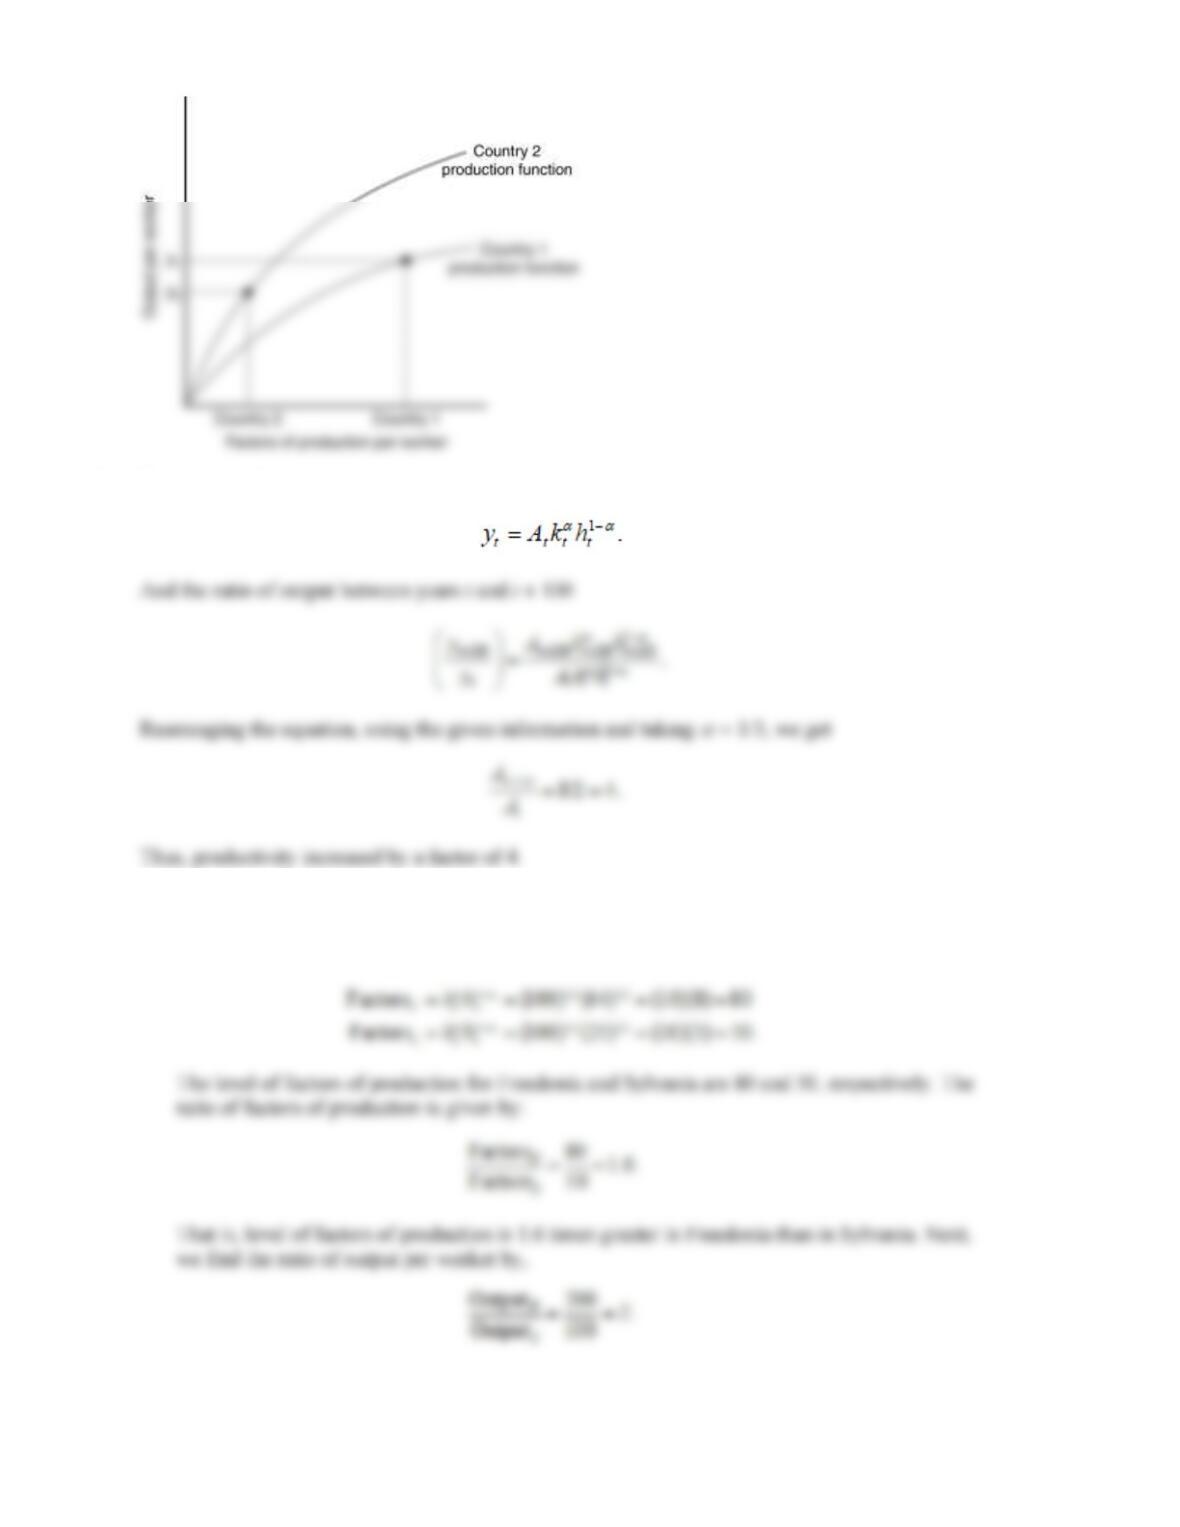
2. The equation for output at year t:
3. a. In order to calculate the relative levels of productivity in Freedonia and Sylvania, we must
first find the levels of factor accumulation for each country. Denoting a subscript F for
Freedonia, a subscript S for Sylvania, and substituting in the appropriate values, we get:
Chapter 7 Measuring Productivity 29
The level of output per worker in Freedonia is twice as large as that in Sylvania. This allows us to
use the following equation:
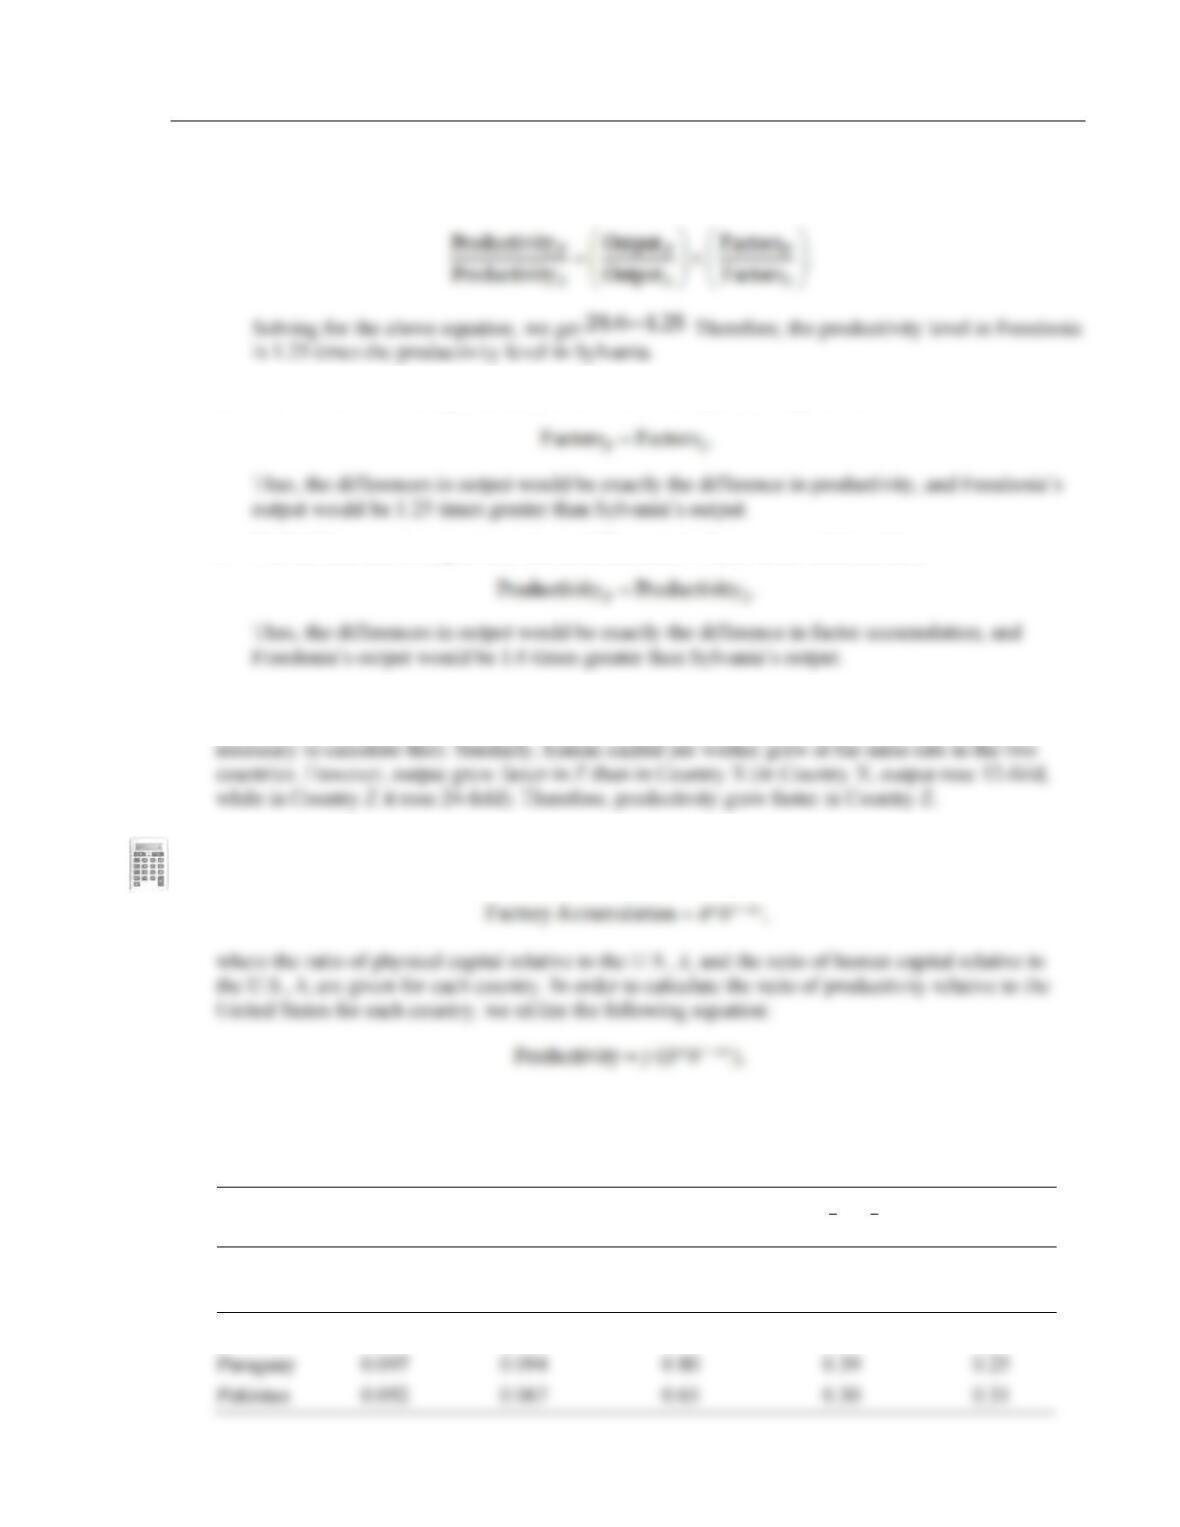
b. If all differences in output were due to differences in productivity, then,
c. If all differences in output were due to differences in factor accumulation, then,
4. Physical capital per worker grew at the same rate in the two countries. This is clear because it rose
27-fold over this period (this corresponds to an annual growth rate of 8.6% per year, but it was not
5. We assume
= 1/3. Then, in order to calculate the ratio of factor accumulation relative to the
United States for each country, we utilize the following equation:
where the denominator is simply the previous ratio of factor accumulation and y is the ratio of output
per worker relative to the United States for each country. The results of each of these calculations for
each country are listed in fourth and fifth columns of the table below.
y
k
h
12
33
kh
A
Country
Output per
Worker
Physical Capital
per Worker
Human Capital
per Worker
Factor
Accumulation
Productivity
Netherlands
0.87
0.81
0.94
0.89
0.98
30 Weil • Economic Growth, Second Edition
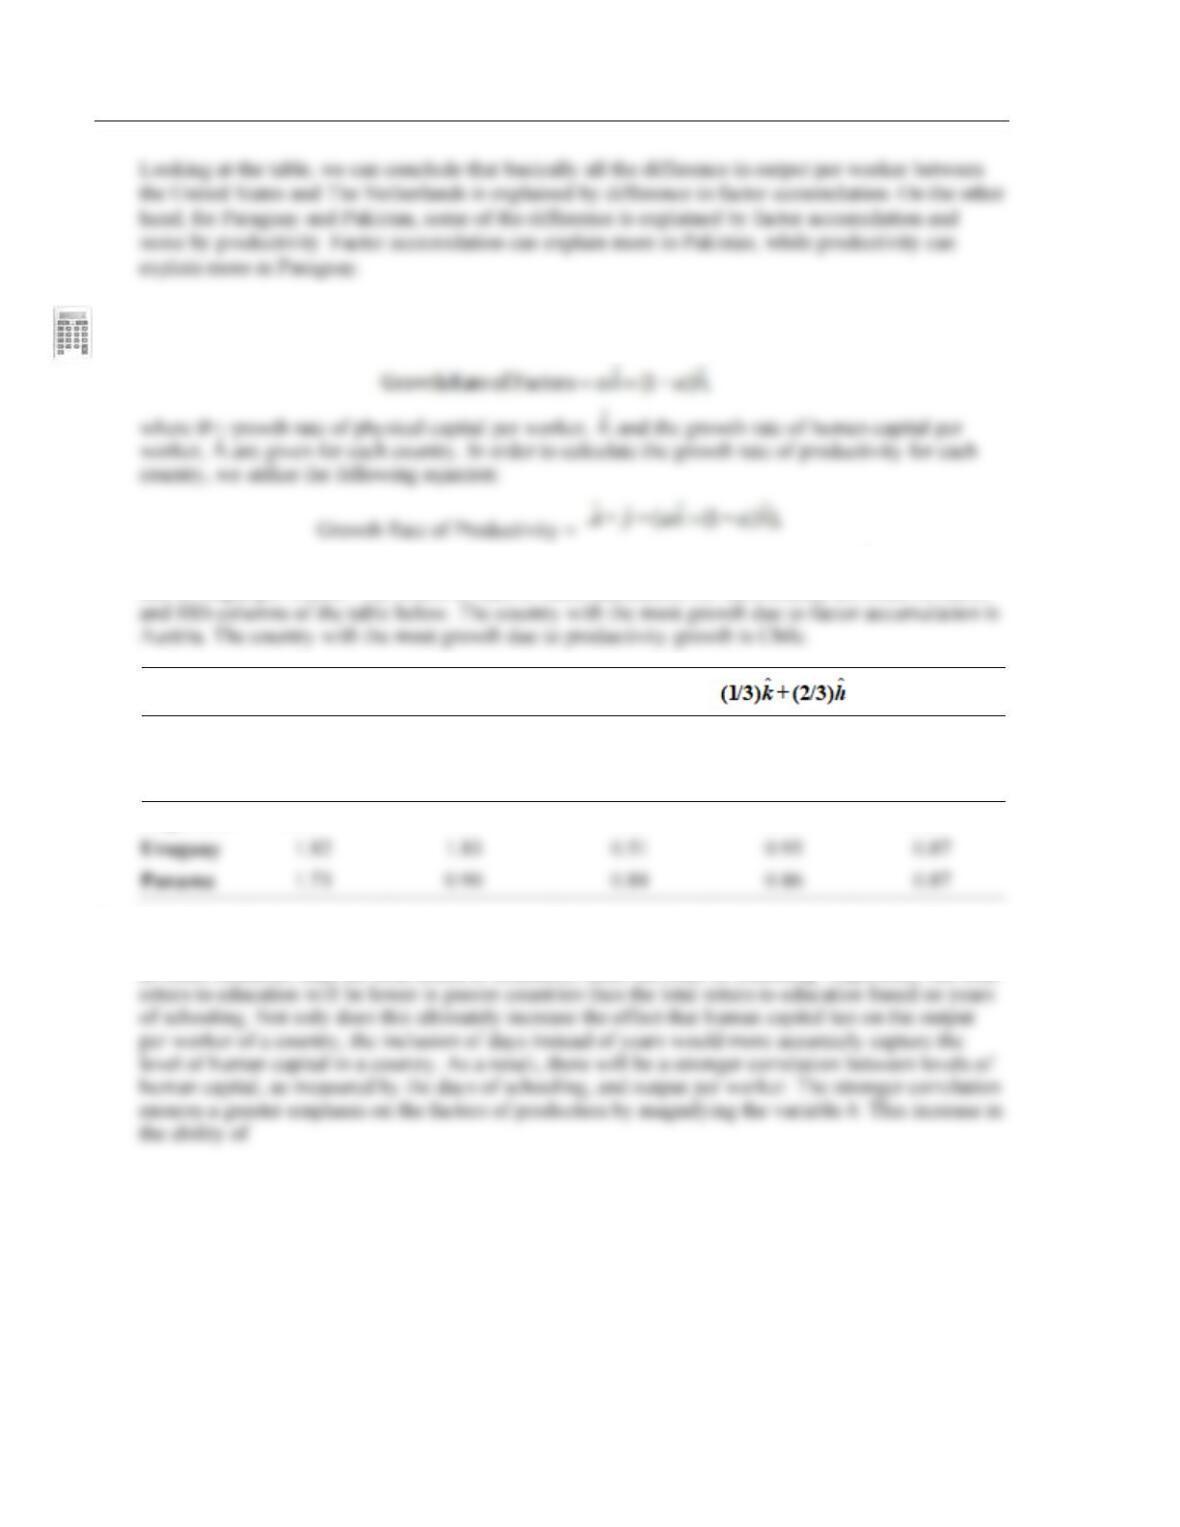
6. We assume
= 1/3. Then, in order to calculate the growth rate of factors for each country, we utilize
the following equation:
where the second term is simply the previous growth rate of factor accumulation and
ˆ
y
is the growth
rate of output per worker. The results of each of these calculations for each country are listed in fourth
ˆ(%)y
ˆ(%)k
ˆ(%)h
ˆ(%)A
Country
Growth Rate
of Output per
Worker
Growth Rate of
Physical Capital
per Worker
Growth Rate of
Human Capital
per Worker
Growth Rate
of Factors
Growth Rate of
Productivity
Argentina
0.66
0.31
0.52
0.45
Panama
0.90
0.84
0.86
0.87
7. The effect of using data on school days increases the level of education for richer countries and lessens
the level of education for poorer countries. This implies that the total return to education will be higher
in richer countries than the total return to education based on years of schooling. Oppositely, the total