
Questions for Review
1. In the Solow growth model, a high saving rate leads to a large steady-state capital
stock and a high level of steady-state output. A low saving rate leads to a small steady-
2. It is reasonable to assume that the objective of an economic policymaker is to maximize
the economic well-being of the individual members of society. Since economic well-being
depends on the amount of consumption, the policymaker should choose the steady state
3. When the economy begins above the Golden Rule level of capital, reaching the Golden
Rule level leads to higher consumption at all points in time. Therefore, the policymaker
would always want to choose the Golden Rule level, because consumption is increased
for all periods of time. On the other hand, when the economy begins below the Golden
CHAPTER 7Economic Growth I
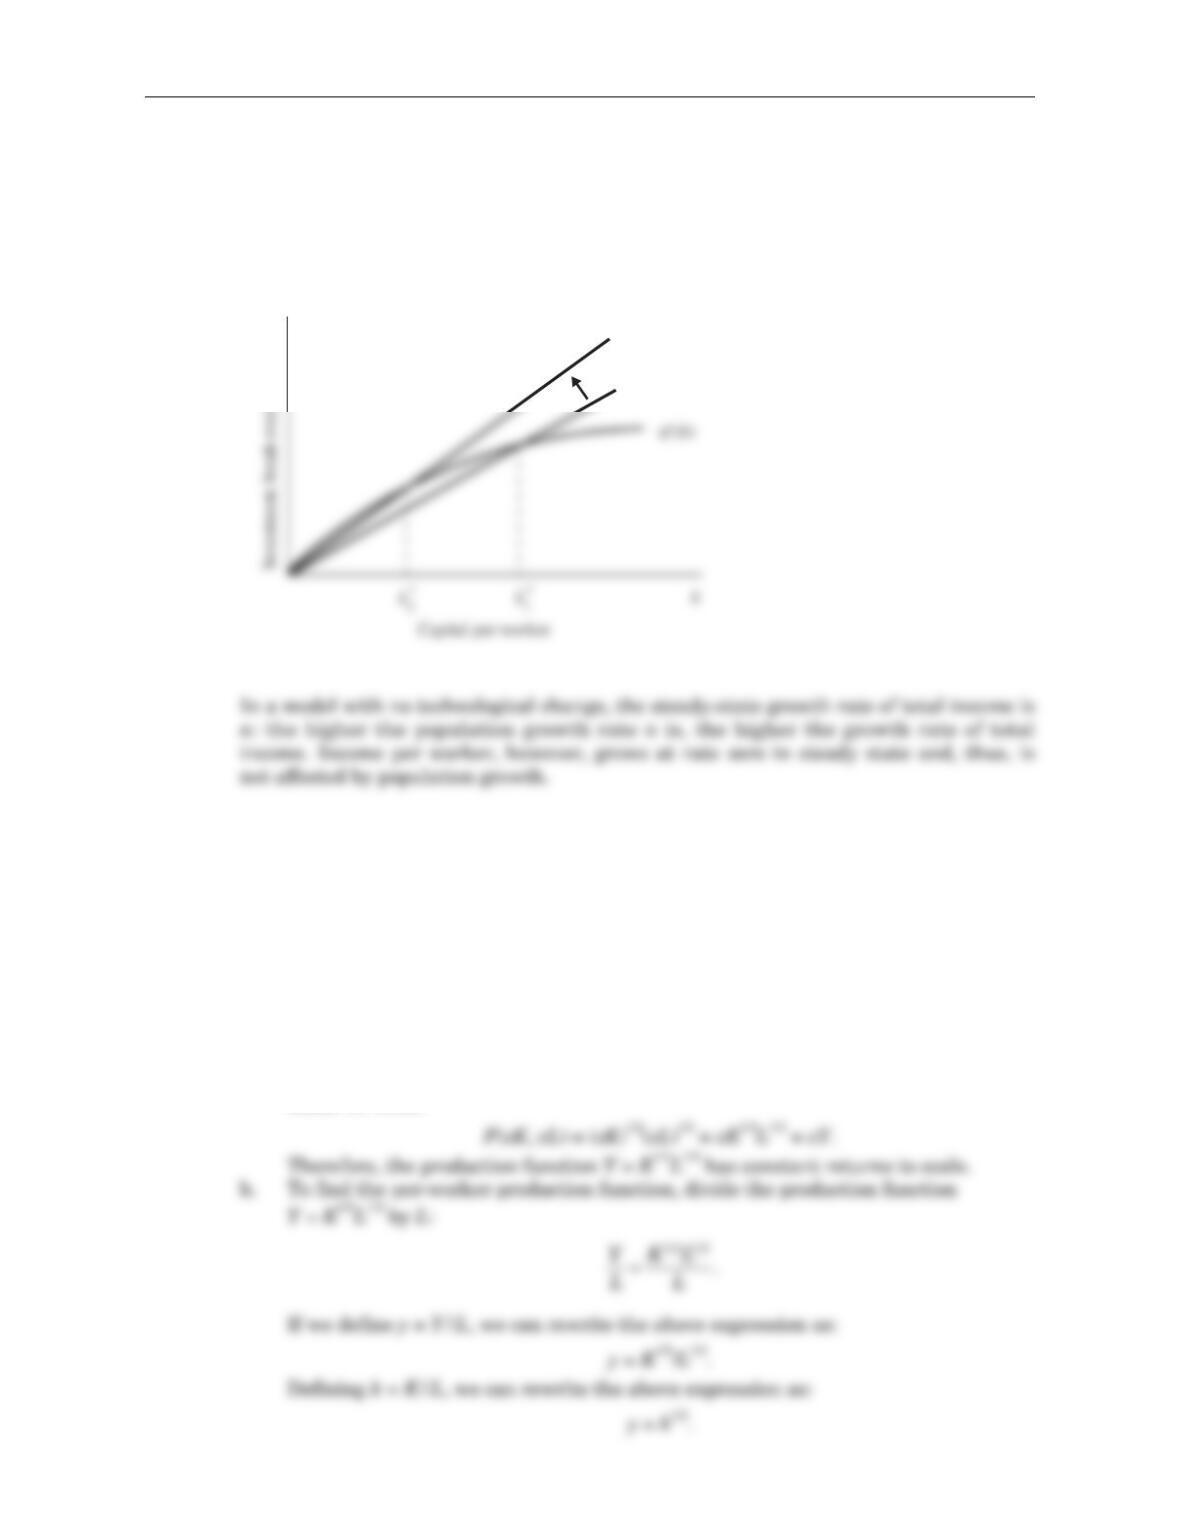
4. The higher the population growth rate is, the lower the steady-state level of capital per
worker, and therefore there is a lower level of steady-state income per worker. For
example, Figure 7–1 shows the steady state for two levels of population growth, a low
level n1and a higher level n2. The higher population growth n2means that the line rep-
resenting population growth and depreciation is higher, so the steady-state level of cap-
ital per worker is lower.
Problems and Applications
1. a. A production function has constant returns to scale if increasing all factors of pro-
duction by an equal percentage causes output to increase by the same percentage.
Mathematically, a production function has constant returns to scale if zY = F(zK,
zL) for any positive number z. That is, if we multiply both the amount of capital
and the amount of labor by some amount z, then the amount of output is multi-
plied by z. For example, if we double the amounts of capital and labor we use (set-
ting z= 2), then output also doubles.
To see if the production function Y= F(K, L) = K1/2L1/2 has constant returns to
scale, we write:
58 Answers to Textbook Questions and Problems
(δ + n2)k
(δ + n1)k
Figure 7–1
c. We know the following facts about countries A and B:
δ= depreciation rate = 0.05,
sa= saving rate of country A = 0.1,
sb= saving rate of country B = 0.2, and
Rewriting this:
k1/2 = s/δ
k= (s/δ)2.
To find the steady-state level of capital per worker k*, plug the saving rate for
each country into the above formula:
Country A: k= (sa/δ)2= (0.1/0.05)2= 4.
Country B: k= (sb/δ)2= (0.2/0.05)2= 16.
d. Using the following facts and equations, we calculate income per worker y, con-
sumption per worker c, and capital per worker k:
sa= 0.1.
sb= 0.2.
Chapter 7 Economic Growth I 59
*
a
*
b
60 Answers to Textbook Questions and Problems
Country A
Year ky= k1/2 c= (1 – sa)yi= sayδkΔk= i– δk
1 2 1.414 1.273 0.141 0.100 0.041
Country B
Year ky= k1/2 c= (1 – sa)yi= sayδkΔk=i– δk
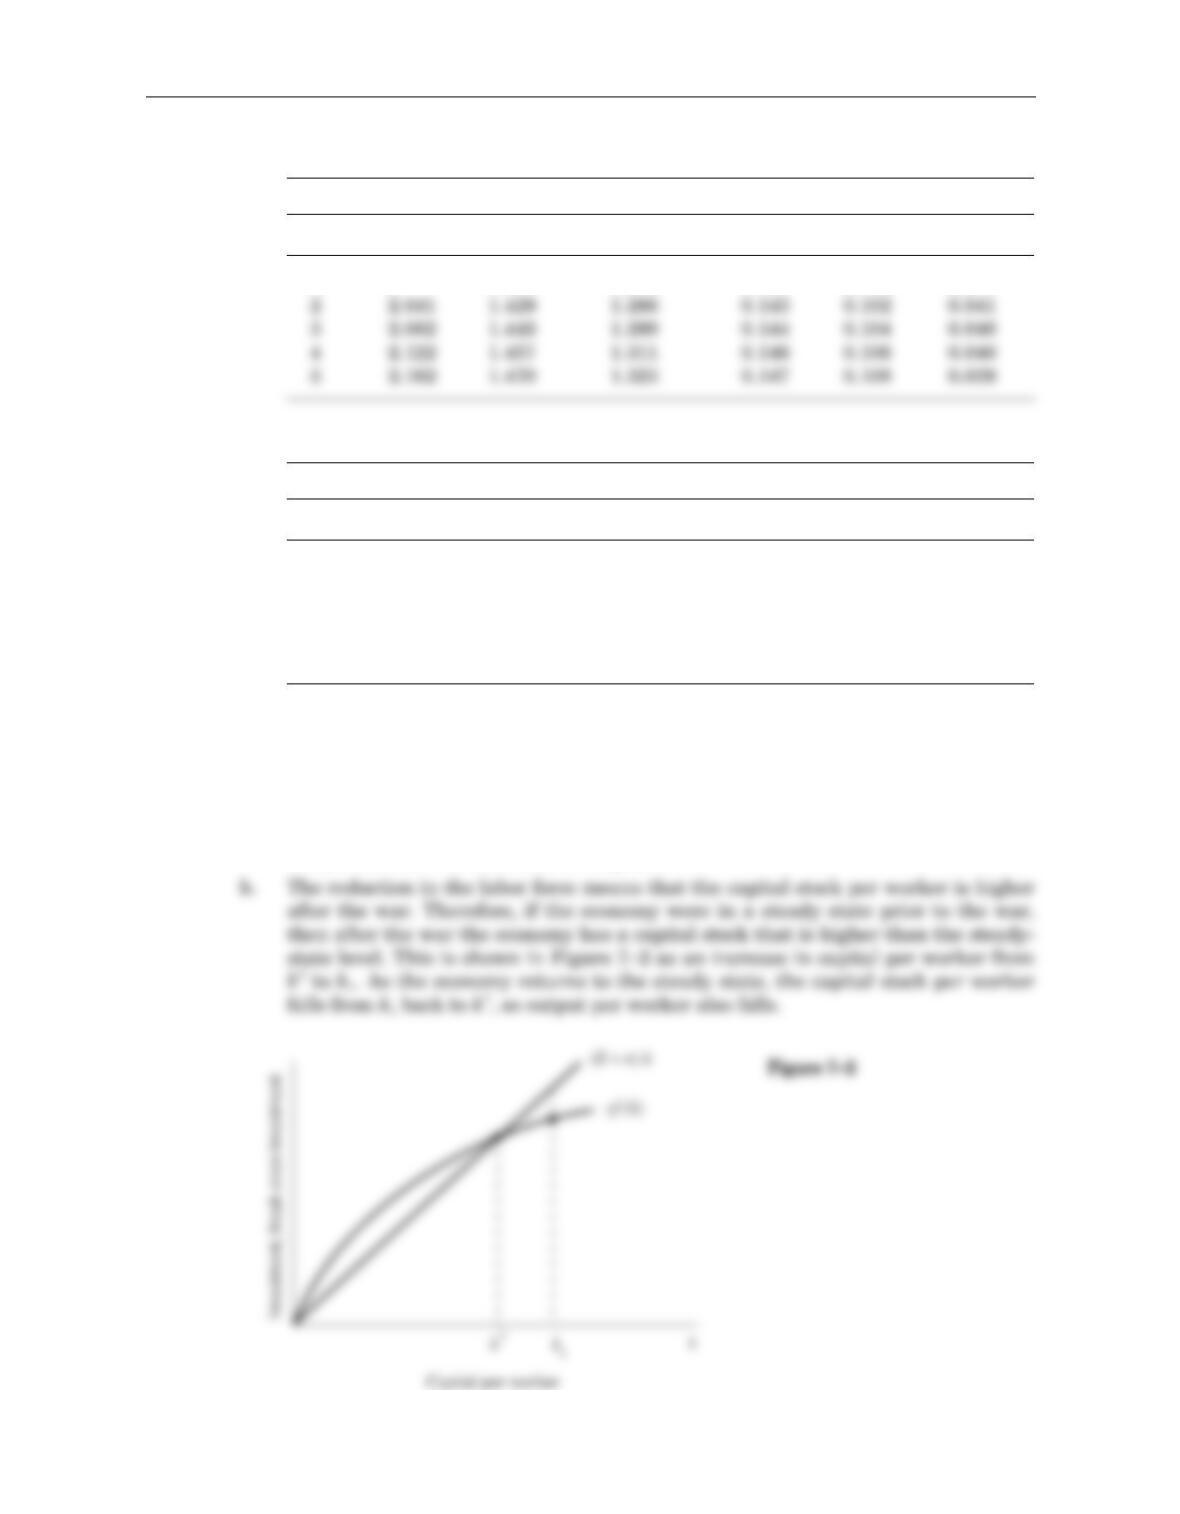
1 2 1.414 1.131 0.283 0.100 0.183
2 2.183 1.477 1.182 0.295 0.109 0.186
3 2.369 1.539 1.231 0.308 0.118 0.190
4 2.559 1.600 1.280 0.320 0.128 0.192
5 2.751 1.659 1.327 0.332 0.138 0.194
Note that it will take five years before consumption in country B is higher than
consumption in country A.
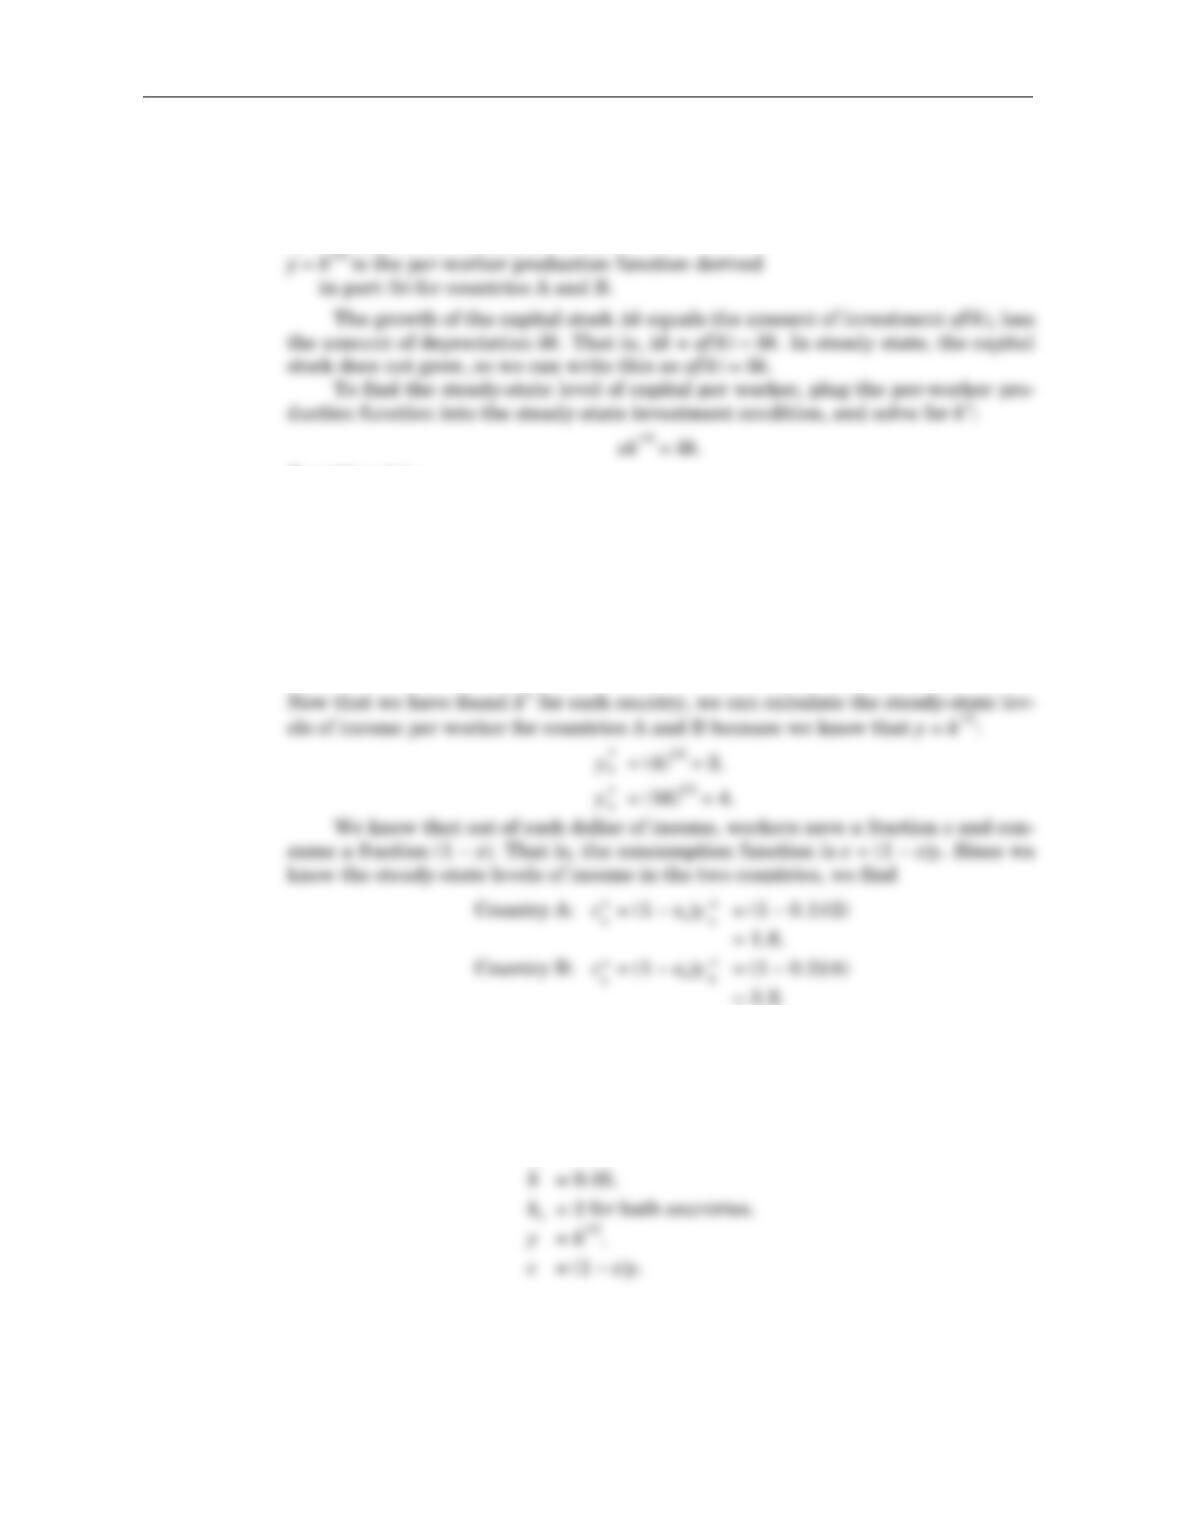
2. a. The production function in the Solow growth model is Y= F(K, L), or expressed
terms of output per worker, y= f(k). If a war reduces the labor force through casu-
alties, then Lfalls but k= K/L rises. The production function tells us that total
output falls because there are fewer workers. Output per worker increases, how-
ever, since each worker has more capital.
Hence, in the transition to the new steady state, the growth of output per
worker is slower than normal. In the steady state, we know that the growth rate
of output per worker is equal to zero, given there is no technological change in this
model. Therefore, in this case, the growth rate of output per worker must be less
than zero until the new steady state is reached.
b. Recall that
Δk = sf(k) – δk.
The steady-state value of capital per worker k*is defined as the value of k at
which capital per worker is constant, so Δk= 0. It follows that in steady state
0= sf(k) – δk,
or, equivalently,
For the production function in this problem, it follows that:
Chapter 7 Economic Growth I 61
k
fk
*
(*)
=s
δ.
(Note: An alternative approach to the problem is to note that consumption also
equals the amount of output that is not saved:
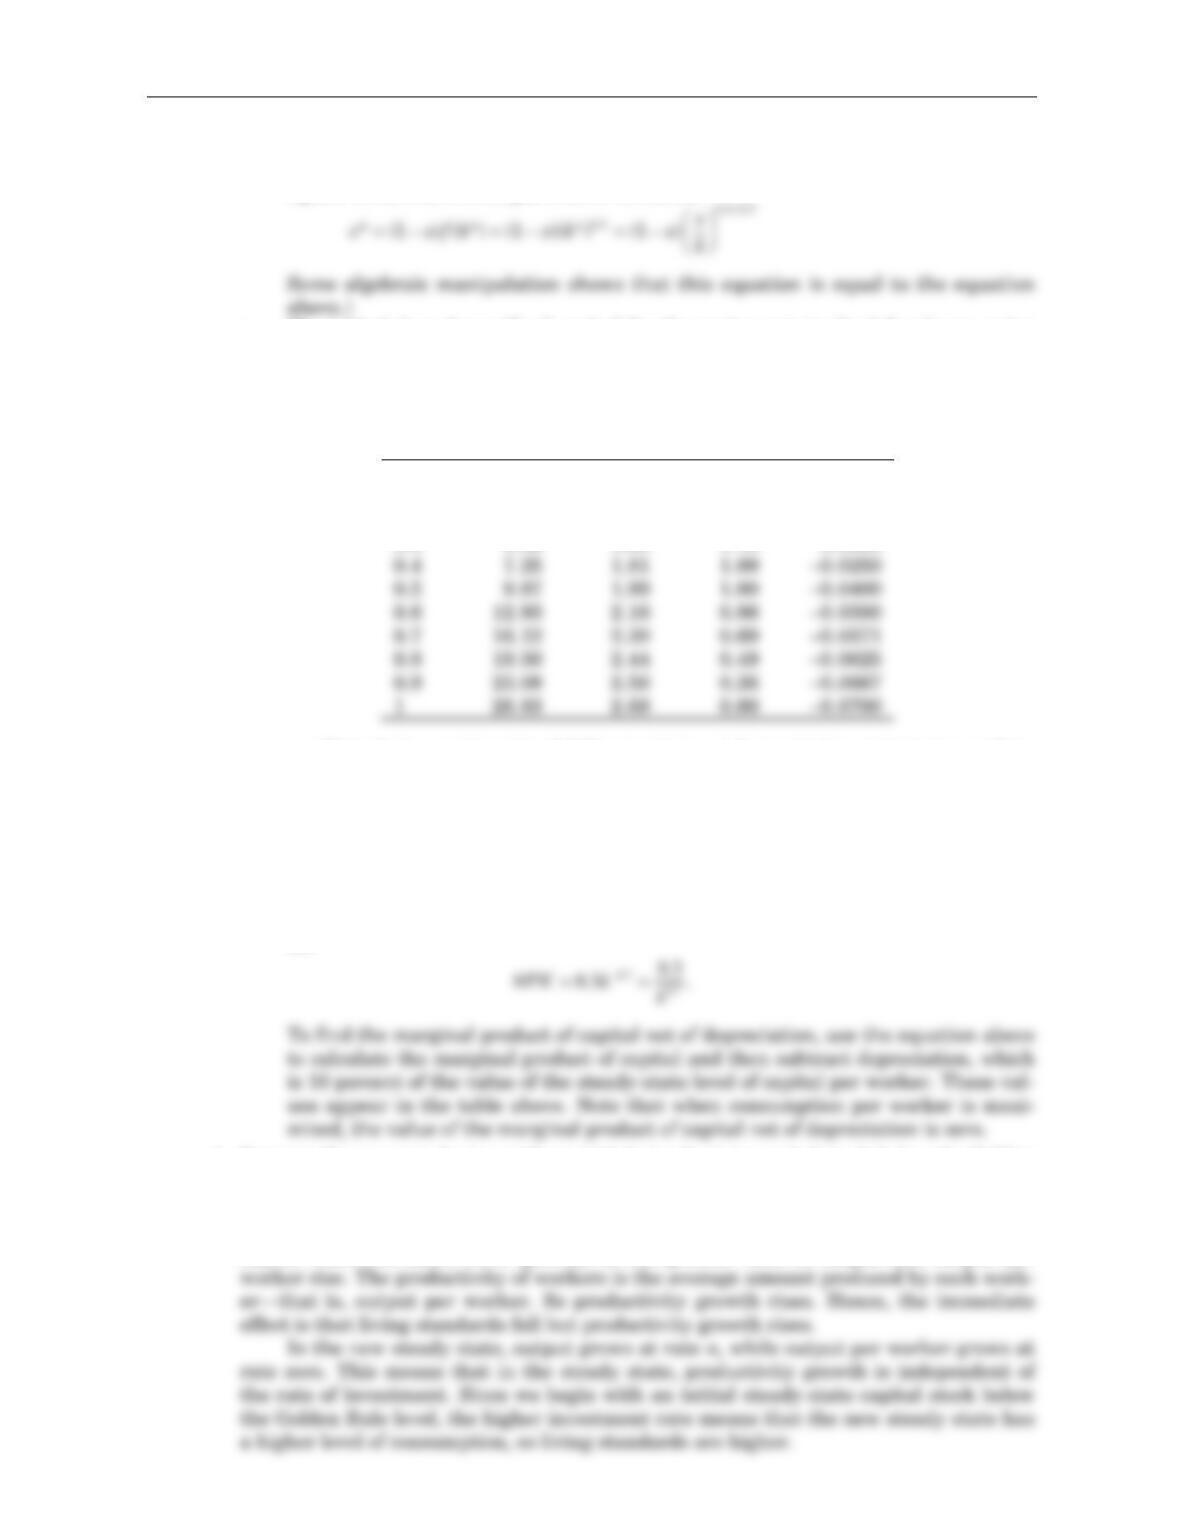
c. The table below shows k*, y*, and c*for the saving rate in the left column, using
the equations from part (b). We assume a depreciation rate of 10 percent (i.e.,
0.1). (The last column shows the marginal product of capital, derived in part (d)
below).
k*y*c*MPK-
δk
*
0 0.00 0.00 0.00
0.1 1.00 1.00 0.90 0.2000
0.2 2.69 1.35 1.08 0.0500
0.3 4.80 1.60 1.12 0.0000
Note that a saving rate of 100 percent (s = 1.0) maximizes output per worker.
In that case, of course, nothing is ever consumed, so c*=0. Consumption per work-
er is maximized at a rate of saving of 0.3 percent—that is, where sequals capital’s
share in output. This is the Golden Rule level of s.
d. The marginal product of capital (
MPK
) is the change in output per worker (
y
) for a
given change in capital per worker (
k
). To find the marginal product of capital, dif-
ferentiate the per-worker production function with respect to capital per worker
(
k
):
4. Suppose the economy begins with an initial steady-state capital stock below the Golden
Rule level. The immediate effect of devoting a larger share of national output to invest-
ment is that the economy devotes a smaller share to consumption; that is, “living stan-
dards” as measured by consumption fall. The higher investment rate means that the
capital stock increases more quickly, so the growth rates of output and output per
62 Answers to Textbook Questions and Problems
5. As in the text, let k= K/Lstand for capital per unit of labor. The equation for the evolu-
tion of kis
Δk= Saving – (δ+ n)k.
If all capital income is saved and if capital earns its marginal product, then saving
equals MPK ×k. We can substitute this into the above equation to find
Δk= MPK ×k– (δ+ n)k.
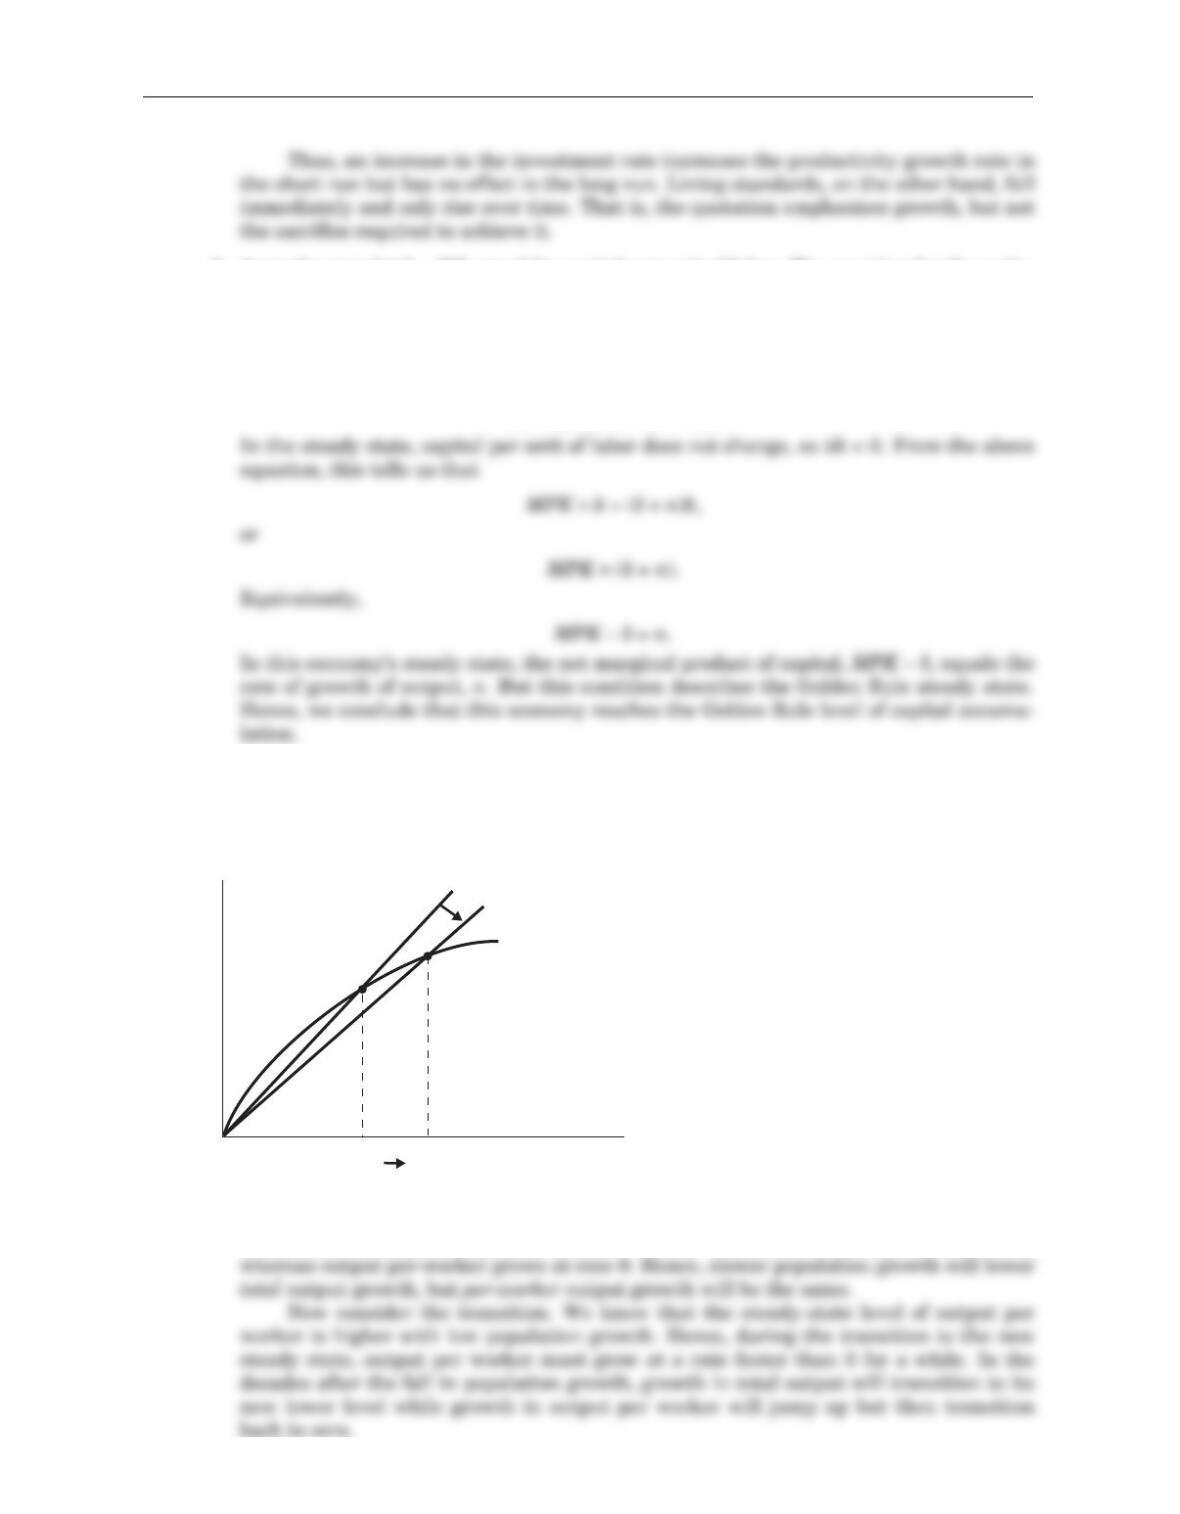
6. First, consider steady states. In Figure 7–3, the slower population growth rate shifts
the line representing population growth and depreciation downward. The new steady
state has a higher level of capital per worker, k, and hence a higher level of output per
worker.
What about steady-state growth rates? In steady state, total output grows at rate n,
Chapter 7 Economic Growth I 63
Capital per worker
Investment, break-even investment
k
(δ + n1)k
(δ + n2)k
sf (k)
k2
*
k1
*
*
2
Figure 7–3
7. If there are decreasing returns to labor and capital, then increasing both capital and
labor by the same proportion increases output by less than this proportion. For exam-
ple, if we double the amounts of capital and labor, then output less than doubles. This
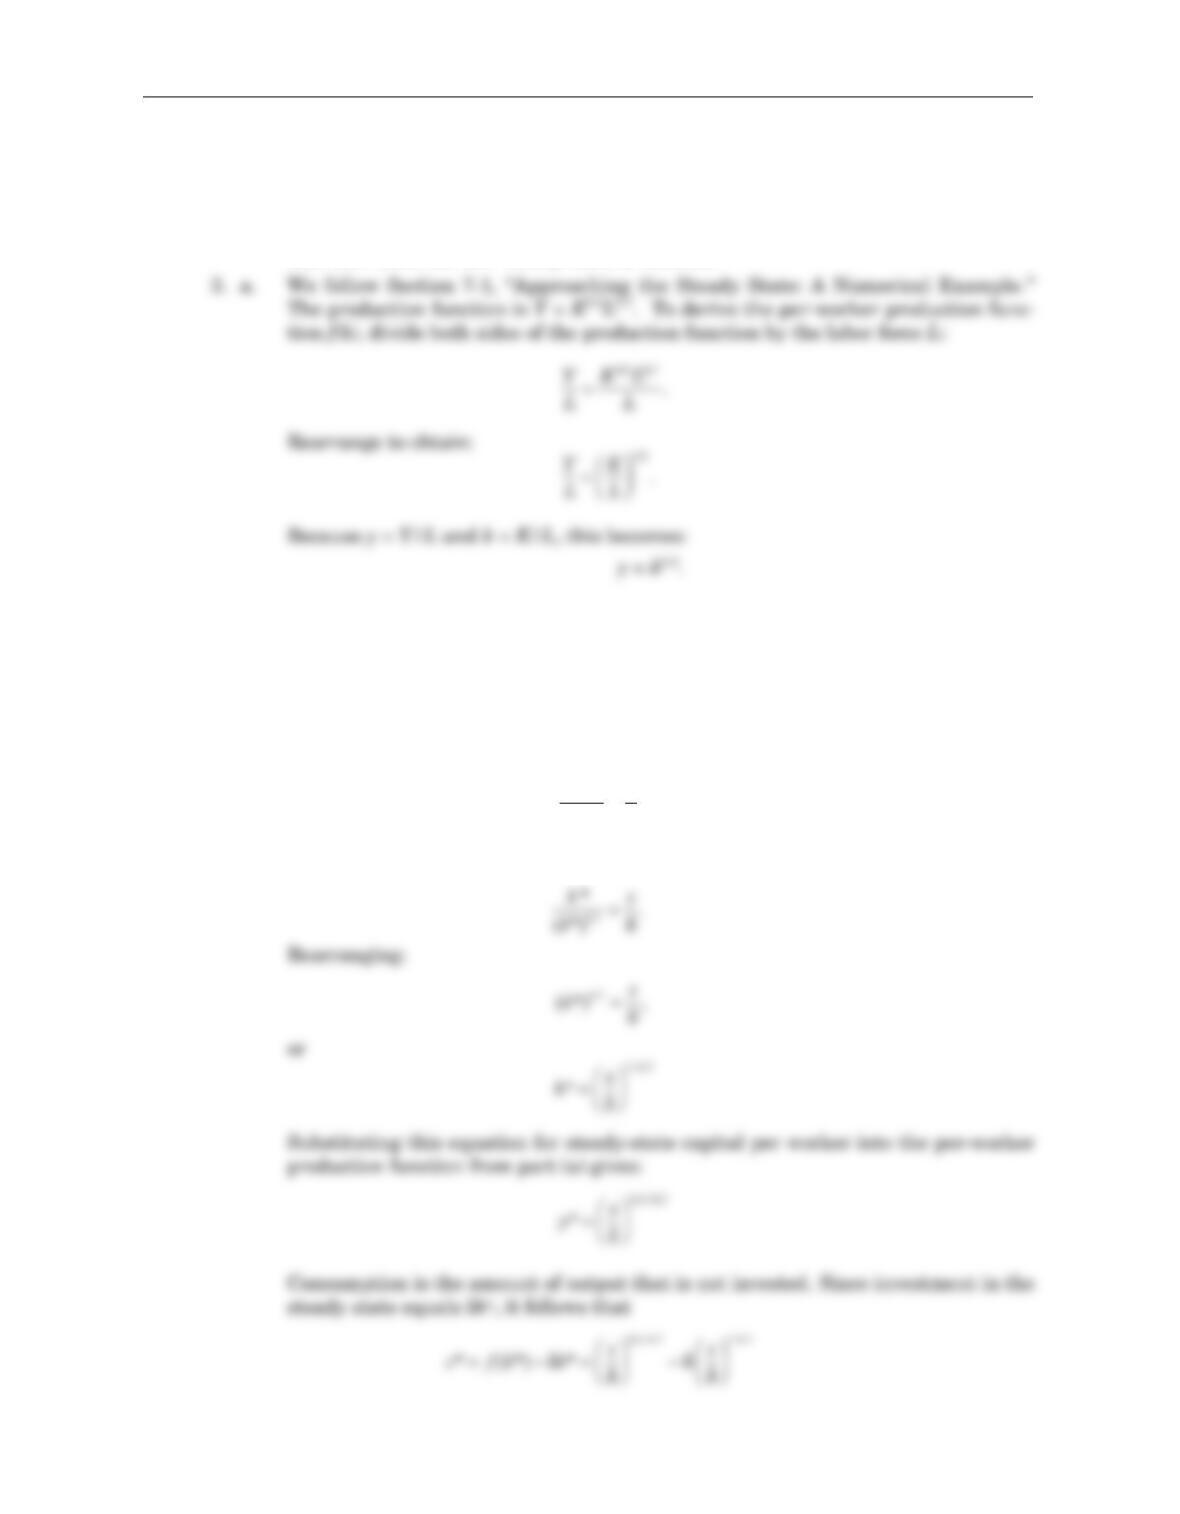
8. a. To find output per worker ywe divide total output by the number of workers:
64 Answers to Textbook Questions and Problems
sy n k=+()d
ku
s
n
*=-
()
+
Ê
Ë
Áˆ
¯
˜–
1
1
1
d
a
Y
L
KuL
L
=–
()
È
΢
˚–
aa
11
sk u n k
aad11
–
()
=+
()
–
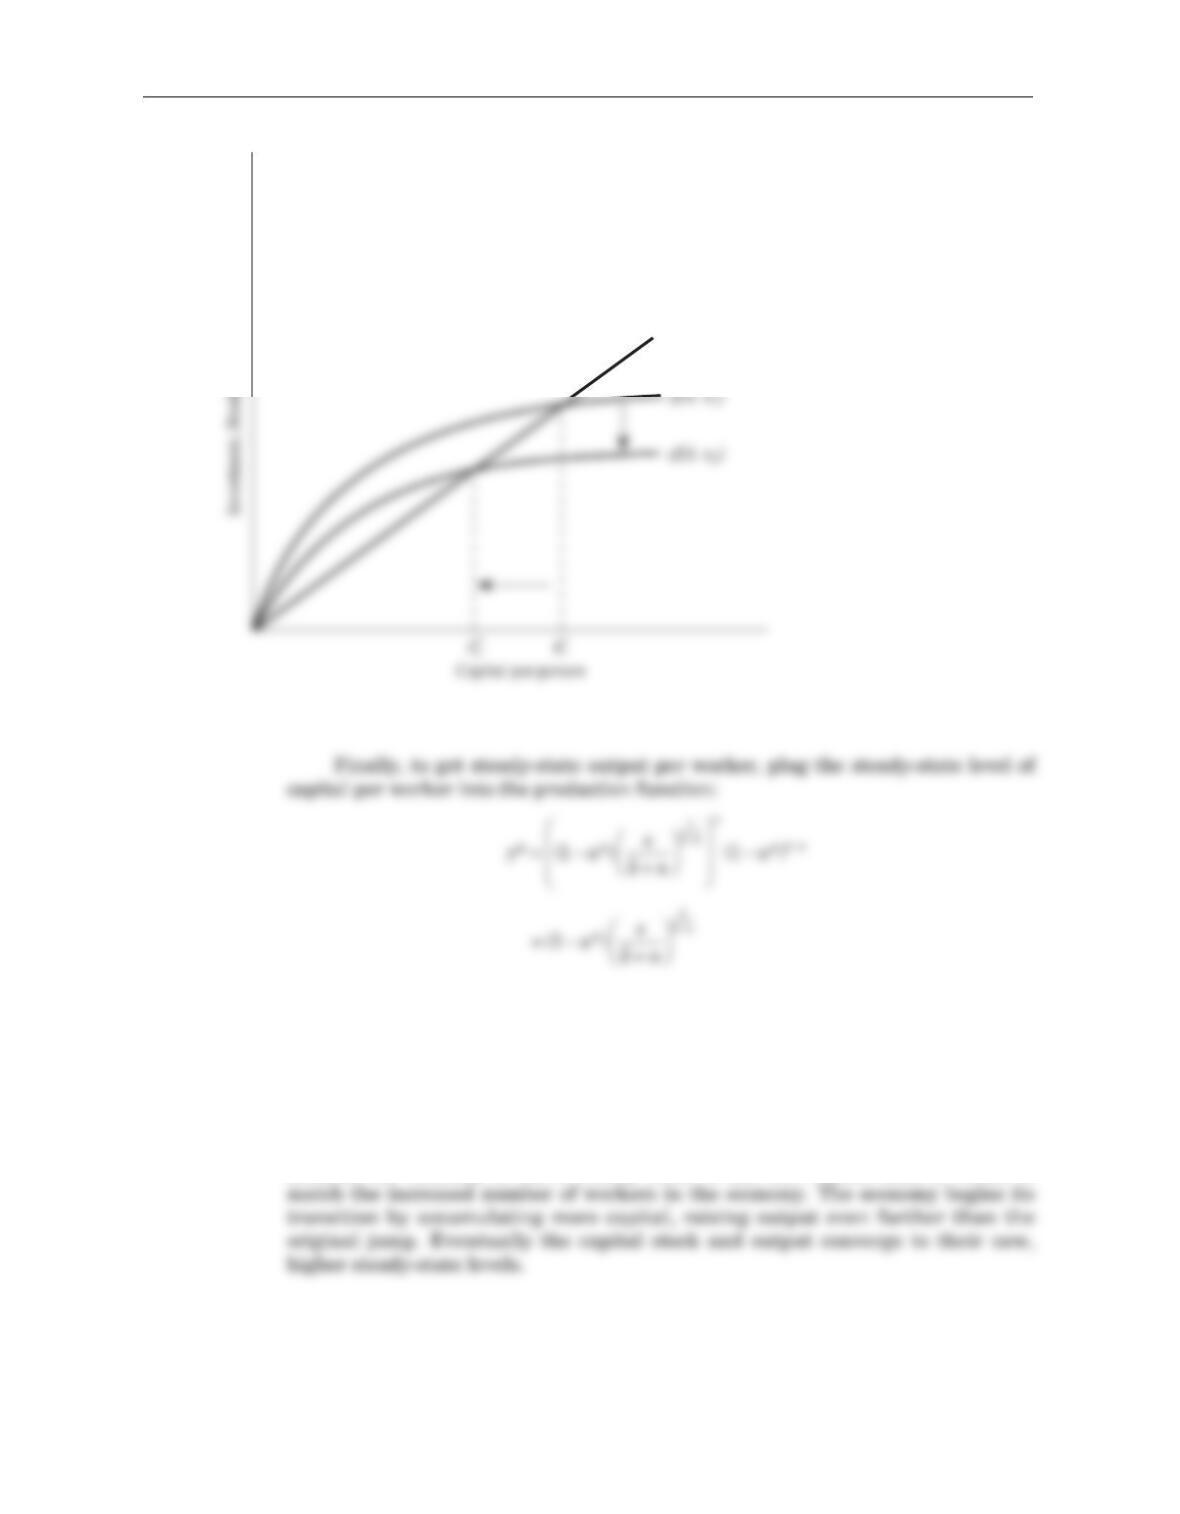
Unemployment lowers steady-state output for two reasons: for a given k, unem-
ployment lowers y, and unemployment also lowers the steady-state value k*.
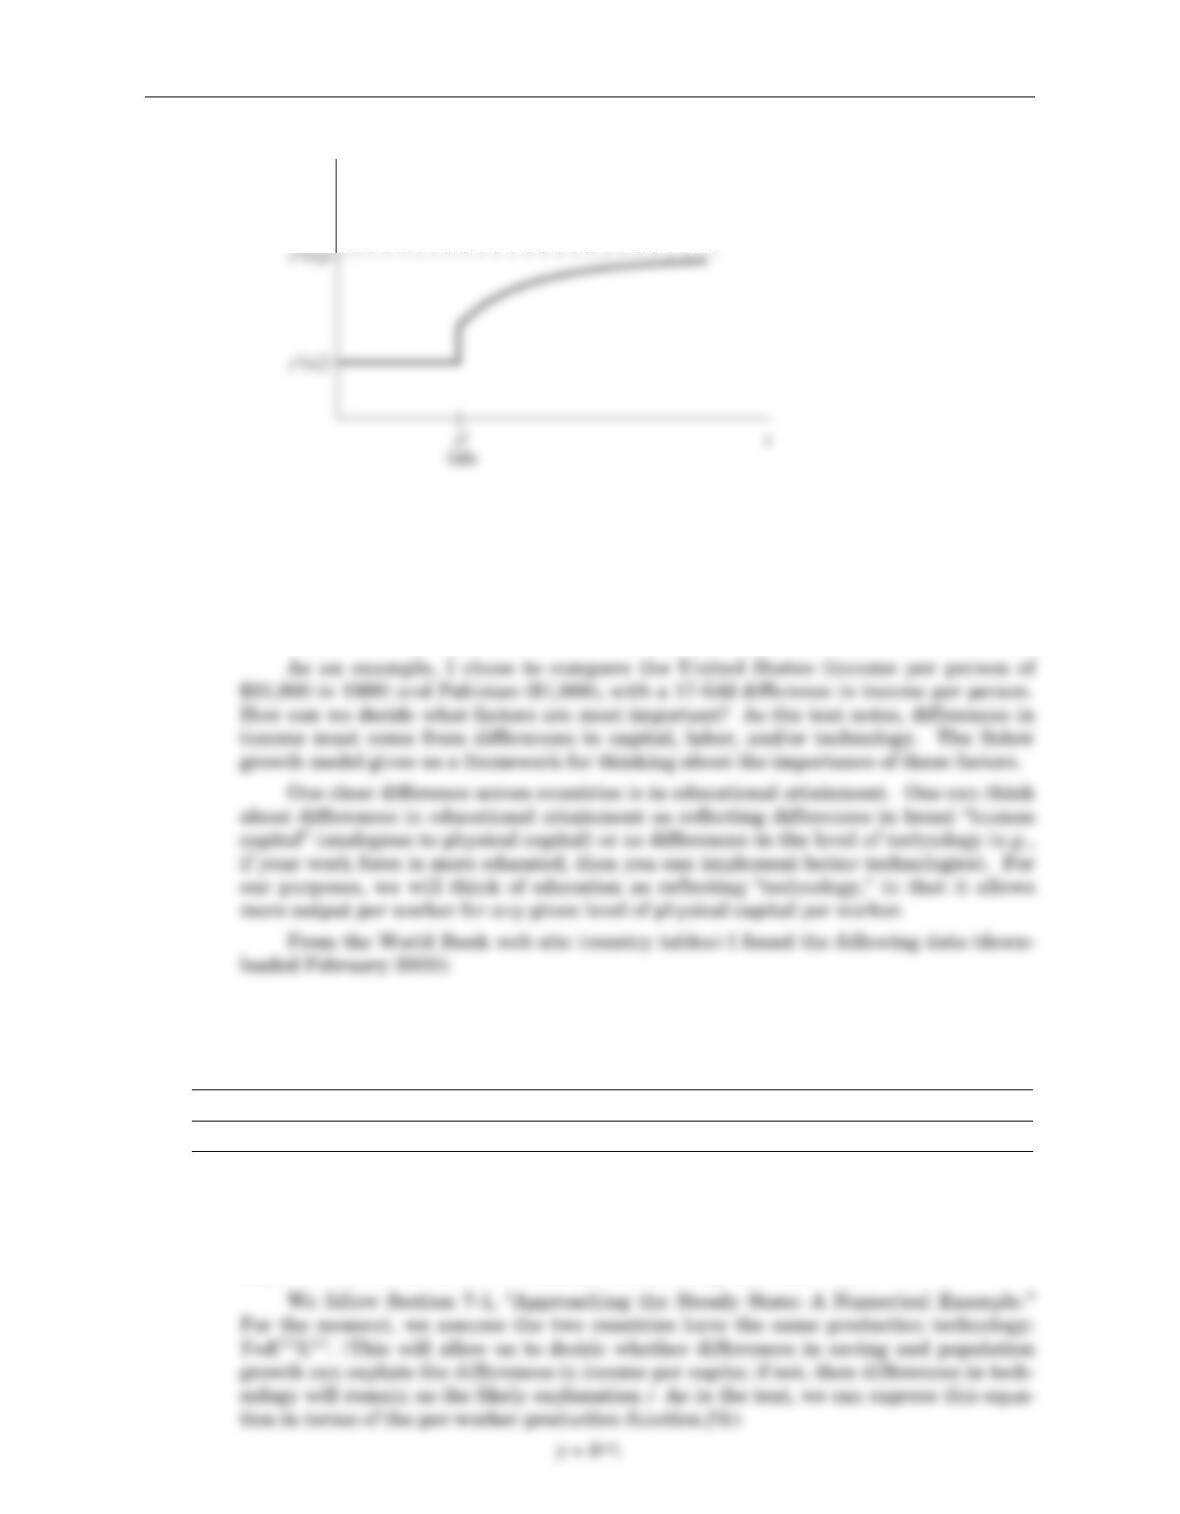
b. Figure 7–5 below shows the pattern of output over time. As soon as unemploy-
ment falls from u1to u2, output jumps up from its initial steady-state value of
y*(u1). The economy has the same amount of capital (since it takes time to adjust
the capital stock), but this capital is combined with more workers. At that
moment the economy is out of steady state: it has less capital than it wants to
Chapter 7 Economic Growth I 65
(δ + n)k
Figure 7–4
9. There is no unique way to find the data to answer this question. For example, from the
World Bank web site, I followed links to “Data and Statistics.” I then followed a link to
“Quick Reference Tables” (http://www.worldbank.org/data/databytopic/GNPPC.pdf) to
find a summary table of income per capita across countries. (Note that there are some
subtle issues in converting currency values across countries that are beyond the scope
of this book. The data in Table 7–1 use what are called “purchasing power parity.”)
Labor Force Investment/GDP Illiteracy
Growth (1990) (percent of
(1994–2000) (percent) population 15+)
United States 1.5 18 0
Pakistan 3.0 19 54
How can we decide which factor explains the most? It seems unlikely that the
small difference in investment/GDP explains the large difference in per capital income,
leaving labor-force growth and illiteracy (or, more generally, technology) as the likely
culprits. But we can be more formal about this using the Solow model.
66 Answers to Textbook Questions and Problems
y
Figure 7–5
Chapter 7 Economic Growth I 67
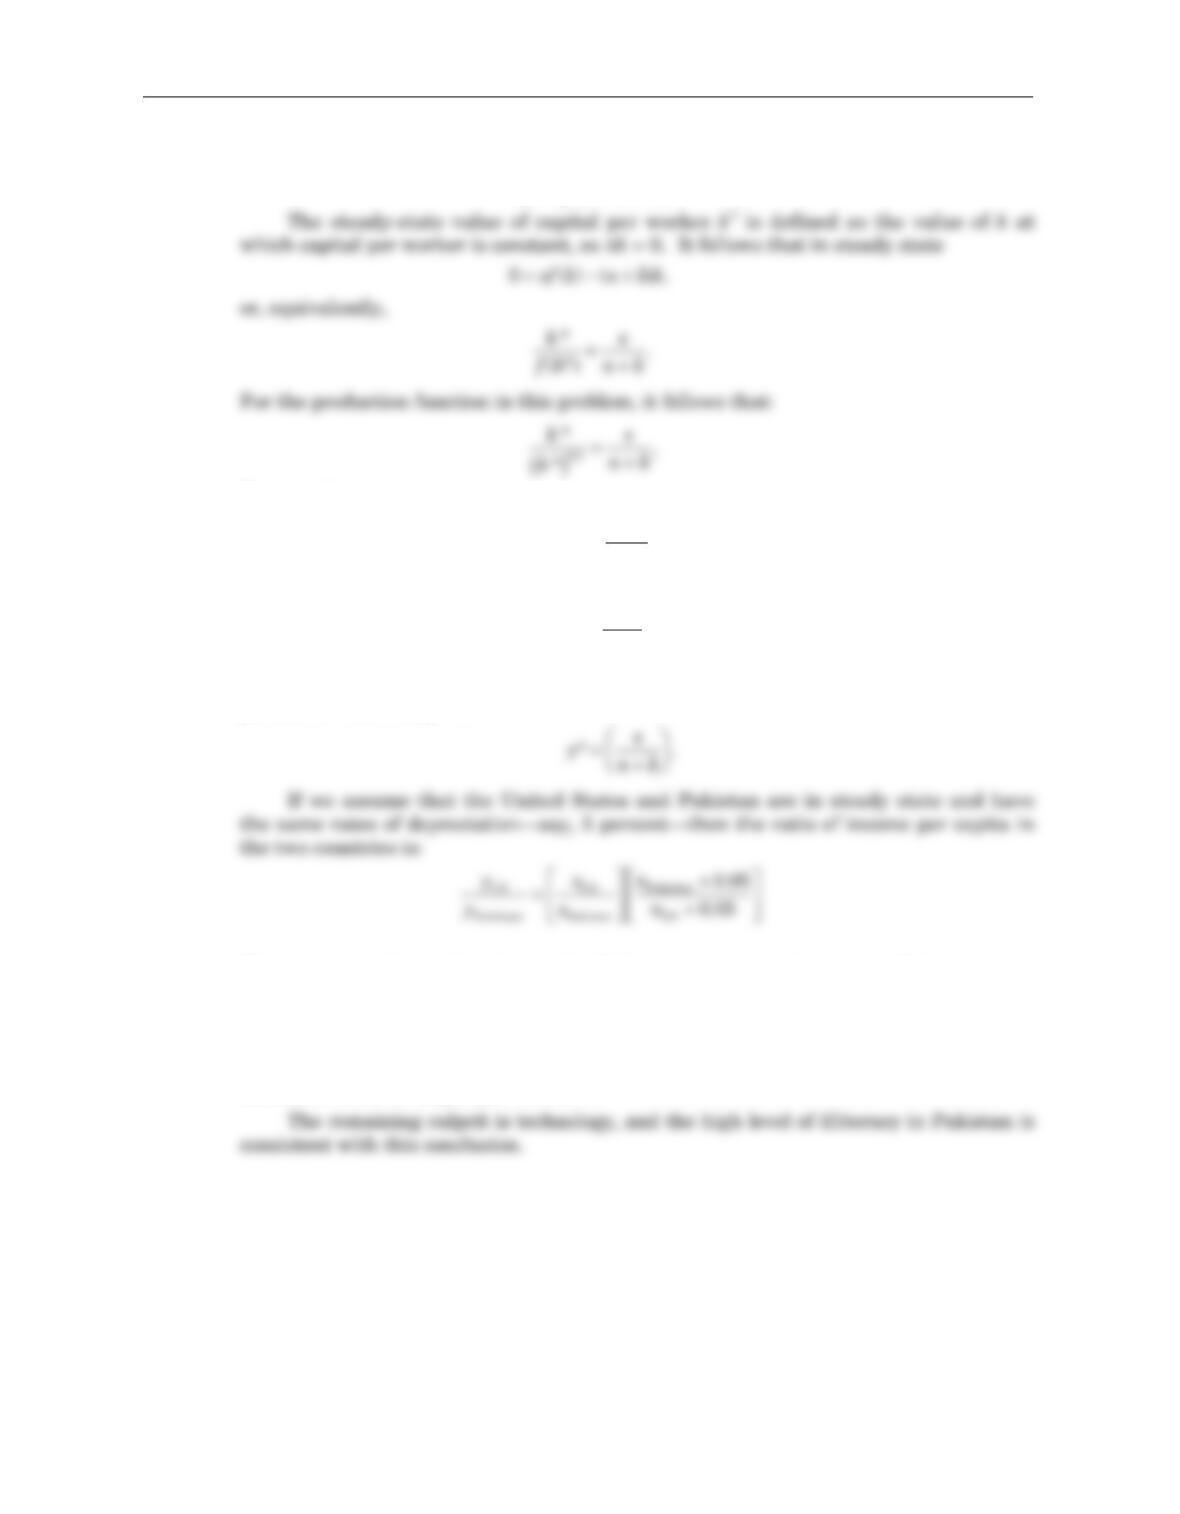
In steady-state, we know that
Rearranging:
or
Substituting this equation for steady-state capital per worker into the per-worker
production function gives:
This equation tells us that if, say, the U.S. saving rate had been twice Pakistan’s sav-
ing rate, then U.S. income per worker would be twice Pakistan’s level (other things
equal). Clearly, given that the U.S. has 17-times higher income per worker but very
similar levels of investment relative to GDP, this variable is not a major factor in the
comparison. Even population growth can only explain a factor of 1.2 (0.08/0.065) dif-
ference in levels of output per worker.
Δδksfk n k=−+() ( ).
ks
n
*,
.
()
=+
05
δ
ks
n
*.=+
⎛
⎝
⎜⎞
⎠
⎟
δ
2