A n s w e r s t o t h e R e v i e w Q u i z z e s
Page 164 (page 572 in Economics)
1. Distinguish between physical capital and financial capital and give two examples of each.
Physical capital is the actual tools, instruments, machines, buildings and other items that have been
2. What is the distinction between gross investment and net investment?
3. What are the three main types of markets for financial capital?
4. Explain the connection between the price of a financial asset and its interest rate.
There is an inverse relationship between the price of a financial asset and its interest rate. When the
Page 171 (page 579 in Economics)
1. What is the loanable funds market?
2. Explain why the real interest rate is the opportunity cost of loanable funds.
The real interest rate is the opportunity cost of loanable funds because the real interest rate measures
3. How do firms make investment decisions?
7
FINANCE, SAVING,
AND INVESTMENT**
C h a p t e r
88 C H A P T E R 7
4. What determines the demand for loanable funds and what makes it change?
The demand for loanable funds depends on the real interest rate and expected profit. If the real interest
5. How do households make saving decisions?
6. What determines the supply of loanable funds and what makes it change?
The supply of loanable funds depends on the real interest rate, disposable income, expected future
income, wealth, and default risk. An increase in the real interest rate increases the quantity of loanable
default risk increases the supply of loanable funds.
7. How do changes in the demand for and supply of loanable funds change the real interest rate and
quantity of loanable funds?
The real interest rate is determined by the supply of loanable funds and the demand for loanable funds.
The equilibrium real interest rate is the real interest rate at which the quantity of loanable funds
Page 173 (page 581 in Economics)
1. How does a government budget surplus or deficit influence the loanable funds market?
2. What is the crowding-out effect and how does it work?
3. What is the Ricardo-Barro effect and how does it modify the crowding-out effect?

F I N A N C E , S A V I N G , A N D I N V E S T M E N T 89
90 C H A P T E R 7
A n s we r s t o t he S t u dy P l a n P r o b l em s a n d A p p l i c a t io n s
Use the following data to work Problems 1 and 2.
Michael is an Internet service provider. On December 31, 2014, he bought an existing business with
servers and a building worth $400,000. During 2015, his business grew and he bought new servers for
$500,000. The market value of some of his older servers fell by $100,000.
1. What was Michael’s gross investment, depreciation, and net investment during 2015?
2. What is the value of Michael’s capital at the end of 2015?
3. Lori is a student who teaches golf on Saturdays. In a year, she earns $20,000 after paying her
taxes. At the beginning of 2014, Lori owned $1,000 worth of books, DVDs, and golf clubs and she
had $5,000 in a savings account at the bank. During 2014, the interest on her savings account was
$300 and she spent a total of $15,300 on consumption goods and services. There was no change
in the market values of her books, DVDs, and golf clubs.
a. How much did Lori save in 2014?
b. What was her wealth at the end of 2014?
4. Treasury Yields Fall to Two-Week Low
Treasury bond prices rose on Monday, pushing interest rates down. The interest rate on 10-year
bonds fell 4 basis points to 1.65%.
Source: The Wall Street Journal, August 27, 2012
What is the relationship between the price of a treasury bond and its interest rate? Why does the
interest rate move inversely to price?
F I N A N C E , S A V I N G , A N D I N V E S T M E N T 91
8.5
8.0
7.5
7.0
7.0
6.5
6.0
Use the following information to work Problems 5 and 6.
First Call, Inc., a smartphone company, plans to build an
assembly plant that costs $10 million if the real interest
rate is 6 percent a year or a larger plant that costs $12
million if the real interest rate is 5 percent a year or a
smaller plant that costs $8 million if the real interest rate
is 7 percent a year.
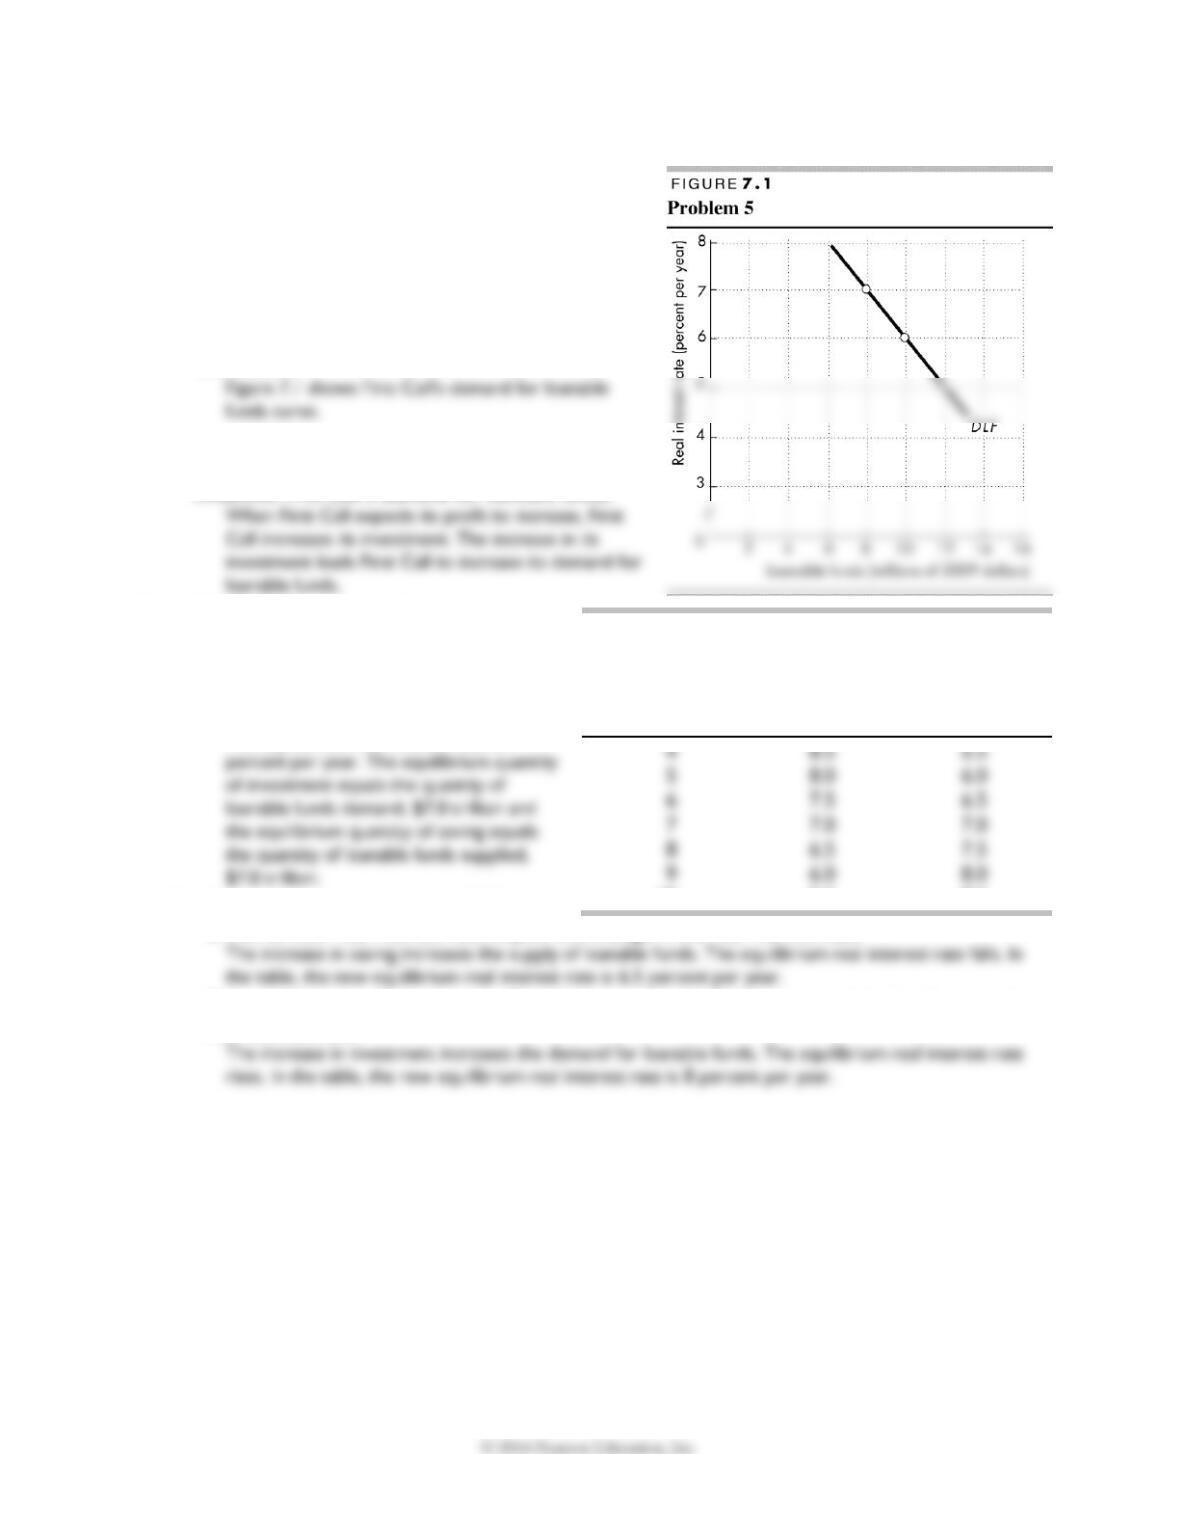
5. Draw a graph of First Call’s demand for loanable
funds curve.
6. First Call expects its profit to double next year.
Explain how this increase in expected profit
influences First Call’s demand for loanable funds.
7. The table sets out data for an economy
when the government’s budget is
balanced.
a. Calculate the equilibrium real interest
rate, investment, and private saving.
The equilibrium real interest rate is 7
b. If planned saving increases by $0.5
trillion at each real interest rate, explain the change in the real interest rate.
c. If planned investment increases by $1 trillion at each real interest rate, explain the change in the
real interest rate.
Real interest
rate
Loanable
funds
demanded
Loanable funds
supplied
(percent per
year)
(trillions of 2009 dollars)
10
5.5
8.5
92 C H A P T E R 7
year)
4
9.5
7.5
6.5
Use the data in Problem 7 to work Problems 8 and 9.
8. If the government’s budget becomes a deficit of $1 trillion, what are the real interest rate and
investment? Does crowding out occur?
9. If the government’s budget becomes a deficit of $1 trillion and the Ricardo-Barro effect occurs,
what are the real interest rate and the investment?
Use the table in Problem 7 and the following data to work Problems 10 and 11.
Suppose that the quantity of loanable funds demanded increases by $1 trillion at each real interest rate
and the quantity of loanable funds supplied increases by $2 trillion at each interest rate.
10. If the government budget remains balanced, what are the real interest rate, investment, and
private saving? Does any crowding out occur?
The table to the right, which shows the
11. If the government’s budget becomes a
deficit of $1 trillion, what are the real
interest rate, investment, and private
saving? Does any crowding out occur?
5
9.0
8.0
6
8.5
8.5
7
8.0
9.0
8
7.5
9.5
9
7.0
10.0
F I N A N C E , S A V I N G , A N D I N V E S T M E N T 93
Answers to Additional Problems and Applications
12. On January 1, 2014, Terry’s Towing Service owned 4 tow trucks valued at $300,000. During
2014, Terry’s bought 2 new trucks for a total of $180,000. At the end of 2014, the market value
of all of the firm’s trucks was $400,000. What was Terry’s gross investment? Calculate Terry’s
depreciation and net investment.
Use the following information to work Problems 13 and 14.
The Bureau of Economic Analysis reported that the U.S. capital stock was $46.3 trillion at the end of
2010, $46.6 trillion at the end of 2011, and $47.0 trillion at the end of 2012. Depreciation in 2011 was
$2.4 trillion, and gross investment during 2012 was $2.8 trillion (all in 2009 dollars).
13. Calculate U.S. net investment and gross investment during 2011.
Net investment equals the change in the capital stock. In 2011, U.S. net investment was $46.6 trillion −
14. Calculate U.S. depreciation and net investment during 2012.
15. Annie runs a fitness center. On December 31, 2014, she bought an existing business with exercise
equipment and a building worth $300,000. During 2015, business improved and she bought some
new equipment for $50,000. At the end of 2015, her equipment and buildings were worth
$325,000. Calculate Annie’s gross investment, depreciation, and net investment during 2015.
16. Karrie is a golf pro, and after she paid taxes, her income from golf and interest from financial
assets was $1,500,000 in 2013. At the beginning of 2013, she owned $900,000 worth of financial
assets. At the end of 2013, Karrie’s financial assets were worth $1,900,000.
a. How much did Karrie save during 2013?
b. How much did she spend on consumption goods and services?
17. In a speech at the CFA Society of Nebraska in February 2007, William Poole (former Chairman of
the St. Louis Federal Reserve Bank) said: Over most of the post-World War II period, the
personal saving rate averaged about 6 percent, with some higher rates from the mid-1970s to
mid-1980s. The negative trend in the saving rate started in the mid-1990s, about the same time
the stock market boom started. Thus it is hard to dismiss the hypothesis that the decline in the
measured saving rate in the late 1990s reflected the response of consumption to large capital
gains from corporate equity [stock]. Evidence from panel data of households also supports the
conclusion that the decline in the personal saving rate since 1984 is largely a consequence of
capital gains on corporate equities.
a. Is the purchase of corporate equities part of household consumption or saving? Explain your
answer.
equities are not consumable goods or services.
b. Equities reap a capital gain in the same way that houses reap a capital gain. Does this mean that
the purchase of equities is investment? If not, explain why it is not.
18. Draw a graph to illustrate the effect of an
increase in the demand for loanable funds and an
even larger increase in the supply of loanable
funds on the real interest rate and the
equilibrium quantity of loanable funds.
Figure 7.2 shows the effect of an increase in the
demand for loanable funds and an even larger
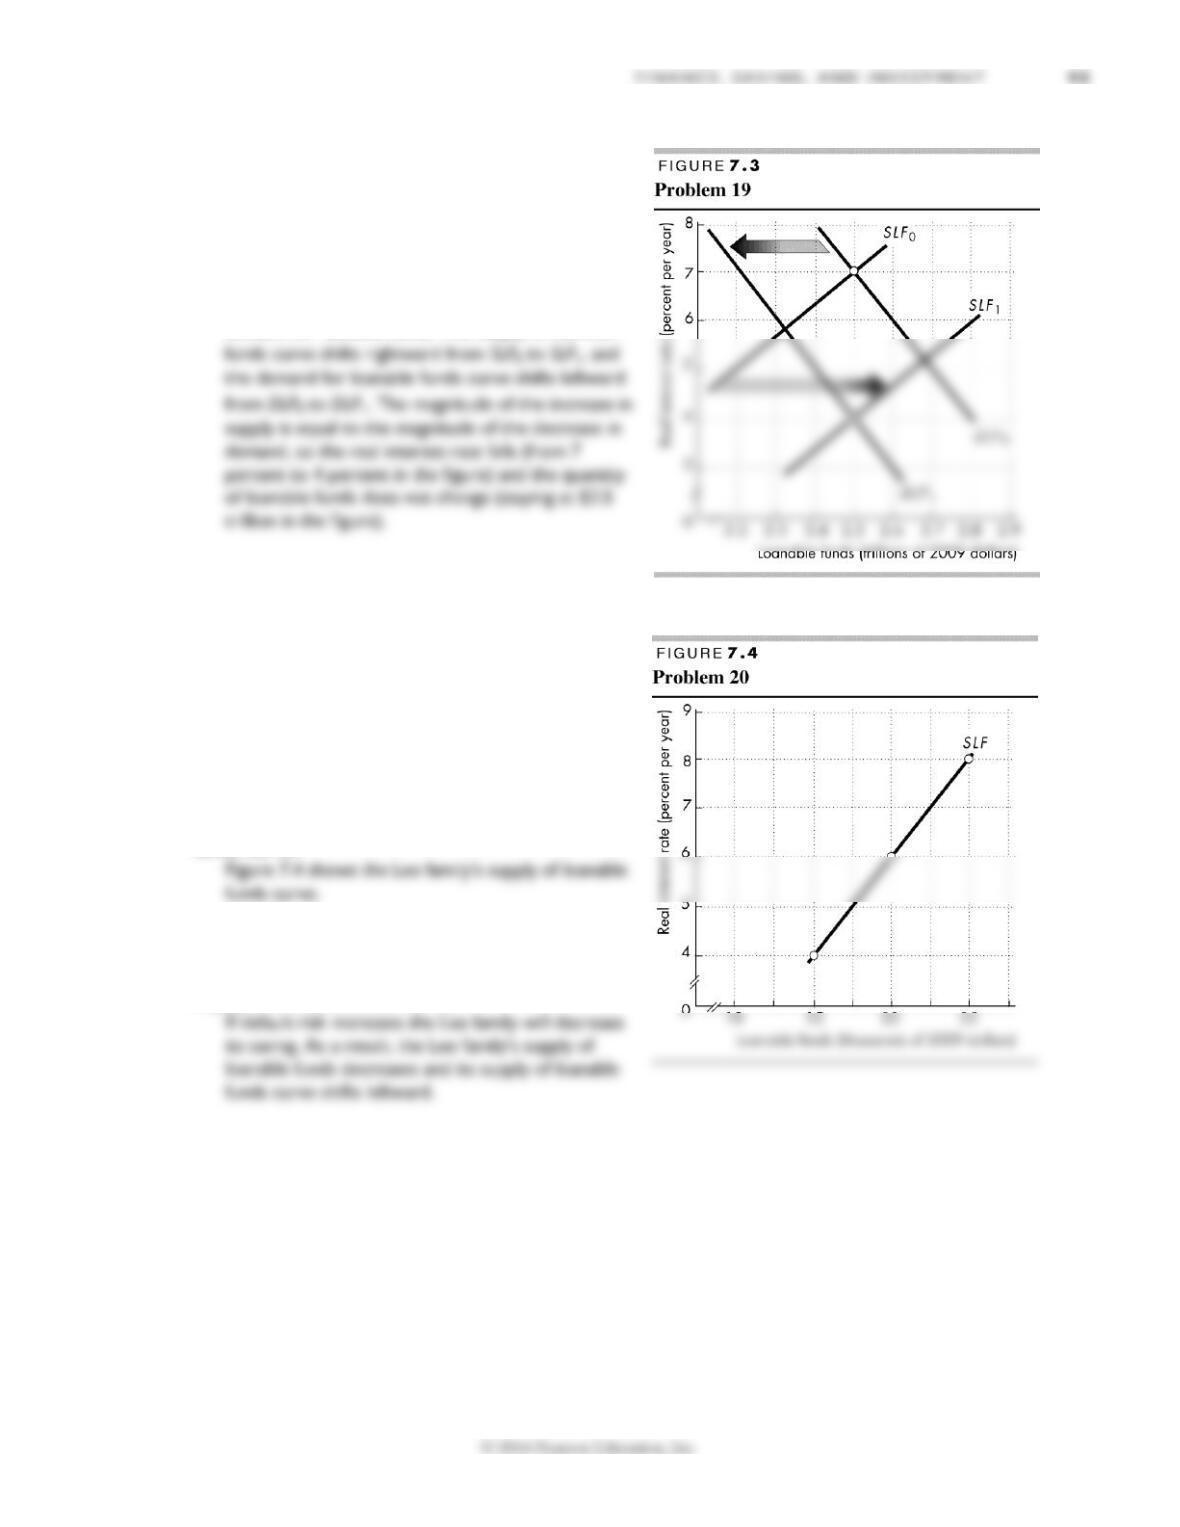
19. Draw a graph to illustrate how an increase in the
supply of loanable funds and a decrease in the
demand for loanable funds can lower the real
interest rate and leave the equilibrium quantity of
loanable funds unchanged.
Figure 7.3 shows the effect of an increase in the
supply of loanable funds and a decrease in the
demand for loanable funds. The supply of loanable
Use the following information to work Problems 20 and 21.
In 2012, the Lee family had disposable income of
$80,000, wealth of $140,000, and an expected future
income of $80,000 a year. At a real interest rate of 4
percent a year, the Lee family saves $15,000 a year; at a
real interest rate of 6 percent a year, they save $20,000 a
year; and at a real interest rate of 8 percent, they save
$25,000 a year.
20. Draw a graph of the Lee family’s supply of loanable
funds curve.
21. In 2013, suppose that the stock market crashes
and the default risk increases. Explain how this
increase in default risk influences the Lee family’s
supply of loanable funds curve.
2
8.0
3
7.0
4
6.0
6.0
5
5.0
6
4.0
22. Keystone Pipeline Clears a Hurdle
A judge in Lamar County, Texas, ruled that TransCanada has permission to build its Keystone XL
pipeline from Cushing, Okla. to Port Arthur, Texas. TransCanada has said it will start building as
soon as possible.
Source: CNN, August 23, 2012
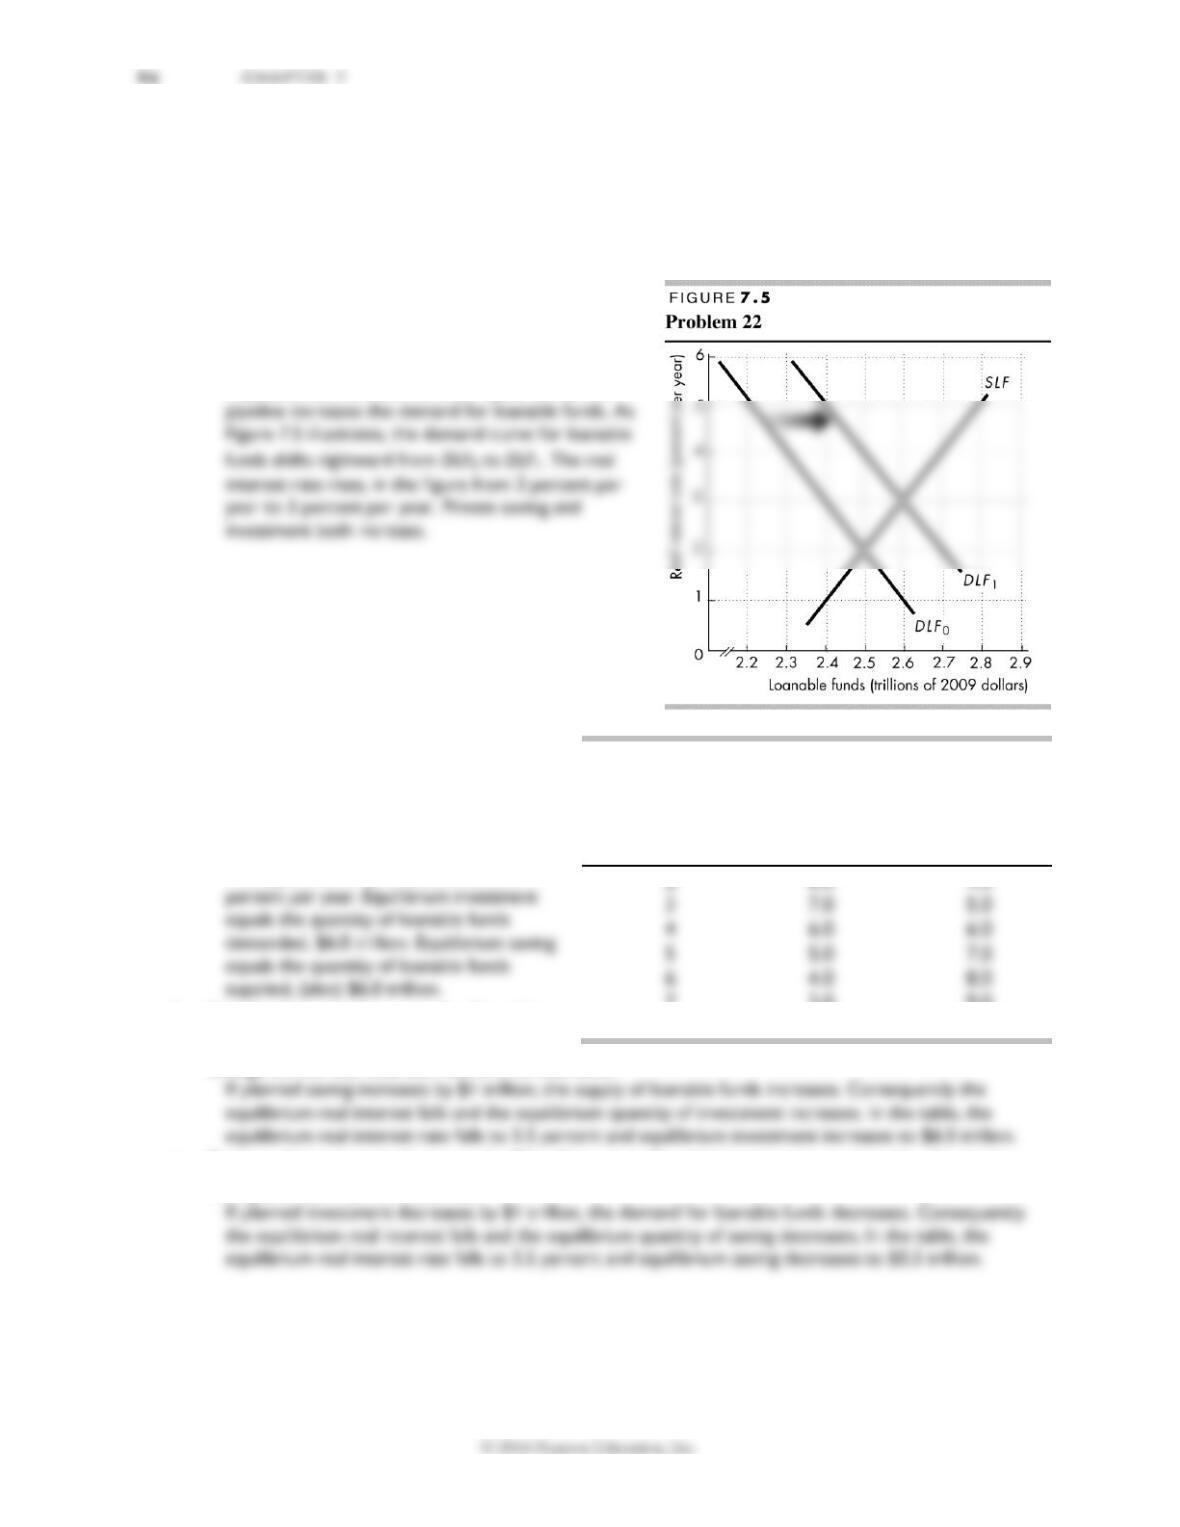
Show on a graph the effect of TransCanada going to
the loanable funds market to finance the building of
its pipeline. Explain the effect on the real interest
rate, private saving, and investment.
Keystone’s demand for financial capital to fund its
23. The table sets out the data for an
economy when the government’s budget
is balanced.
a. Calculate the equilibrium real interest
rate, investment, and private saving.
The equilibrium real interest rate is 4
b. If planned saving decreases by $1 trillion
at each real interest rate, explain the
change in the real interest rate and investment.
c. If planned investment decreases by $1 trillion at each real interest rate, explain the change in
saving and the real interest rate.
Real interest
rate
Loanable
funds
demanded
Loanable funds
supplied
(percent per
year)
(trillions of 2009 dollars)
7
3.0
9.0
8
2.0
10.0
F I N A N C E , S A V I N G , A N D I N V E S T M E N T 97
Use the following information to work Problems 24 and 25.
India’s Economy Hits the Wall
At the start of 2008, India had an annual growth of 9 percent, huge consumer demand, and increasing
investment. But by July 2008, India had large government deficits and rising interest rates. Economic
growth is expected to fall to 7 percent by the end of 2008. A Goldman Sachs report suggests that India
needs to lower the government’s deficit and raise educational achievement.
Source: Business Week, July 1, 2008
24. If the Indian government reduces its deficit and returns to a balanced budget, how will the
demand for or supply of loanable funds in India change?
25. With economic growth forecasted to slow, future incomes are expected to fall. If other things
remain the same, how will the demand or supply of loanable funds in India change?
26. Federal Deficit Surges to $1.38 trillion through August
House Republican Leader John Boehner of Ohio asks: When will the White House tackle these
jaw-dropping deficits that pile more and more debt on future generations while it massively
increases federal spending?
Source: USA Today, September 11, 2009
Explain the effect of federal deficit and the mounting debt on U.S. economic growth.
Economics in the News
27. After you have studied Economics in the News on pp. 174–175 (582–583 in Economics), answer the
following questions.
a. Why does the news article say that bond prices and interest rates move in opposite directions?
Is it correct? Explain.
The article says that bond prices and interest rates move in opposite directions because the interest
b. How does a government budget deficit influence the loanable funds market and why does a
decrease in the deficit lower the interest rate?
c. When an economic expansion gets going, what happens to the demand for loanable funds and
the interest rate?
d. If an expanding economy increases government tax revenue, how will that affect the loanable
funds market and the real interest rate?
98 C H A P T E R 7
e. Looking at Fig. 1 on p. 175 (page 583 in Economics), what must have happened to either the
demand for or the supply of loanable funds during 2011, 2012, and 2013?
In 2011 the interest rate fell, was low in 2012, and then started to rise in 2013. In 2011, either the
28. Investors Help the Rich Pay off Student Loans
Innovative financial institutions are buying student loans, bundling the loans into securities, and
selling the securities to people looking for a higher interest rate.
Source: CNN Money, July 28, 2014
a. How does the financial innovation described in the news clip influence the supply of and demand
for loanable funds and the equilibrium real interest rate?
b. If the securitization of student loans lowers the real interest rate faced by students, how would
you expect it to influence the demand for human capital and the equilibrium quantity of human
capital?