Unlock document.
This document is partially blurred.
Unlock all pages and 1 million more documents.
Get Access

7 Offshoring of Goods and Services
Notes to Instructor
Chapter Summary
Up to this point, we have focused on the trade of final goods and services—consumer
goods. But, a significant amount of trade involves intermediate goods and services or
inputs that are used to build end products for sale to consumers. None of the models
covered up until now have addressed this type of trade. It will be the focus of this
chapter.
We will concentrate on offshoring, although this type of trade in intermediate goods can
also involve outsourcing. Offshoring is defined as “the provision of a service or the
production of various parts of a good in different countries that are then used or
assembled into a final good in another location.” Offshoring implies that the firm retains
The chapter examines whether offshoring or the shift toward skill-biased technological
equipment explains the increase in the demand for high-skilled labor in the United States.
There is a discussion of the potential loss of U.S. comparative advantage to countries
2
Comments
Offshoring is a deeply debated and political topic. Therefore, it is likely that your
students have some ideas about the impact of offshoring on their futures. After reminding
them of what they have learned thus far about the potential gains from international trade,
ask your students whether they support policies to limit offshoring. To motivate the topic,
Lecture Notes
Introduction
Offshoring materials, parts, components, and services necessary to produce the simplest
to the most sophisticated products is common. Technically, offshoring is defined as “the
provision of a service or the production of various parts of a good in different countries
that are then used or assembled into a final good in another location.” Offshoring differs
S I D E B A R
“Foreign Outsourcing” Versus “Offshoring”
Offshoring is defined as Foreign production of goods in plants owned by the Home firm.
As an example, Intel produces microchips in subsidiaries in China and Costa Rica. By
contrast, outsourcing occurs when a Home firm subcontracts the production of its product
4
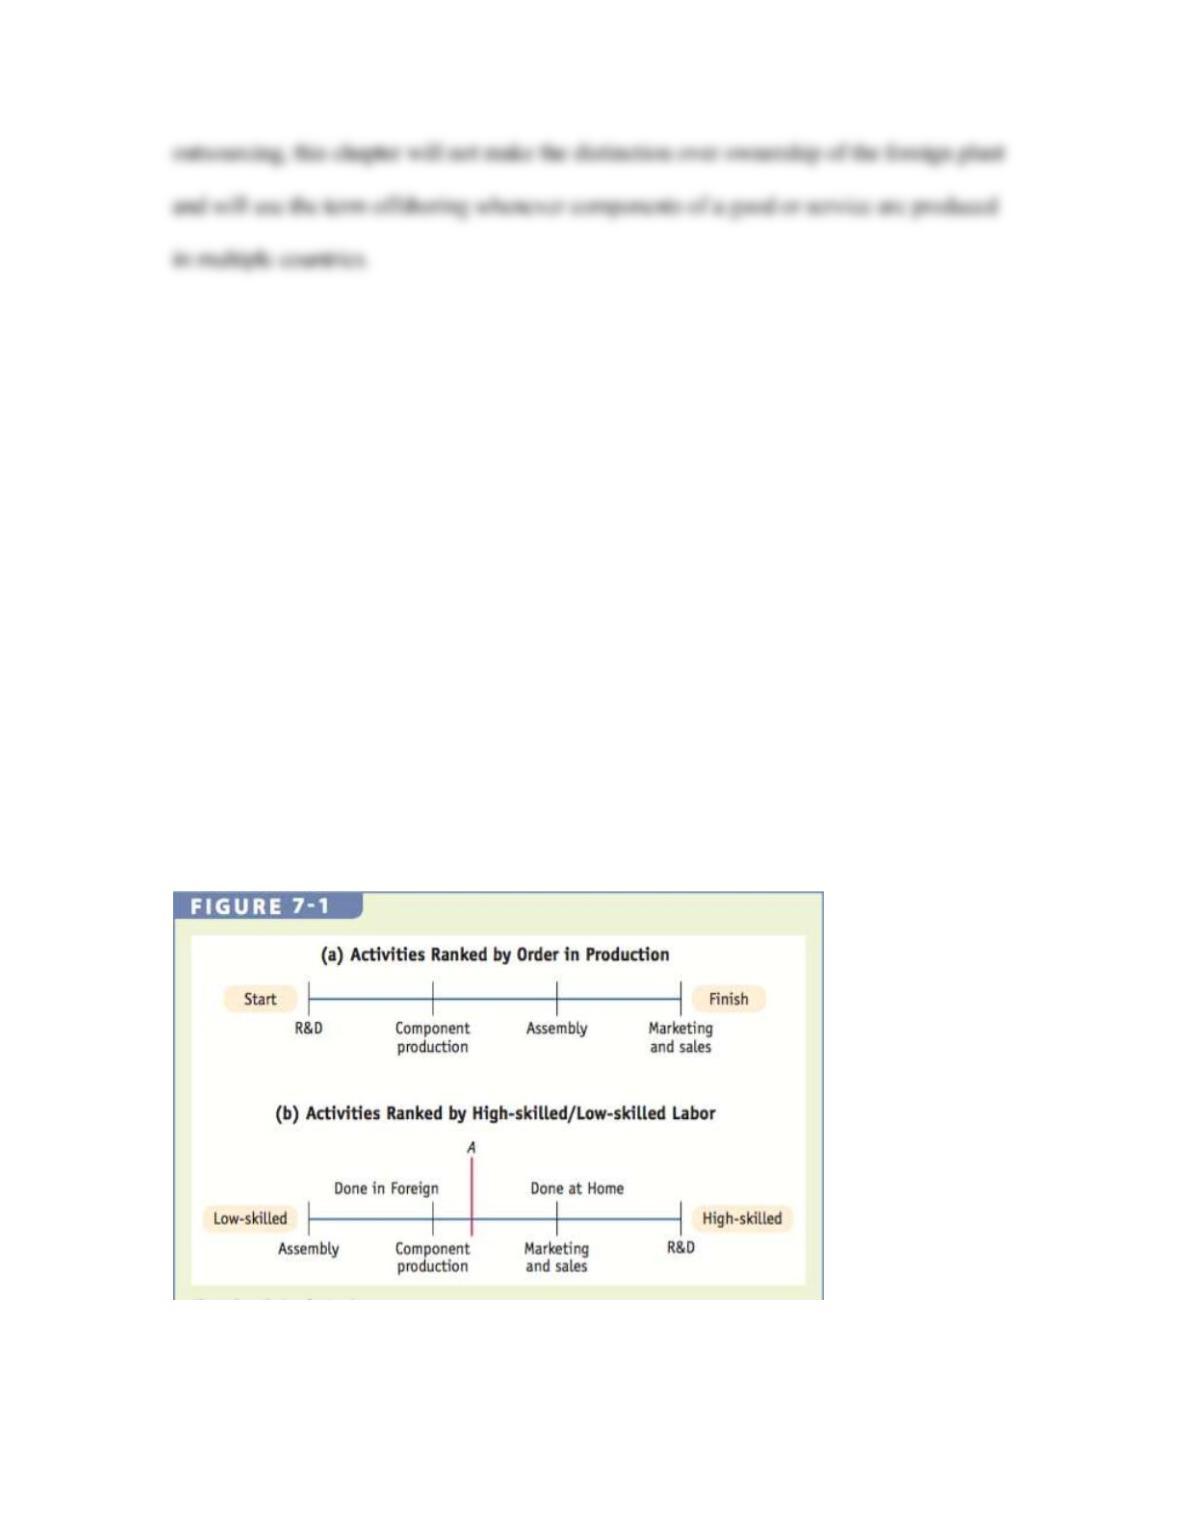
1 A Model of Offshoring
We begin by building a model of offshoring by ranking skill intensity across the activities
or processes (called the value chain) involved in producing a good. Panel (a) of Figure 7-
1 presents the production process in chronologic order, namely, from research and
development to marketing and after-sales service. By contrast, panel (b) gives the rank of
the activities based on the ratio of high-skilled to low-skilled labor required in the
process, with assembly as the least skilled-intensive part of the production to research and
development the most skilled-intensive.
5
Value Chain of Activities
Figure 7-1 illustrates the value chain for the product because each subsequent activity
adds additional marginal value to the previous activity in order to produce the final good.
Assumption 1: The relative wage of low-skilled labor to high-skilled labor is lower in
Foreign than at Home.
Letting WL (WH) denote the wage of low-skilled (high-skilled) labor at Home, whereas
WL*(WH*) represents those in Foreign, we make the assumption that compared with
Home, wages in Foreign are less (WL* < WL and WH* < WH) and the relative wage of low-
skilled labor is lower (WL*/WH* < WL/WH).

6
Assumption 2: Costs of capital and trade apply uniformly across all activities in the
value chain. In deciding whether to offshore certain activities in its production process, a
firm must weigh the savings in labor cost achieved by shifting to the lower-wage Foreign
country against the additional costs associated with doing business abroad. These
additional “trade costs” include physical capital of a foreign plant or factory,
transportation and communication, and Foreign-imposed tariffs. So to simplify the firm’s
decision process, we assume its decision to offshore is based only on the savings in labor
costs and, regardless of the source, all costs of capital and trade apply uniformly across
all activities in the value chain.
Assuming that capital and trade apply uniformly across the value chain may be
unrealistic because costs of communication and transportation can vary significantly in
developing countries. Consider China and India, where infrastructure like roads has
improved much more slowly than telecommunication networks. This means that the
models.
Slicing the Value Chain Given our assumptions, the firm will maintain the more skill-
intensive activities at Home and shift the least skill-intensive activities abroad. Referring
to panel (b) of Figure 7-1, the firm is slicing the value chain by shifting all activities to
Relative Demand for Skilled Labor Across the Value Chain Adding the demand for
high-skilled and low-skilled labor in the activities to the right of line A in Figure7-1(b),
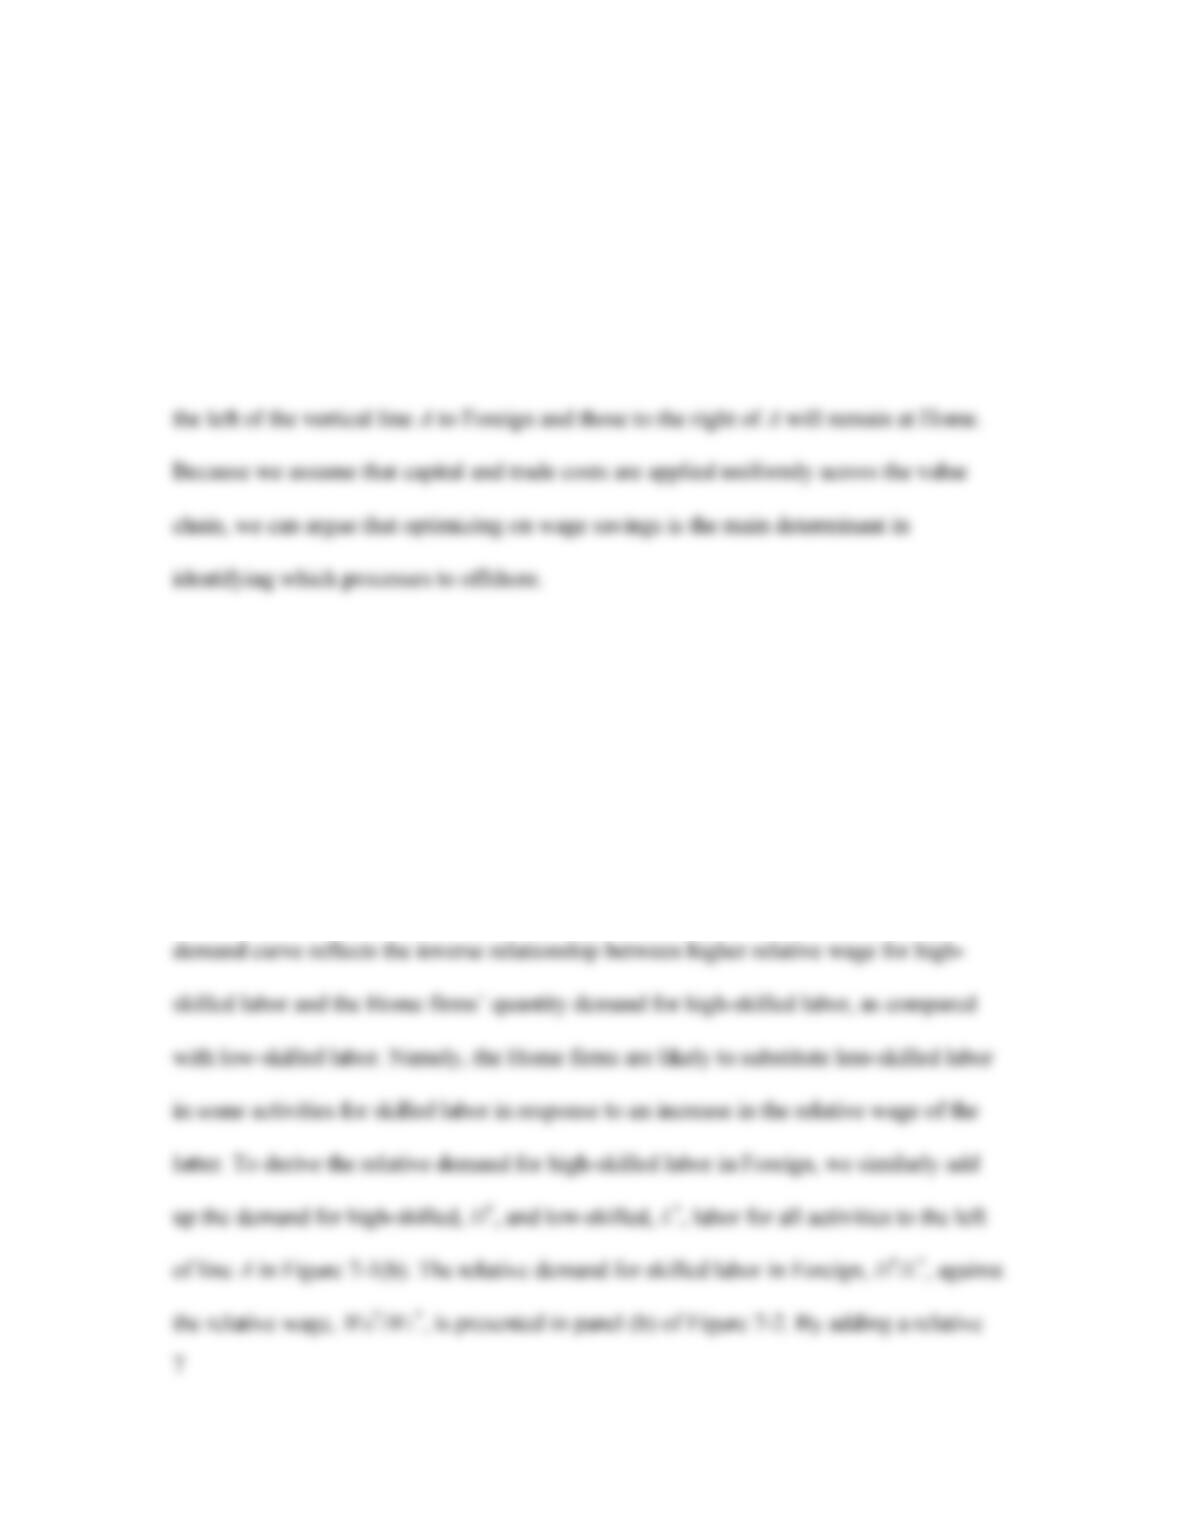
we obtain Home’s relative demand for high-skilled labor, as illustrated in Figure 7-2(a),
where the horizontal axis is the relative demand for skilled labor, H/L, and the vertical
axis gives the relative wage of high-skilled labor, WH/WL. The downward-sloping relative
8
Our next task is to study how the equilibria move as Home begins to offshore processes
to Foreign.
Changing in Foreign Costs and in Offshoring With our assumptions thus far, we see
that Home will send abroad to Foreign its least skilled-intensive activities, namely, those
to the left of line A, in Figure 7-1(b). Suppose further that the cost of offshoring decreases
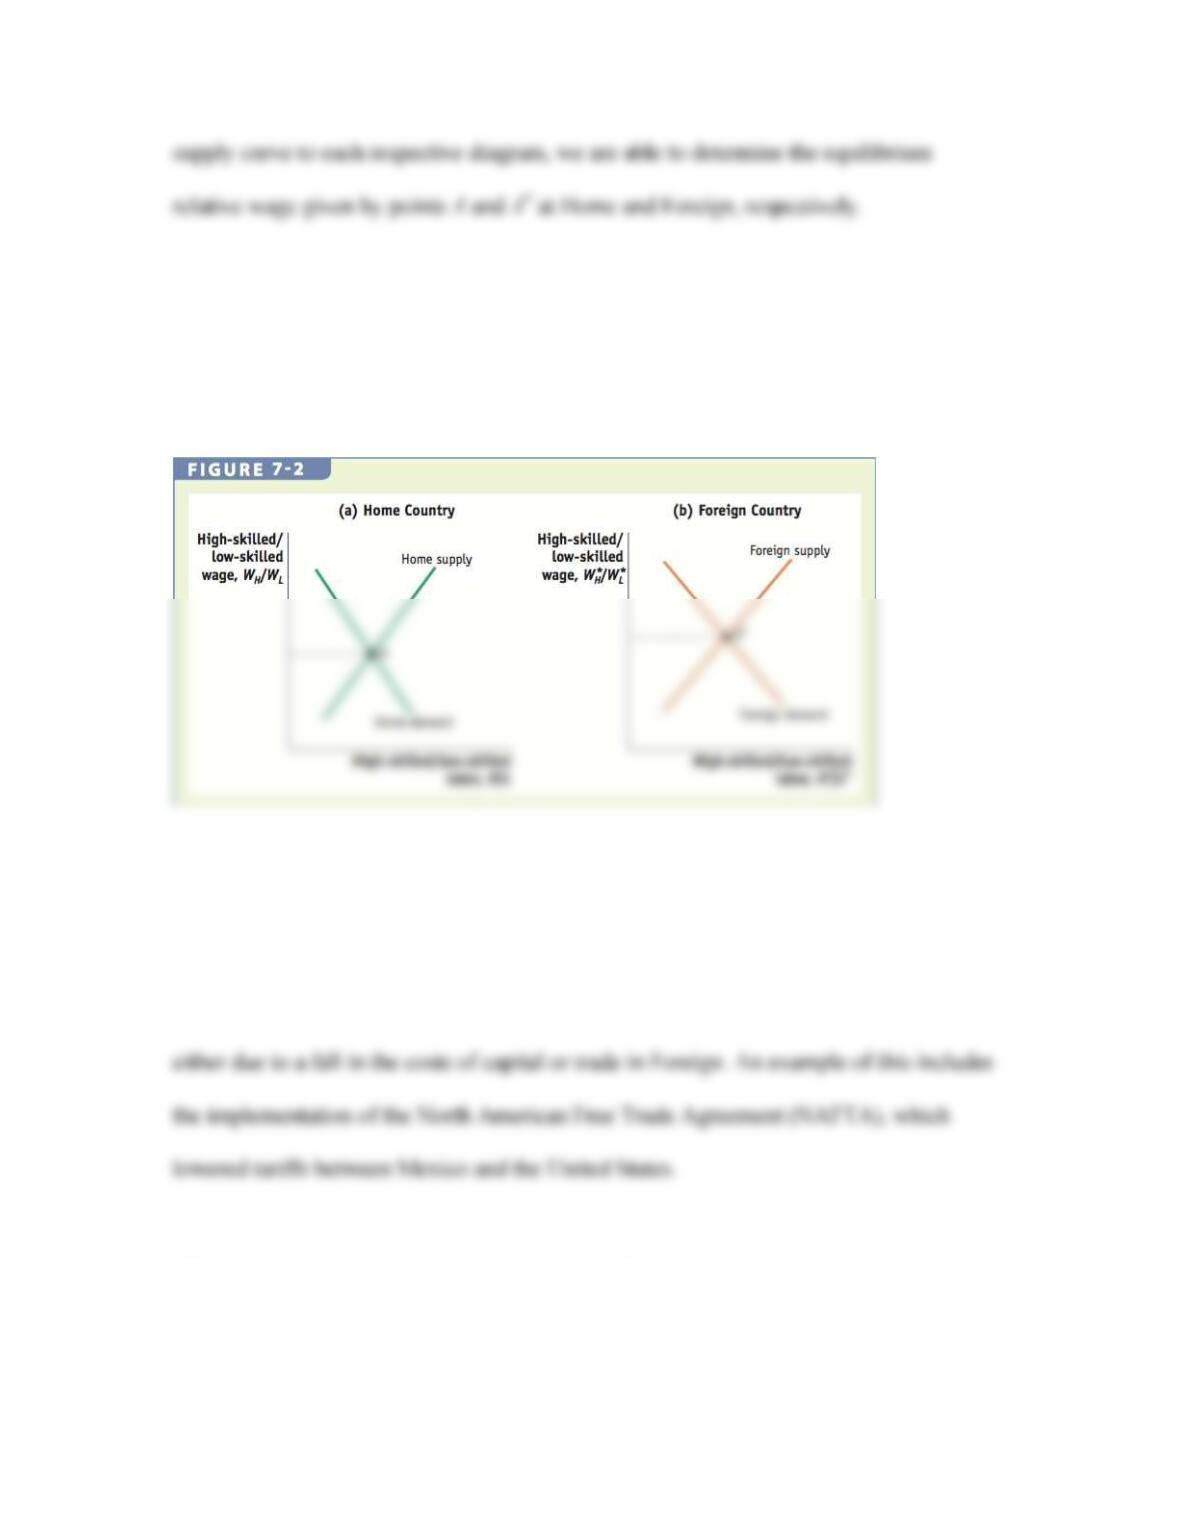
Effect on Home Relative Labor Demand and Relative Wage Due to the decline in
trade costs, the Home firm will be motivated to shift more activities or processes in the

9
value chain to Foreign. In other words, Home will move the next least skilled-intensive
production processes abroad, as illustrated by the area between lines A and B in Figure 7-
3. These activities, although more skilled-intensive than those sent to Foreign before the
Note that Figure 7-4 does not identify absolute quantity of labor demanded. In fact, both
high- and low-skilled labor employment fall when offshoring occurs. This figure shows
Effect on Foreign Relative Labor Demand and Relative Wage Similarly, the average
10
range of activities in Foreign is now more skilled labor intensive as well due to the
additional offshoring done by the Home firm. Although the newly outsourced activities
(between lines A and B) are less skilled intensive, as compared with those maintained at
It is recommended that you go through the example provided in the textbook to help
students understand how all of this is possible. Consider a physics student who is

11
This model concludes by predicting:
As activities in the middle of the value chain are shifted by offshoring from Home to
Foreign, they raise the relative demand for skilled labor in both countries because these
2 Explaining Changes in Wages and Employment
The wage differential between high-skilled and low-skilled workers in developed
countries such as the United States, Australia, Canada, Japan, Sweden, and the United
Kingdom, as well as less-developed countries such as Chile, Hong Kong, and Mexico,
has increased since the early 1980s. So, at first glance the data appear to be consistent
with our model. But, let’s take a closer look at the data for Mexico and the United States.
What has the change in wages and employment been due to offshoring for these two
countries?
Changes in the Relative Wage of Non-Productive Workers in the United States A
comparison of the wage movements in the manufacturing industries allows us to more
accurately attribute each factor explaining the widening wage differential experienced in
the United States.
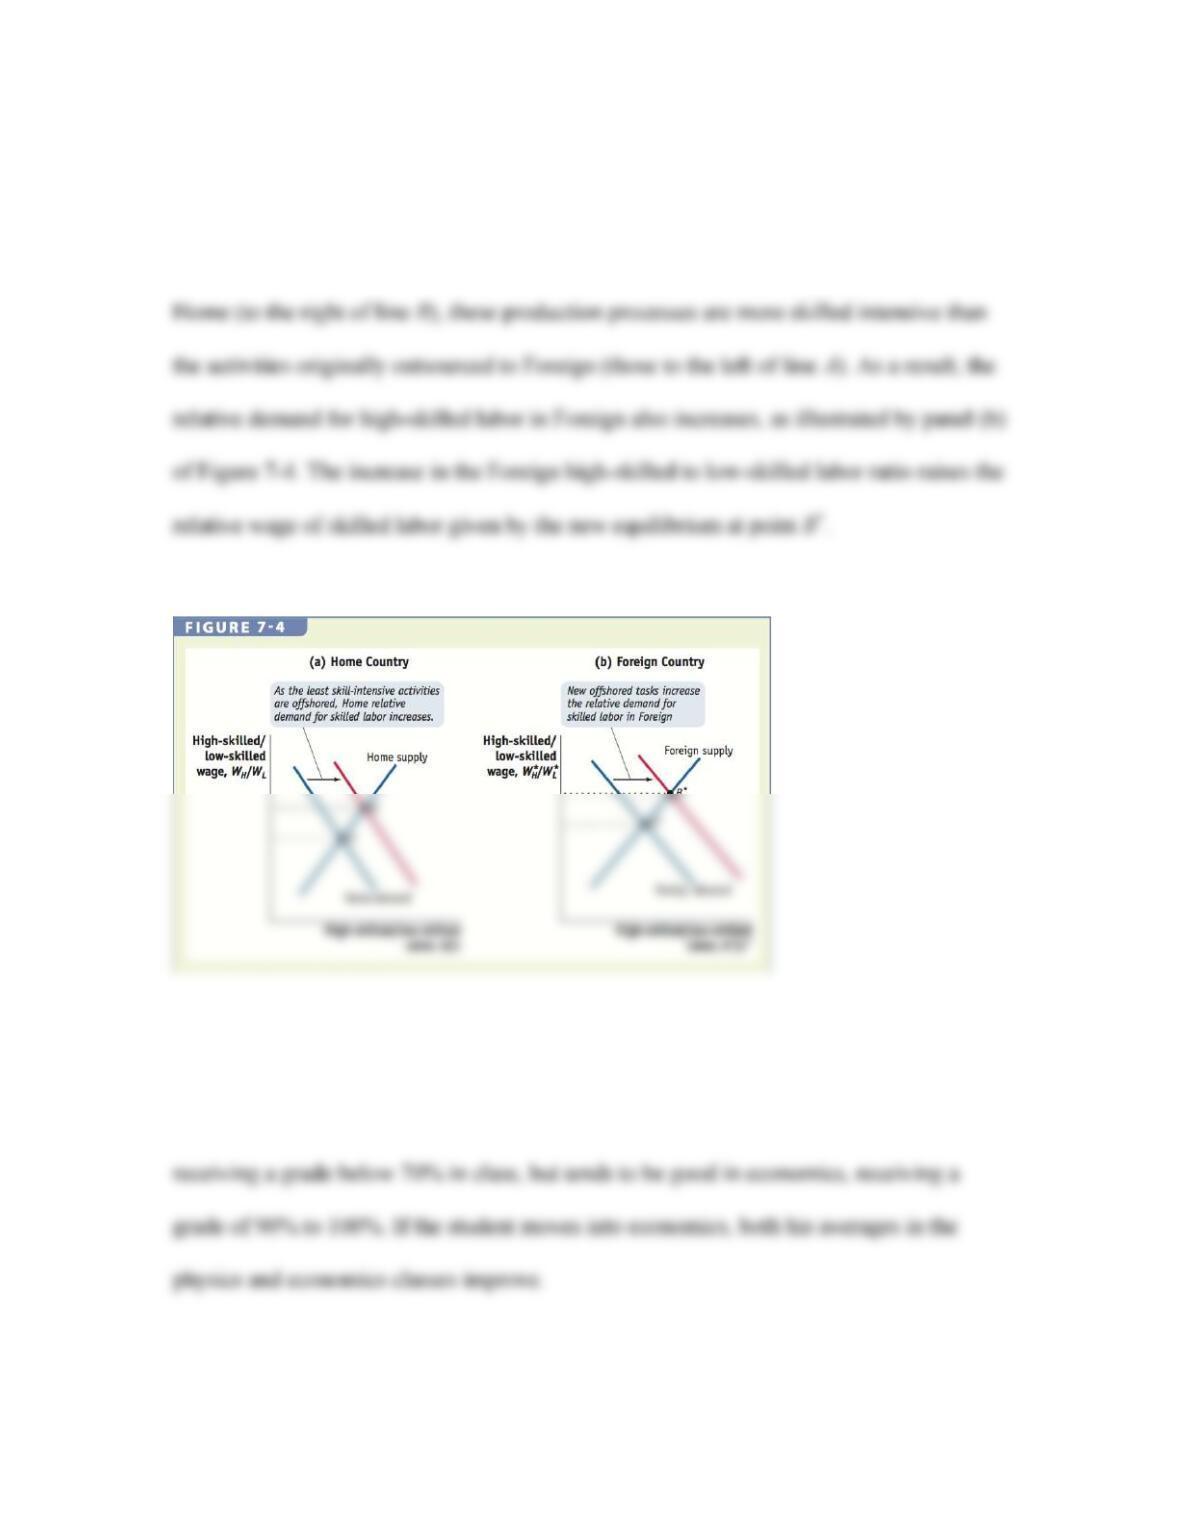
From Figure 7-5, we see that the average annual earnings of nonproduction workers
relative to production workers in U.S. manufacturing did not follow any particular trend
12
between 1958 and 1967. But, from 1968 to 1982, the relative wage of nonproduction
workers exhibited a downward trend. This decline is attributed to an increase in the
Changes in Relative Employment of Non-Production Workers Figure 7-6 shows the
relative employment of nonproduction to production workers in U.S. manufacturing from
The increase in the relative supply of college-educated workers in nonproduction from
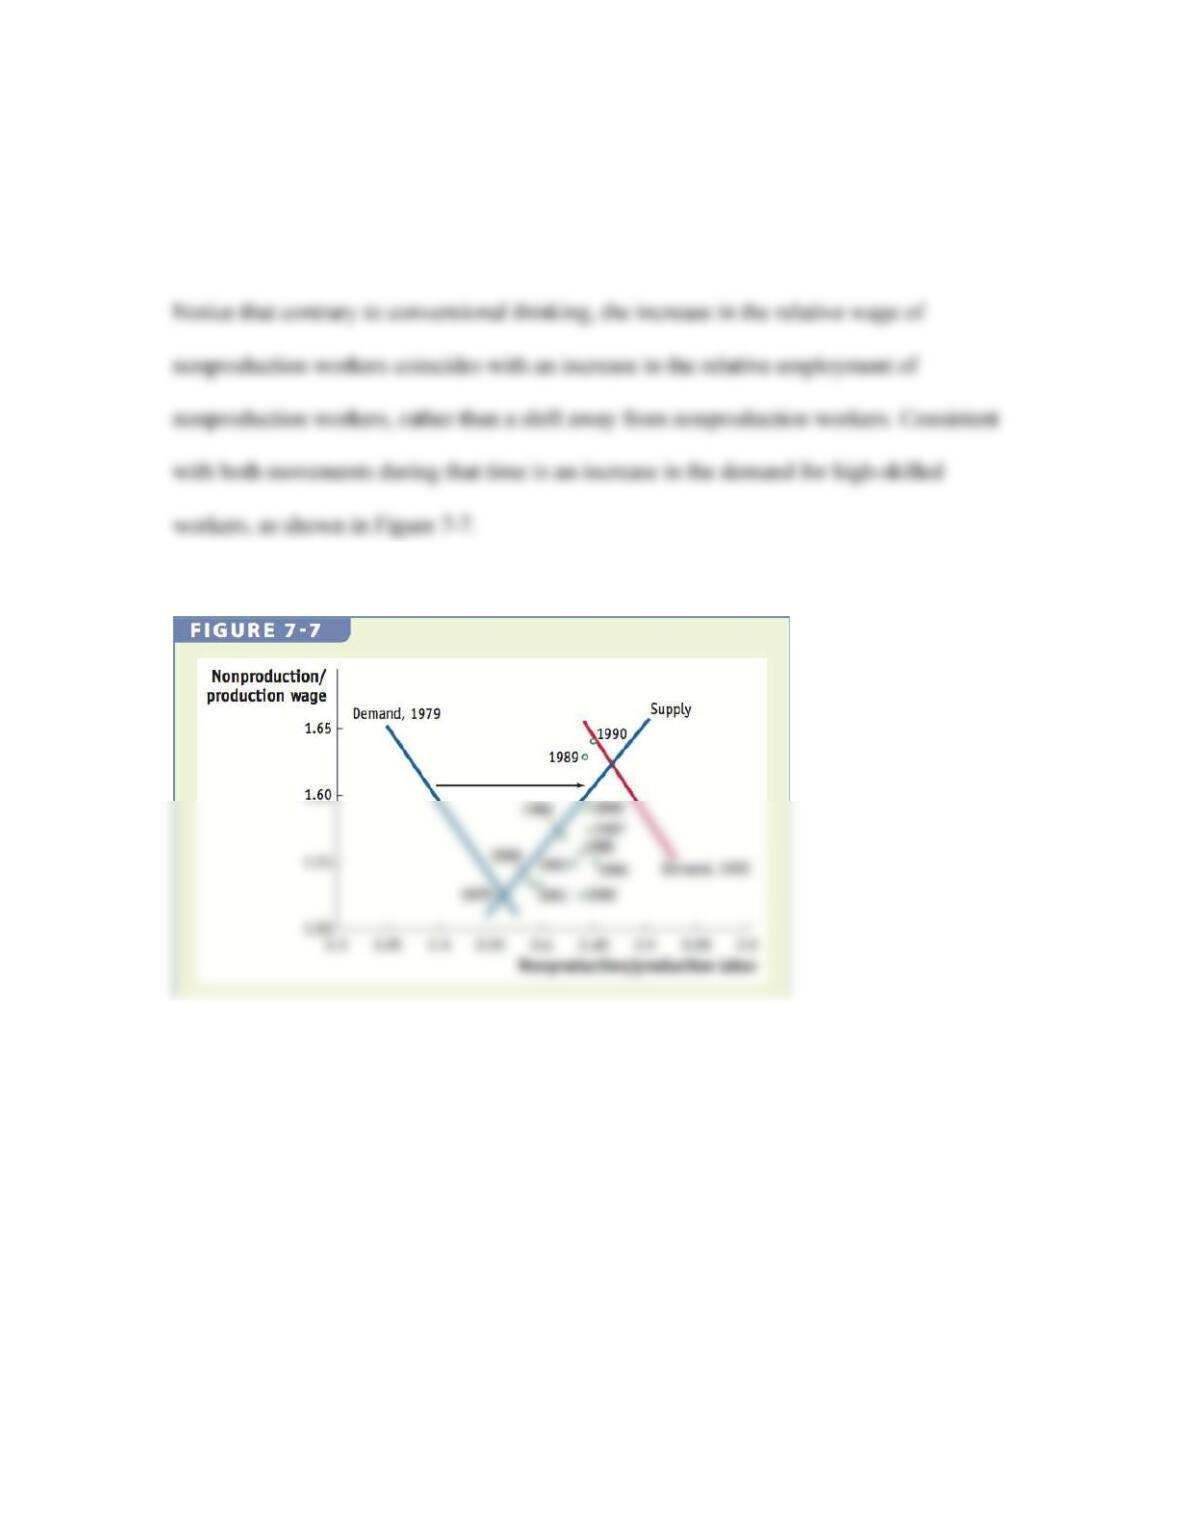
13
1962 to 1982 coincides with both the decline in the relative wage (Figure 7-5) and
expansion in relative employment (Figure 7-6) of nonproduction workers.
Explanations The increase in the relative demand for high-skilled workers due to
offshoring is only one possible explanation for the rising wage gap between high-skilled
and low-skilled workers in the United States and other countries. The increase in the
relative demand for high-skilled workers can also partly be explained by the shift toward
computers and other high-tech equipment, or skill-biased technological change.

14
Both of these two reasons could explain an increase in the relative demand for skilled
workers in the United States. Offshoring as well as skill-based technological change
could result in a rightward shift in demand for skilled workers, as shown in Figure 7-4(a).
Given the observation of an increase in relative demand, how do we determine which is
the actual cause?
The approach taken is twofold. First, to determine whether skill-based technological
change is the culprit, researchers analyzed the changes in the quantity of high-tech
equipment used in manufacturing. And second, to determine if offshoring is the cause,
Changes in the Relative Wage of Nonproductive Workers in Mexico As predicted by
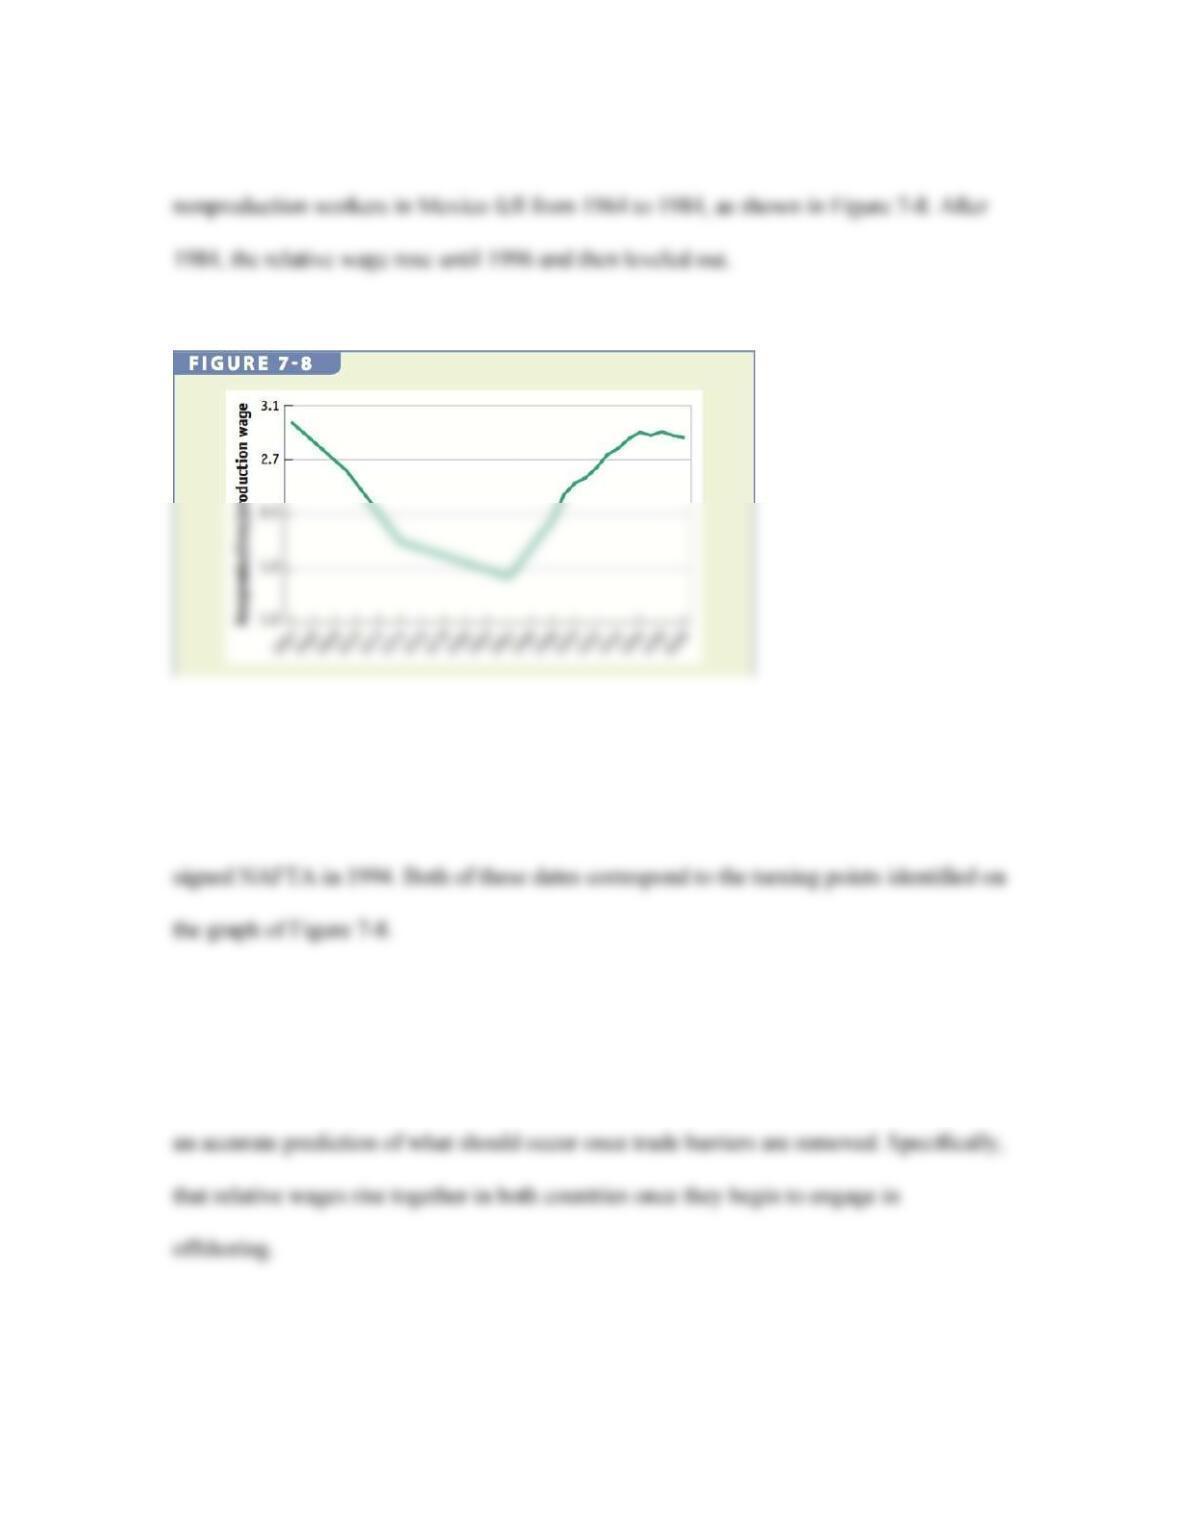
15
the offshoring model described in the preceding section, the relative wage of
Mexico initiated trade liberalization policies following its debt crisis in 1982, reducing
trade barriers and encouraging Foreign Direct Investment (FDI). In addition, Mexico
Thus, it is important to point out that the fall in wages from 64 to 84 and the rise in wages
from 84 to 96 is exactly what occurred in the United States, suggesting that our model is
16
Job Polarization in the United States The data from 1990 to 2014 tell a different story.
While the data from 64 to 84 support the model of offshoring, the evidence becomes
much more complex during the 1990s and beyond. Although throughout the 1990s, the
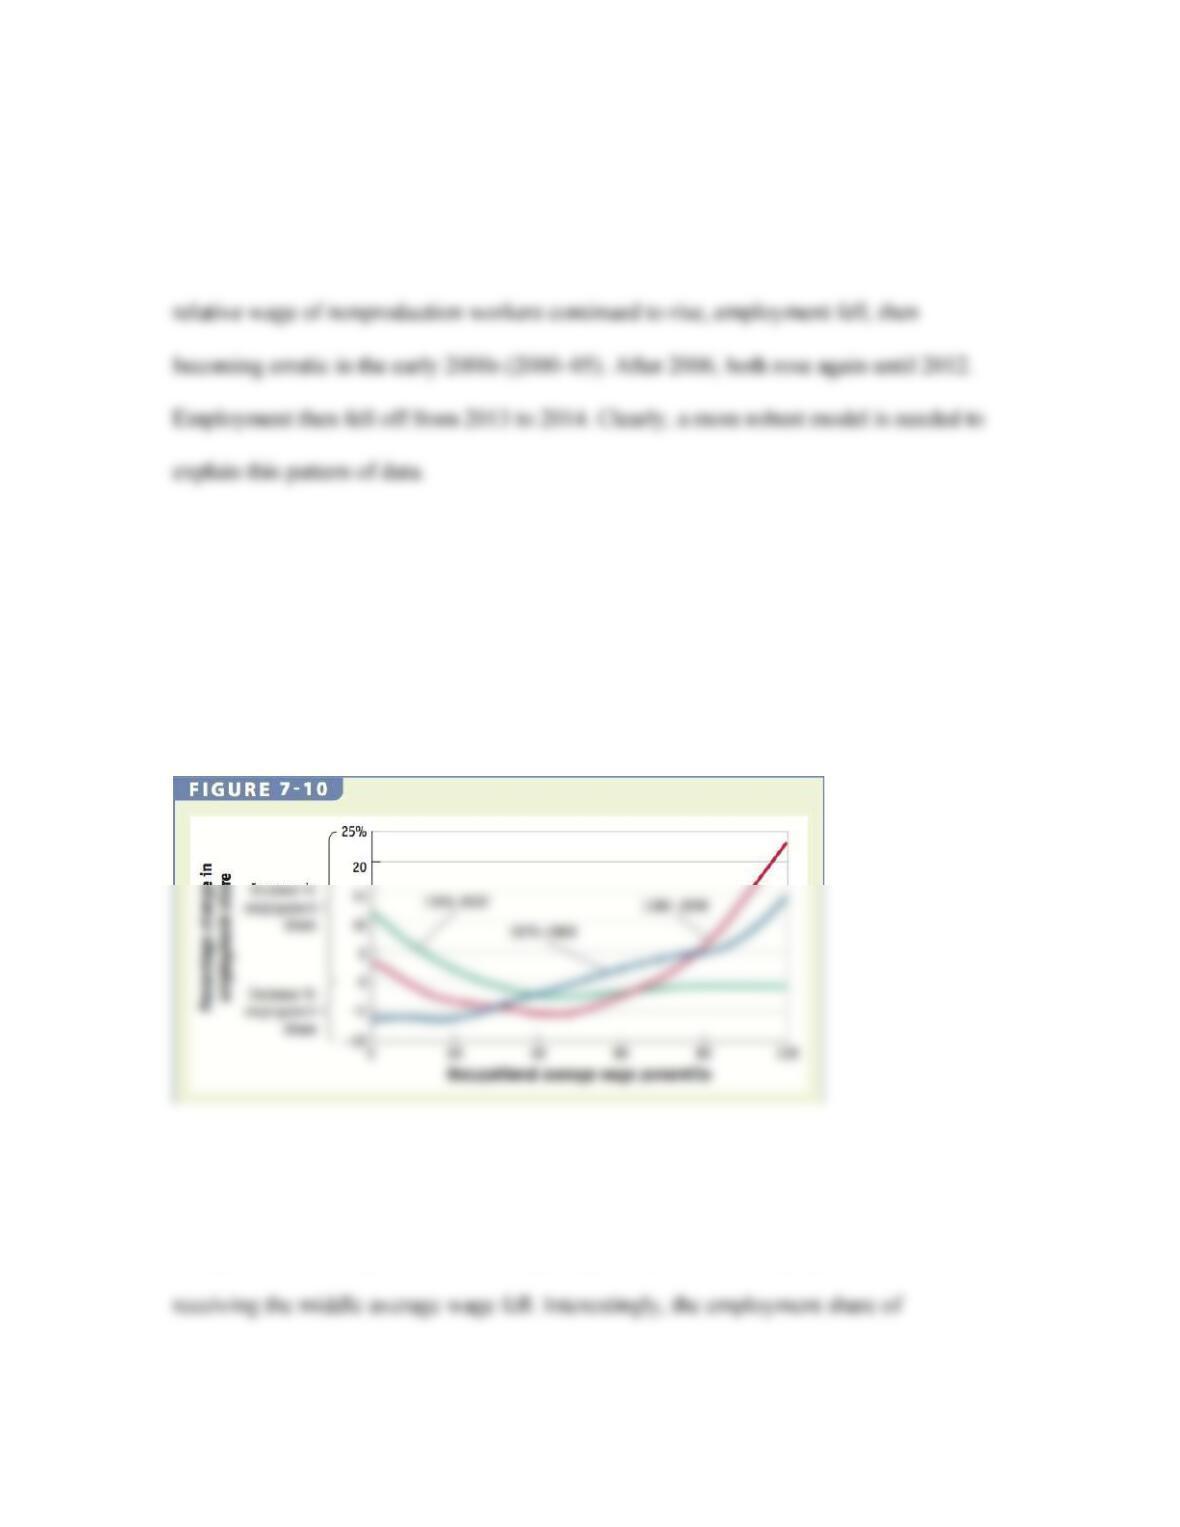
Average Wages in Occupations Figure 7-10 informs us that the data during the period
1979‒89 match our theory quite well. High-skilled occupations with higher average
wages increased over this decade.
But, in 1989‒99 as well as 1999‒2007, we find that the employment share for those
occupations receiving the lowest average wage rose, while the employment share of those

17
This pattern describes what economists call job polarization. Job polarization describes
an economy where the share of employment for jobs receiving the lowest pay increases,
the share of jobs for middle income falls, and the employment share of jobs for the
Taking Account of New Job Characteristics We need a more robust model that
addresses the detailed characteristics of the actual work engaged by labor. Specifically,
we will categorize job characteristics into four categories based on the type of work
performed:
1. Routine, manual
2. Nonroutine manual
3. Routine, cognitive
4. Nonroutine, cognitive
18
Routine jobs are characterized by well-defined rules and procedures. These types of jobs
are more easily replaced by computers and high-tech equipment. Routine jobs can be
both manual (production: assembly line) and cognitive (nonproduction: bookkeepers,
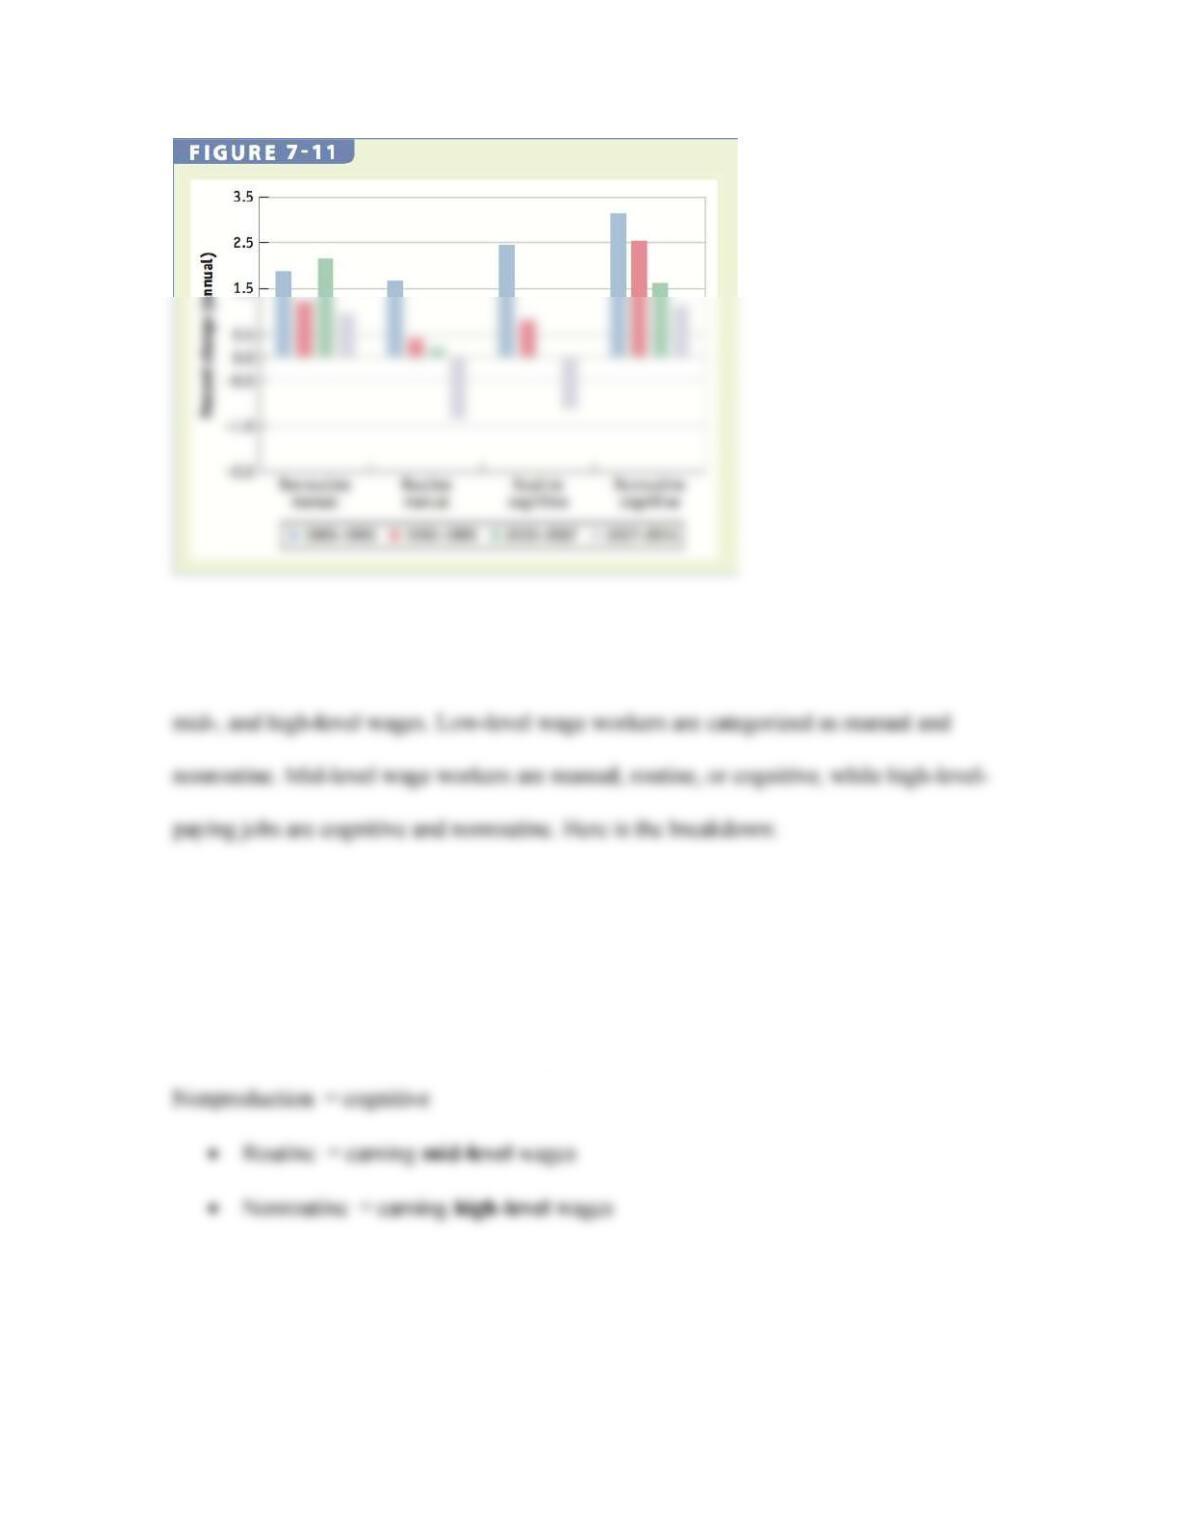
Figure 7-11 shows the growth in the four types of employment for the periods 1983‒93,
1990‒99, 2000‒07, and 2007‒14.
19
The data are much easier to understand if we first label the categories according to low-,
Production = manual
• Nonroutine = earning low-level wages
• Routine = earning mid-level wages
The greatest employment growth occurred in nonroutine occupations earning high- and

20
This trend is more pronounced in the early 2000s, where there is little to no growth at all
in routine jobs earning mid-level wages. But, both types of nonroutine jobs experienced
employment growth that is in the low- and high-level wage categories. Interestingly, the
data reveal that throughout the decades, higher-paying jobs experienced the highest
employment growth.
Now let’s look at where the lowest employment growth occurred. During the 1980s, both
types of manual jobs—routine and nonroutine—experienced the lowest employment
growth. This occurred among the low- and mid-level wage groups. In the 1990s,


