115
rkets
WHAT’S NEW IN THE EIGHTH EDITION:
There is a new
Ask the Experts
feature on “Supplying Kidneys.”
LEARNING OBJECTIVES:
By the end of this chapter, students should understand:
➢ the link between buyers’ willingness to pay for a good and the demand curve.
➢ how to define and measure consumer surplus.
➢ the link between sellers’ costs of producing a good and the supply curve.
➢ how to define and measure producer surplus.
➢ that the equilibrium of supply and demand maximizes total surplus in a market.
CONTEXT AND PURPOSE:
Chapter 7 is the first chapter in a three-chapter sequence on welfare economics and market efficiency.
Chapter 7 employs the supply and demand model to develop consumer surplus and producer surplus as a
measure of welfare and market efficiency. These concepts are used in Chapters 8 and 9 to determine the
winners and losers from taxation and restrictions on international trade.
The purpose of Chapter 7 is to develop
welfare economics
—the study of how the allocation of
resources affects economic well-being. Chapters 4 through 6 employed supply and demand in a positive
KEY POINTS:
• Consumer surplus equals buyers’ willingness to pay for a good minus the amount they actually pay,
and it measures the benefit buyers get from participating in a market. Consumer surplus can be
computed by finding the area below the demand curve and above the price.
7
CONSUMERS, PRODUCERS, AND
THE EFFICIENCY OF MARKETS
116 ❖ Chapter 7/Consumers, Producers, and the Efficiency of Markets
• Producer surplus equals the amount sellers receive for their goods minus their costs of production,
and it measures the benefit sellers get from participating in a market. Producer surplus can be
computed by finding the area below the price and above the supply curve.
CHAPTER OUTLINE:
I. Definition of welfare economics: the study of how the allocation of resources affects
economic well-being.
II. Consumer Surplus
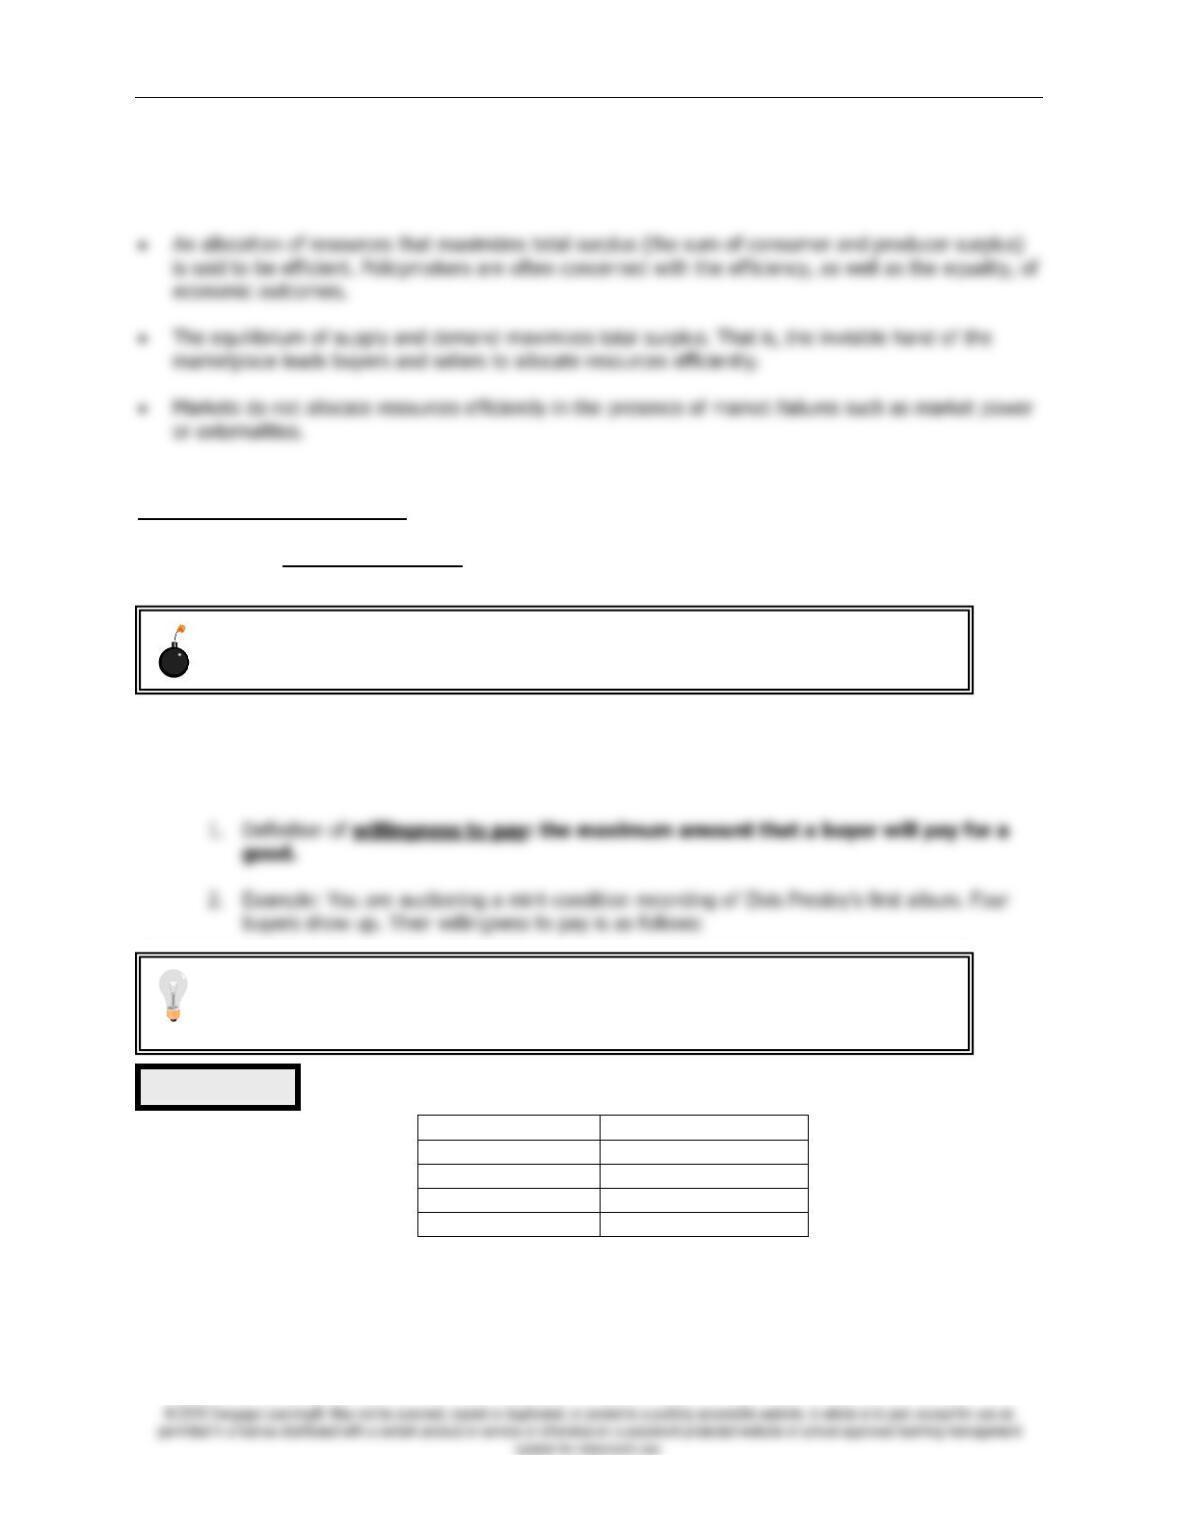
A. Willingness to Pay
Buyer
Willingness to Pay
Taylor
$100
Carrie
$80
Rihanna
$70
Gaga
$50
If the bidding goes to slightly higher than $80, all buyers drop out except for Taylor. Because
Taylor is willing to pay more than she has to for the album, she derives some benefit from
participating in the market.
Table 1
Students often are confused by the use of the word “welfare.” Remind them that we
are talking about social well-being and not public assistance.
Students will understand consumer surplus if you take the time to work through the
Elvis Presley example. If you start with this simple example, students will have no
trouble understanding how to find consumer surplus on a graph.

Chapter 7/Consumers, Producers, and the Efficiency of Markets ❖ 117
3. Definition of consumer surplus: the amount a buyer is willing to pay for a good
minus the amount the buyer actually pays for it.
4. Note that if you had more than one copy of the album, the price in the auction would end up
being lower (a little over $70 in the case of two albums) and both Taylor and Carrie would
gain consumer surplus.
Activity 1—Value of a Time Machine
Type: In-class demonstration
Topics: Consumer surplus
Materials needed: None
Time: 10 minutes
Class limitations: Works in any size class
Purpose
Consumer surplus can be a hard concept for students because it is based on avoided expense
rather than on money that is actually exchanged. This example puts a specific dollar value on
consumer surplus.
Instructions
Tell the class, “A new technology has been developed that allows individuals to travel
backward or forward in time. We want to identify the value this time machine provides to
consumers. Let’s assume the four consumers who most desire this product are in this class.”
this class period.”
On the board write:
Scott $3,000
Carol $2,500
Steve $800
Jeanne $200
118 ❖ Chapter 7/Consumers, Producers, and the Efficiency of Markets
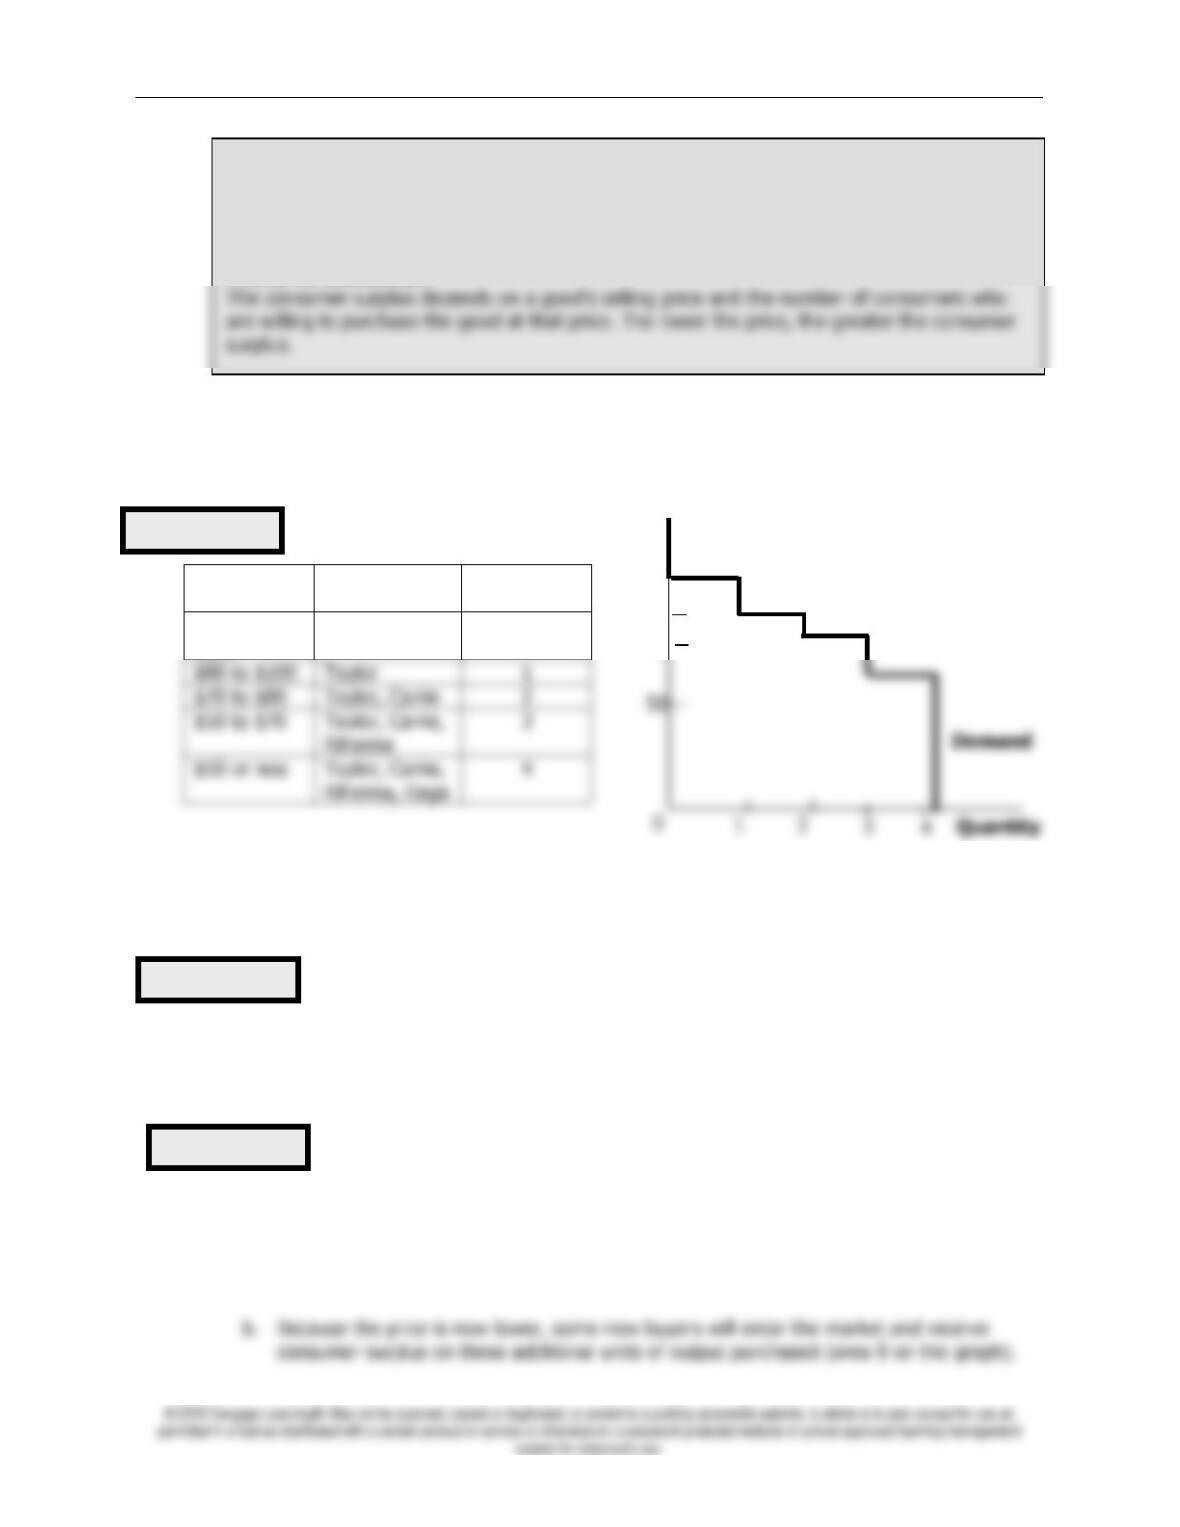
B. Using the Demand Curve to Measure Consumer Surplus
1. We can use the information on willingness to pay to derive a demand curve for the rare Elvis
Presley album.
Price
Buyers
Quantity
Demanded
More than
$100
None
0
Quantity
50
2. At any given quantity, the price given by the demand curve reflects the willingness to pay of
the
marginal buyer
. Because the demand curve shows the buyers’ willingness to pay, we can
use the demand curve to measure consumer surplus.
3. Consumer surplus can be measured as the area below the demand curve and above the
price.
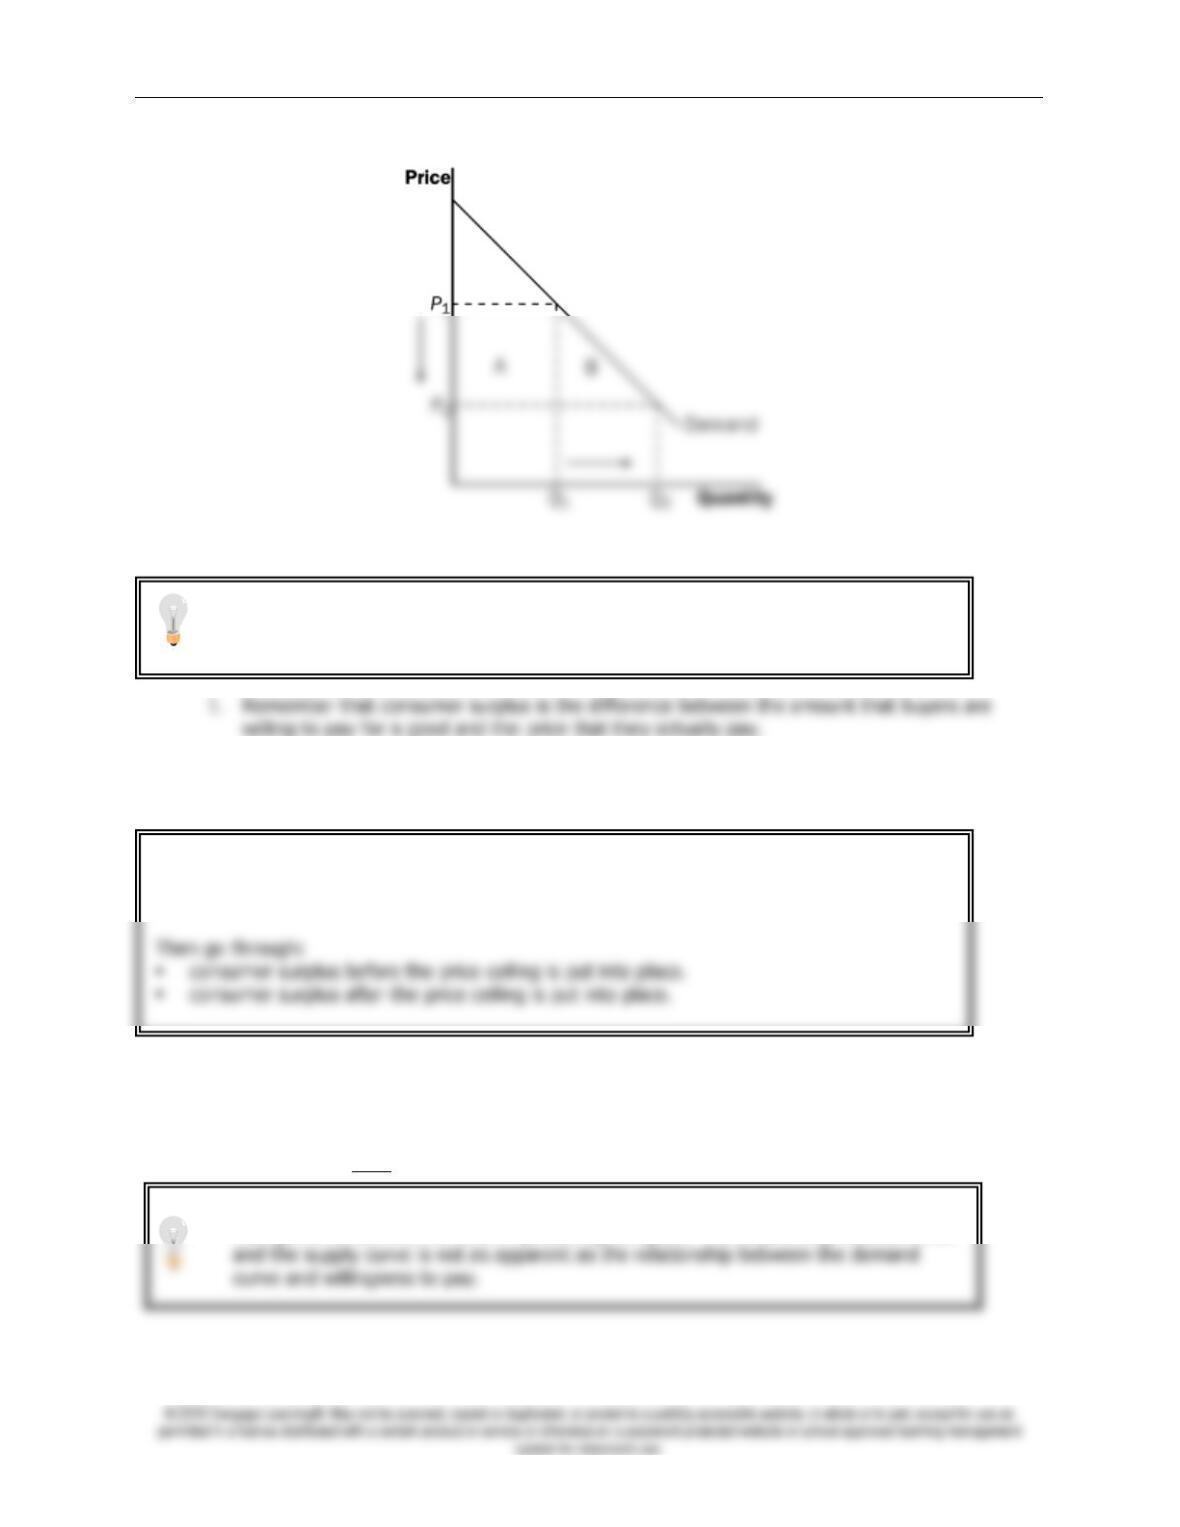
C. How a Lower Price Raises Consumer Surplus
1. As price falls, consumer surplus increases for two reasons.
a. Those already buying the product will receive additional consumer surplus because they
are paying less for the product than before (area A on the graph).
Figure 1
Figure 2
Figure 3
“We can calculate the consumer surplus of three trips. Scott would pay $3,000 but only pays
$500, leaving $2,500 of net benefits.” (Put these numbers on the board.) “Carol has net
benefits of $2,000. Steve has $300 in net benefits. Adding up these net savings gives $4,800
in consumer surplus.”
Points for Discussion
80
Price of
Album
100
70
Chapter 7/Consumers, Producers, and the Efficiency of Markets ❖ 119
D. What Does Consumer Surplus Measure?
2. Thus, it measures the benefit that consumers receive from the good as the buyers
themselves perceive it.
III. Producer Surplus
A. Cost and the Willingness to Sell
1. Definition of cost: the value of everything a seller must give up to produce a good.
ALTERNATIVE CLASSROOM EXAMPLE:
Review the material on price ceilings from Chapter 6. Redraw the market for two-bedroom
apartments in your town. Draw in a price ceiling below the equilibrium price.
You will need to take some time to explain the relationship between the producers’
willingness to sell and the cost of producing the good. The relationship between cost
It is important to stress that consumer surplus is measured in monetary terms.
Consumer surplus gives us a way to place a monetary cost on inefficient market
outcomes (due to government involvement or market failure).
120 ❖ Chapter 7/Consumers, Producers, and the Efficiency of Markets
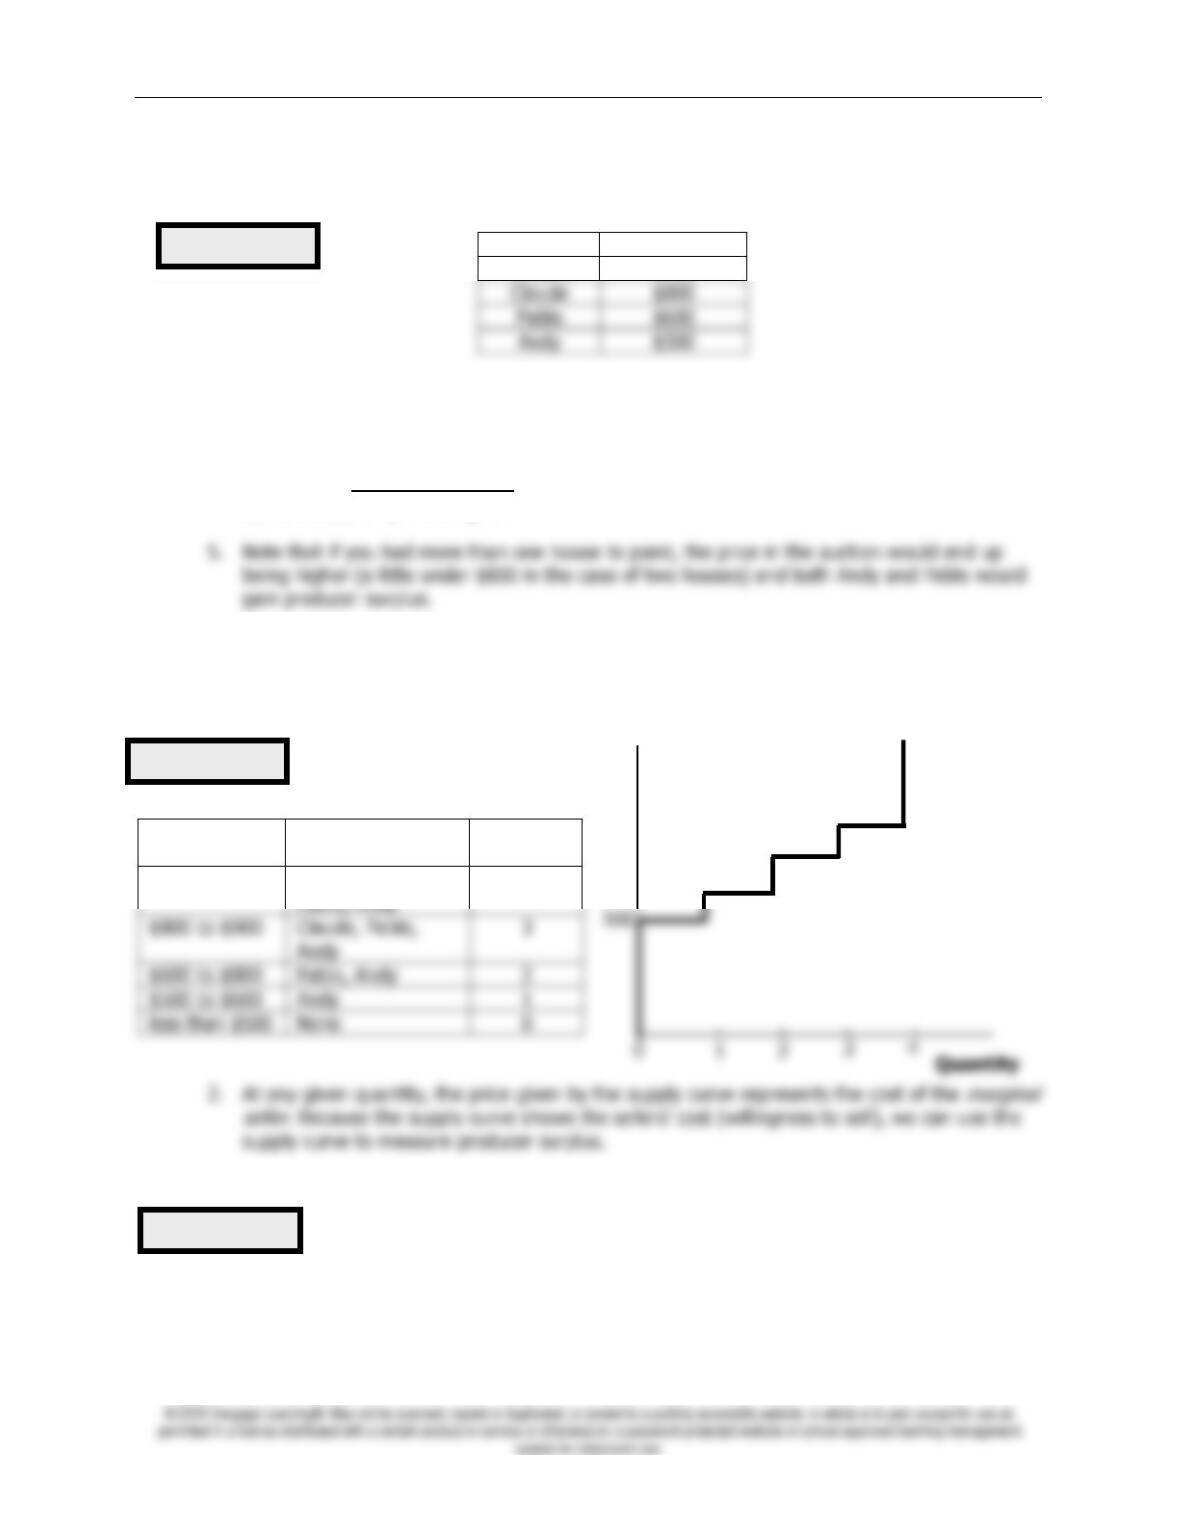
2. Example: You want to hire someone to paint your house. You accept bids for the work from
four sellers. Each painter is willing to work if the price you will pay exceeds her opportunity
cost. (Note that this opportunity cost thus represents willingness to sell.) The costs are:
Seller
Cost
Vincent
$900
$800
$600
$500
3. Bidding will stop when the price gets to be slightly below $600. All sellers will drop out except
for Andy. Because Andy receives more than he would require to paint the house, he derives
some benefit from producing in the market.
4. Definition of producer surplus: the amount a seller is paid for a good minus the
seller’s cost of providing it.
B. Using the Supply Curve to Measure Producer Surplus
1. We can use the information on cost (willingness to sell) to derive a supply curve for house
painting services.
Price
Sellers
Quantity
Supplied
$900 or more
$800 to $900
Claude, Pablo,
3
500
Quantity
Vincent, Claude,
4
3. Producer surplus can be measured as the area above the supply curve and below the price.
Table 2
Figure 4
Figure 5
Price of
House
Painting
900
800
600
Supply
Chapter 7/Consumers, Producers, and the Efficiency of Markets ❖ 121
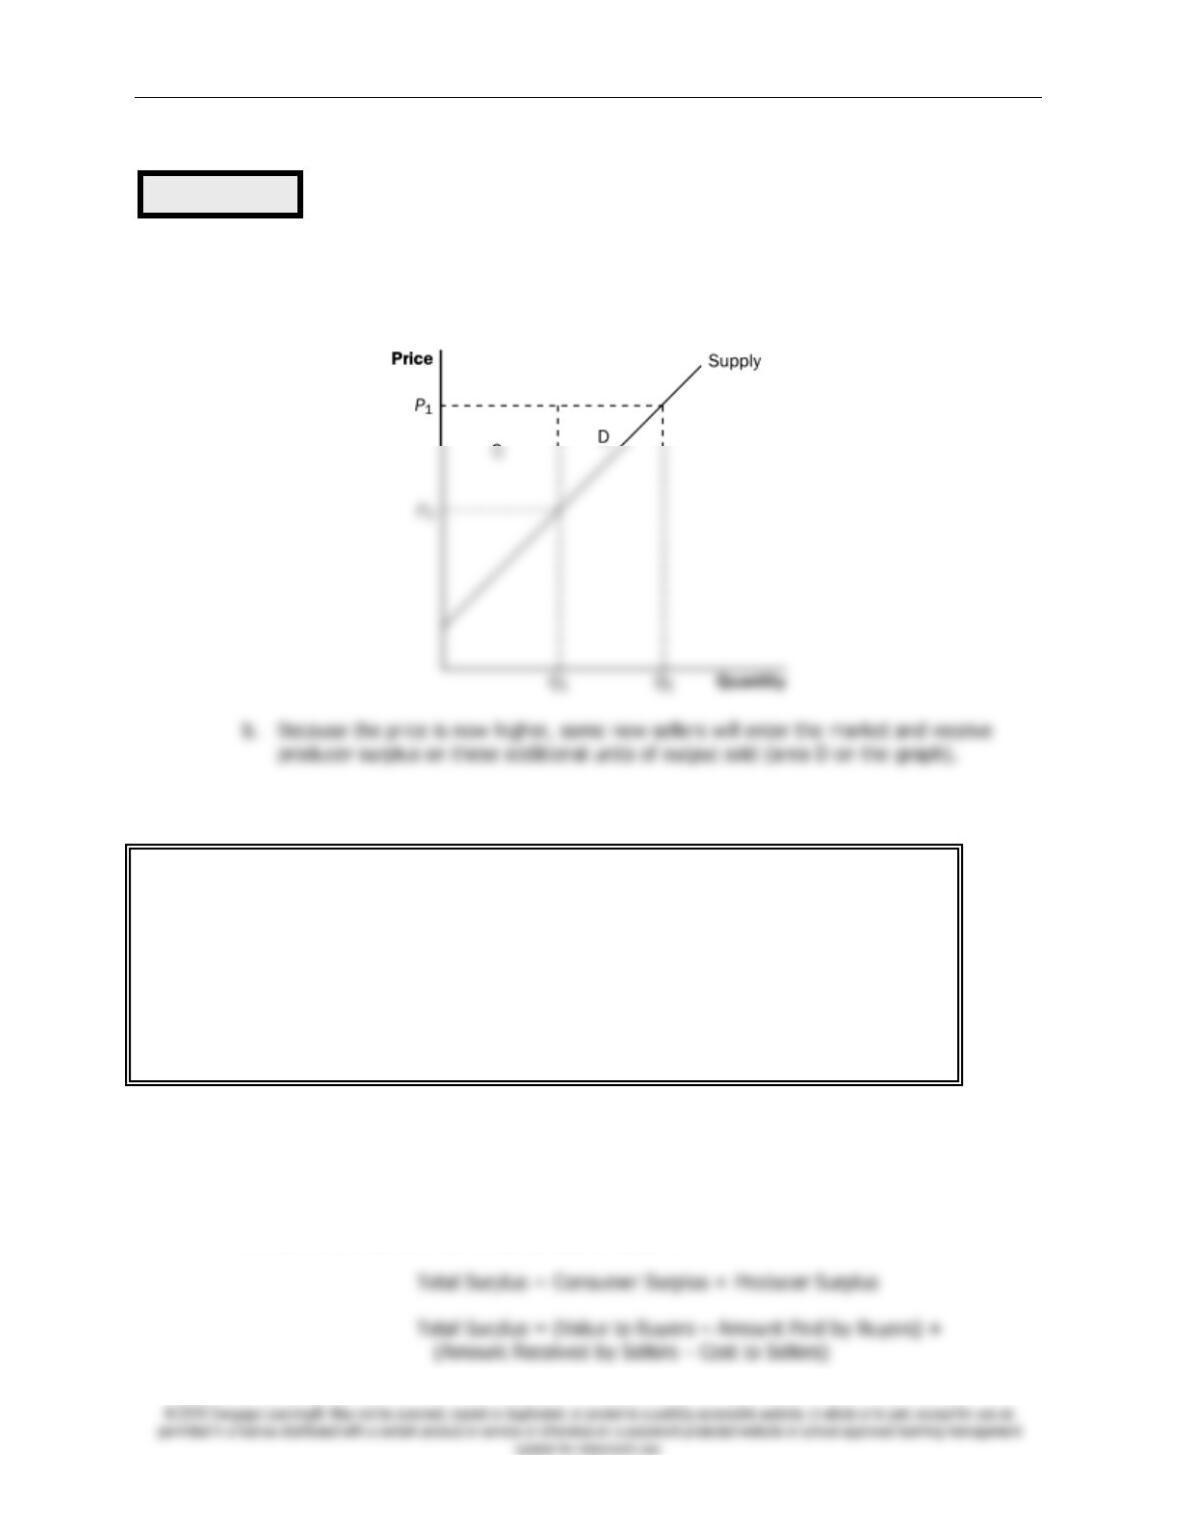
C. How a Higher Price Raises Producer Surplus
1. As price rises, producer surplus increases for two reasons.
a. Those already selling the product will receive additional producer surplus because they
are receiving more for the product than before (area C on the graph).
D. Producer surplus is used to measure the economic well-being of producers, much like consumer
surplus is used to measure the economic well-being of consumers.
IV. Market Efficiency
A. The Benevolent Social Planner
1. The economic well-being of everyone in society can be measured by total surplus, which is
the sum of consumer surplus and producer surplus:
Figure 6
ALTERNATIVE CLASSROOM EXAMPLE:
Review the material on price floors from Chapter 6. Redraw the market for an agricultural
product such as corn. Draw in a price support above the equilibrium price.
Then go through:
▪ producer surplus before the price support is put in place.
▪ producer surplus after the price support is put in place.
Make sure that you discuss the cost of the price support to taxpayers.
122 ❖ Chapter 7/Consumers, Producers, and the Efficiency of Markets
Because the Amount Paid by Buyers = Amount Received by
Sellers:
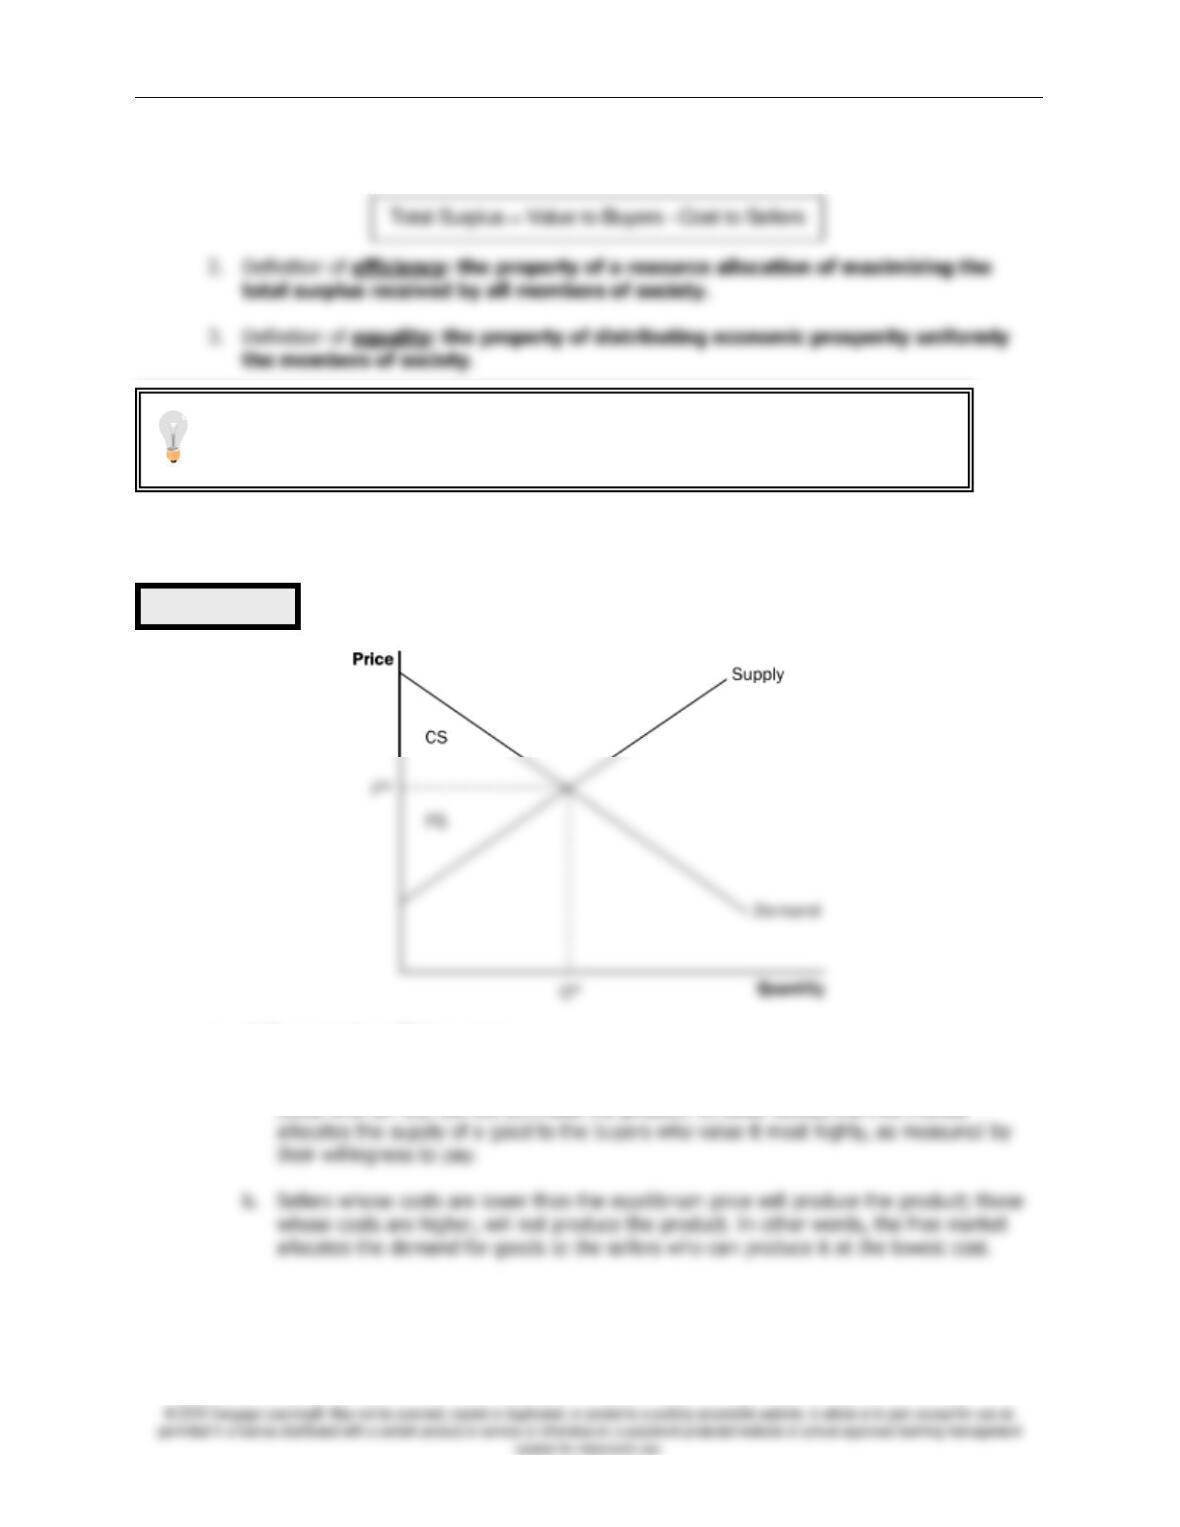
B. Evaluating the Market Equilibrium
1. At the market equilibrium price:
a. Buyers who value the product more than the equilibrium price will purchase the product;
those who do not, will not purchase the product. In other words, the free market
2. Total surplus is maximized at the market equilibrium.
Figure 7
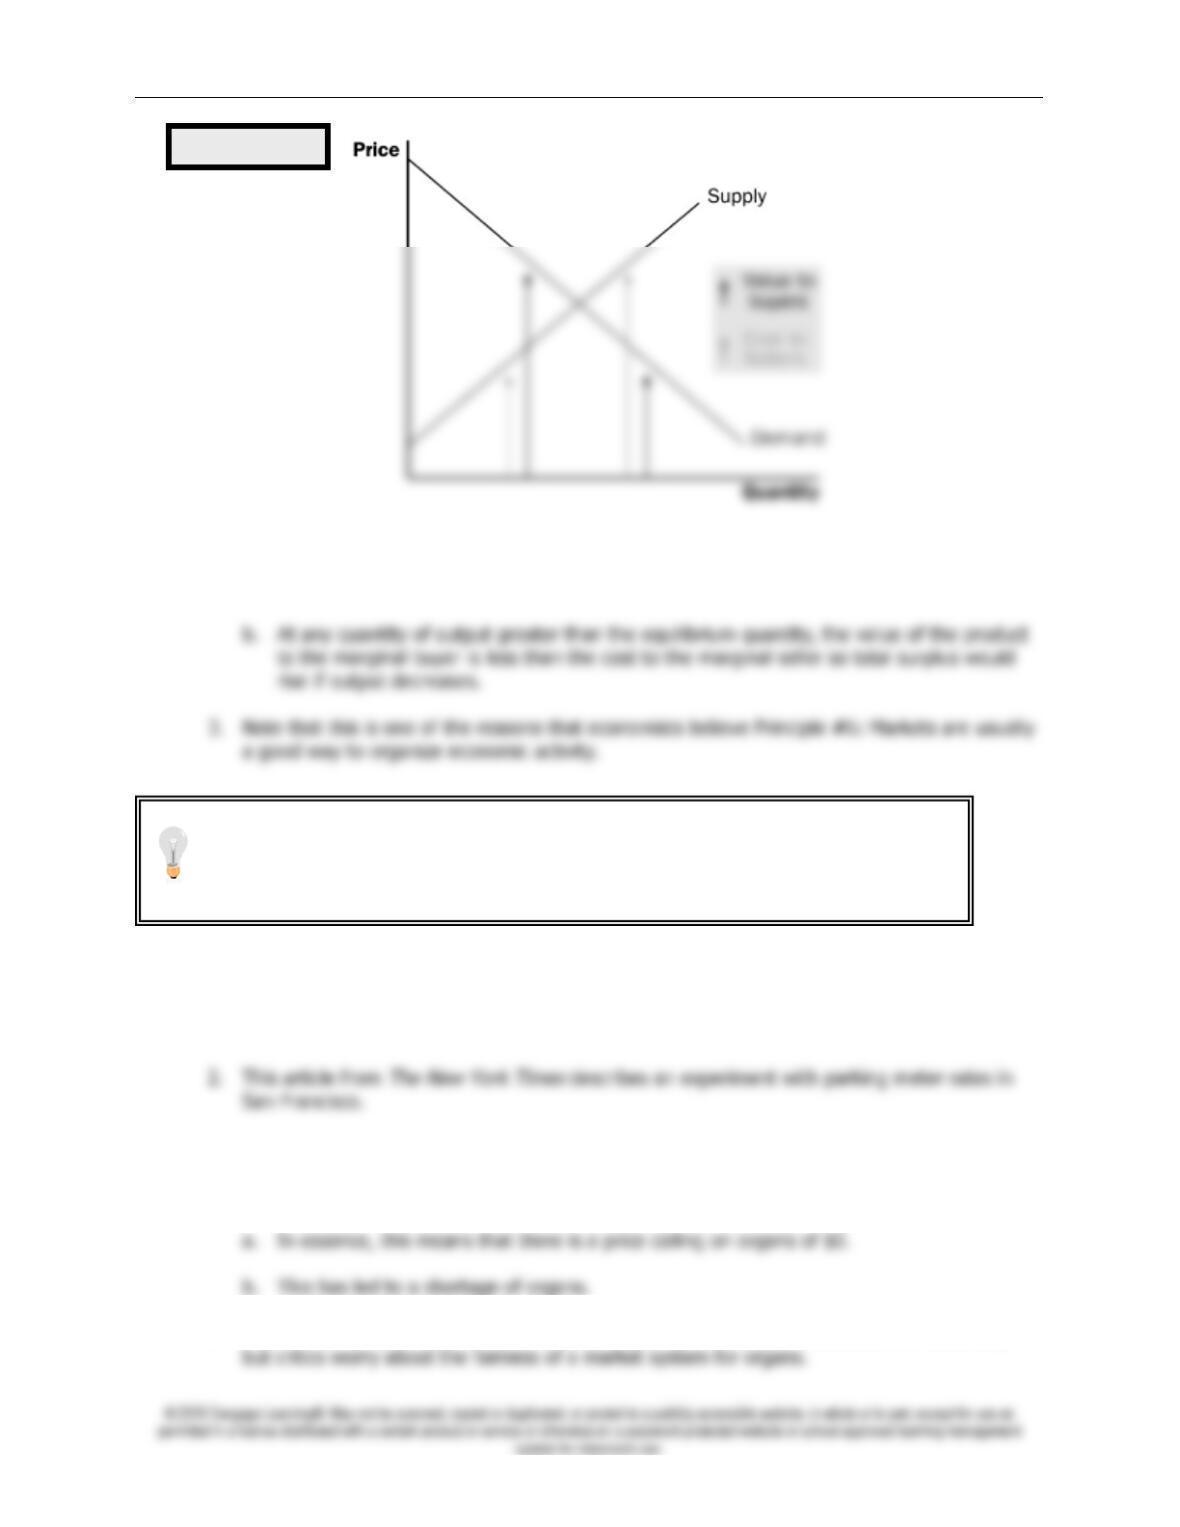
Now might be a good time to point out that many government policies involve a
trade-off between efficiency and equality. When you evaluate government policies,
like price ceilings or floors, you can explain them in terms of equality and efficiency.
Chapter 7/Consumers, Producers, and the Efficiency of Markets ❖ 123
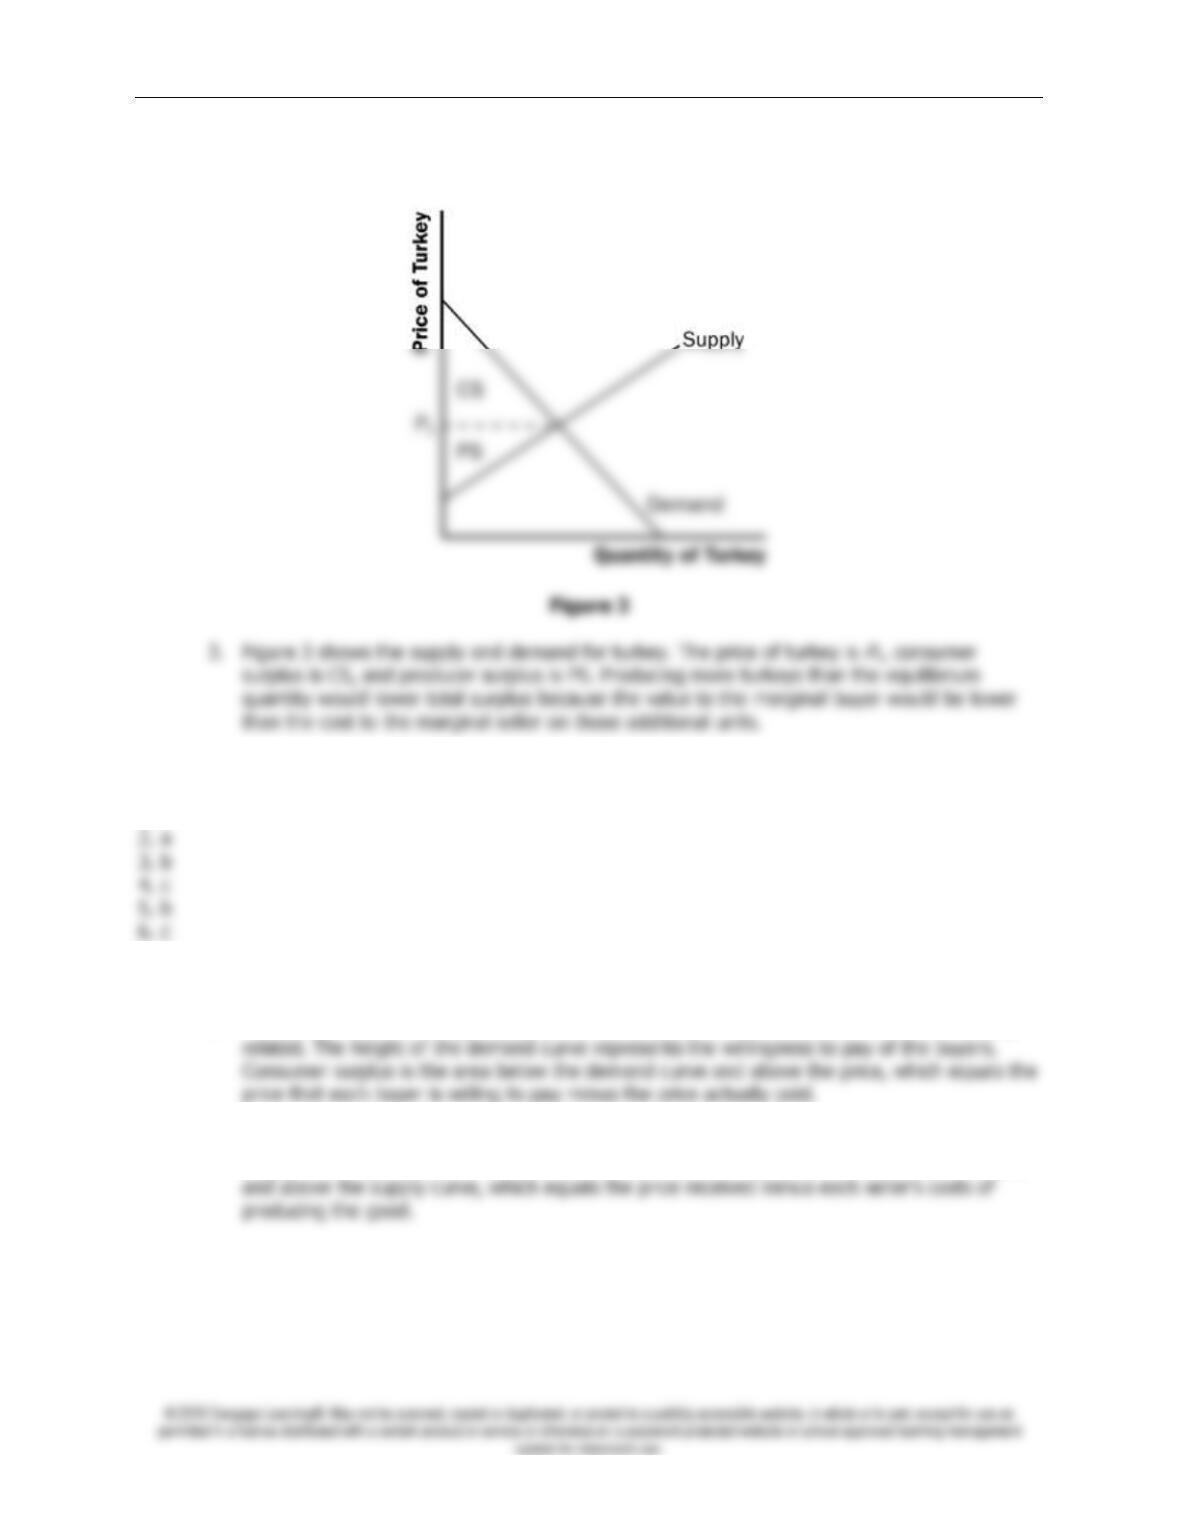
a. At any quantity of output smaller than the equilibrium quantity, the value of the product
to the marginal buyer is greater than the cost to the marginal seller so total surplus
would rise if output increases.
C.
In the News: The Invisible Hand Can Park Your Car
1. Parking spots with meters that have variable rates depending on demand and supply can
result in a more efficient allocation of this scarce resource.
D.
Case Study: Should There Be a Market for Organs?
1. As a matter of public policy, people are not allowed to sell their organs.
2. The creation of a market for organs would lead to a more efficient allocation of resources,
Figure 8
It would be a good idea to remind students that there are circumstances when the
market process does not lead to the most efficient outcome. Examples include
situations such as when a firm (or buyer) has market power over price or when there
are externalities present. These situations will be discussed in later chapters.
124 ❖ Chapter 7/Consumers, Producers, and the Efficiency of Markets
E.
Ask the Experts:
Supplying Kidneys
2. 57 percent of the experts agreed, while 16 percent disagreed and 27 percent were uncertain.
V. Market Efficiency and Market Failure
A. To conclude that markets are efficient, we made several assumptions about how markets
worked.
B. When these assumptions do not hold, the market equilibrium may not be efficient.
C. When markets fail, public policy can potentially remedy the situation.
SOLUTIONS TO TEXT PROBLEMS:
Quick Quizzes
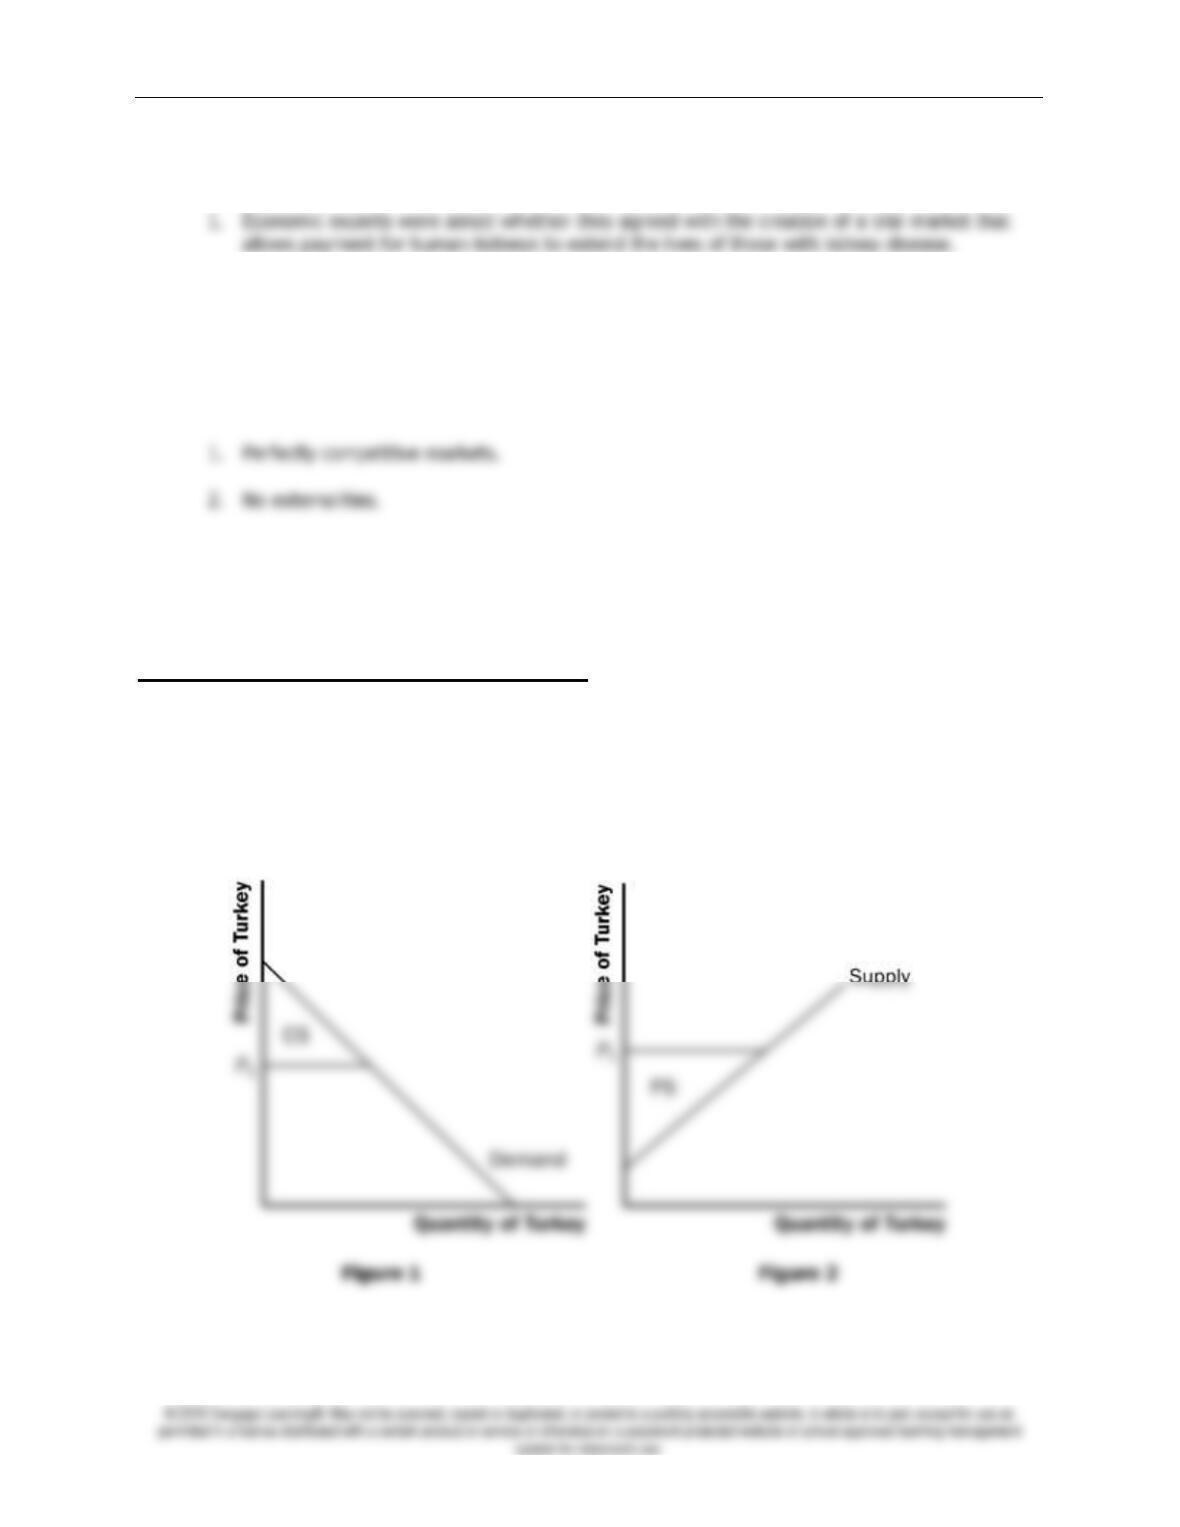
1. Figure 1 shows the demand curve for turkey. The price of turkey is
P
1 and the consumer
surplus that results from that price is denoted CS. Consumer surplus is the amount a buyer is
willing to pay for a good minus the amount the buyer actually pays for it. It measures the
benefit to buyers of participating in a market.
2. Figure 2 shows the supply curve for turkey. The price of turkey is
P
1 and the producer
surplus that results from that price is denoted PS. Producer surplus is the amount sellers are
Chapter 7/Consumers, Producers, and the Efficiency of Markets ❖ 125
paid for a good minus the sellers’ cost of providing it (measured by the supply curve). It
measures the benefit to sellers of participating in a market.
Chapter Quick Quiz
1. a
Questions for Review
1. The price a buyer is willing to pay, consumer surplus, and the demand curve are all closely
2. Sellers’ costs, producer surplus, and the supply curve are all closely related. The height of the
supply curve represents the costs of the sellers. Producer surplus is the area below the price
126 ❖ Chapter 7/Consumers, Producers, and the Efficiency of Markets
Figure 4
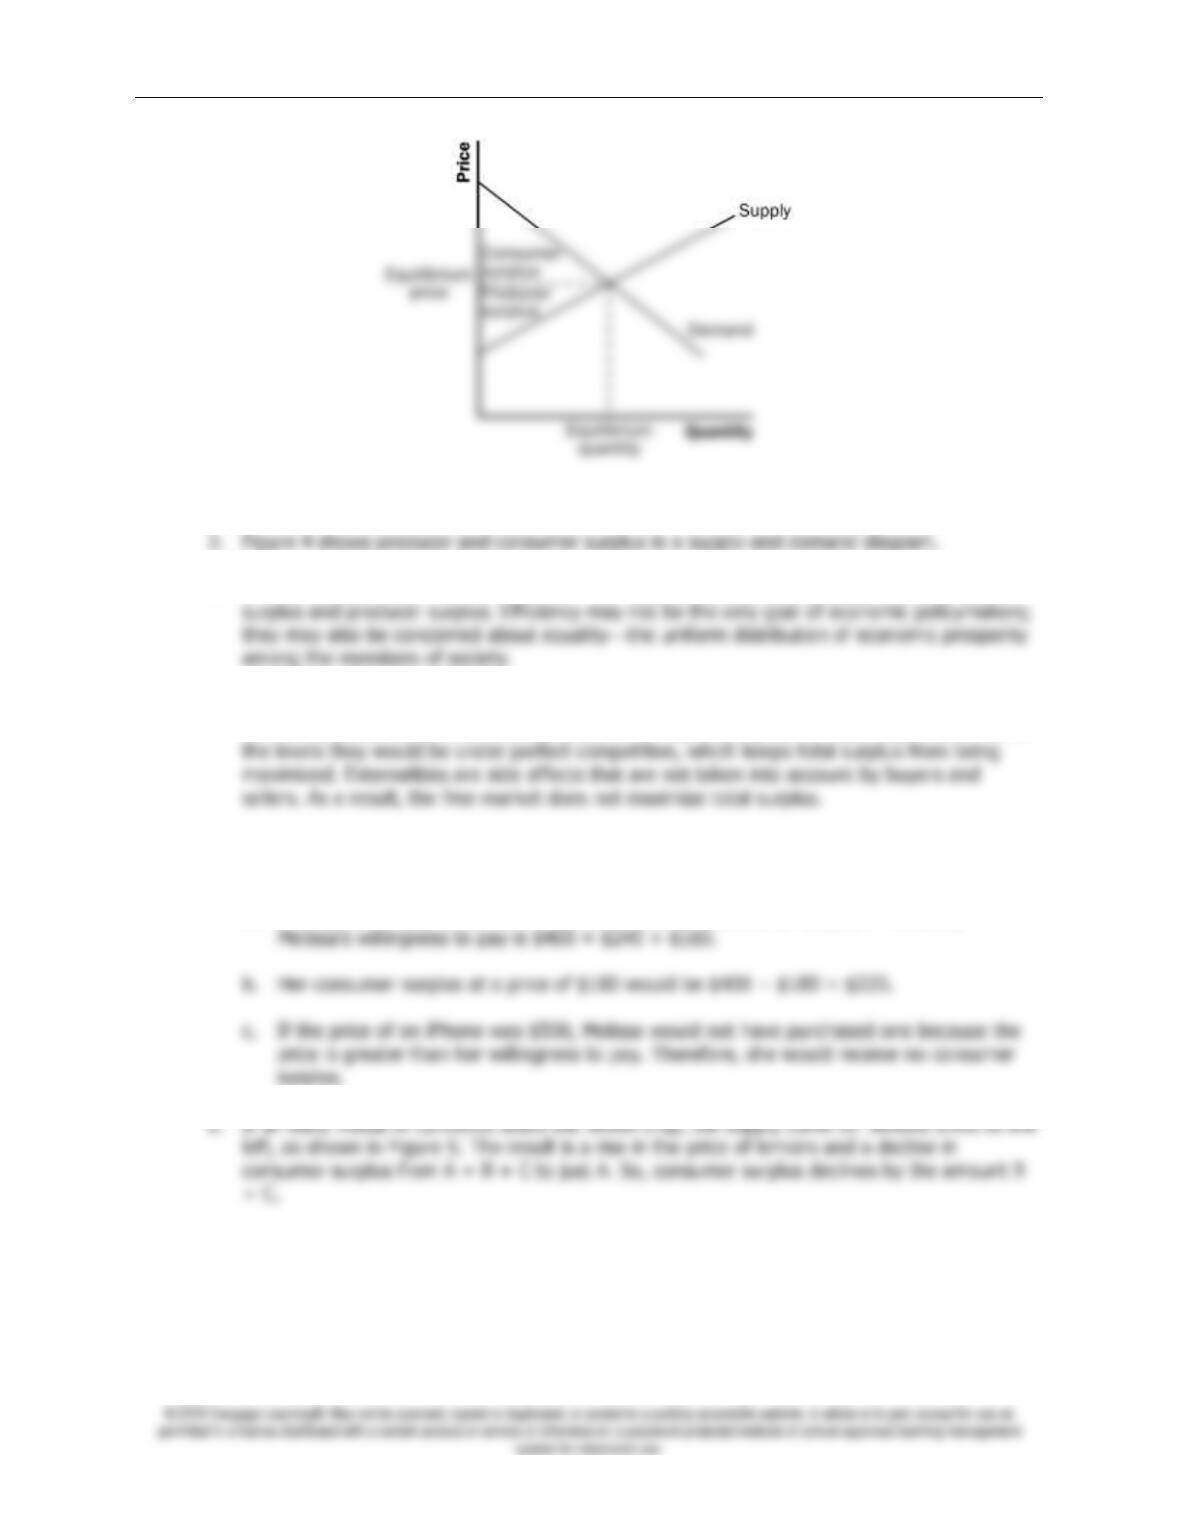
4. An allocation of resources is efficient if it maximizes total surplus, the sum of consumer
5. Two types of market failure are market power and externalities. Market power may cause
market outcomes to be inefficient because firms may cause price and quantity to differ from
Problems and Applications
1.
a. Willingness to pay is the sum of the price paid and consumer surplus. Therefore,
Chapter 7/Consumers, Producers, and the Efficiency of Markets ❖ 127
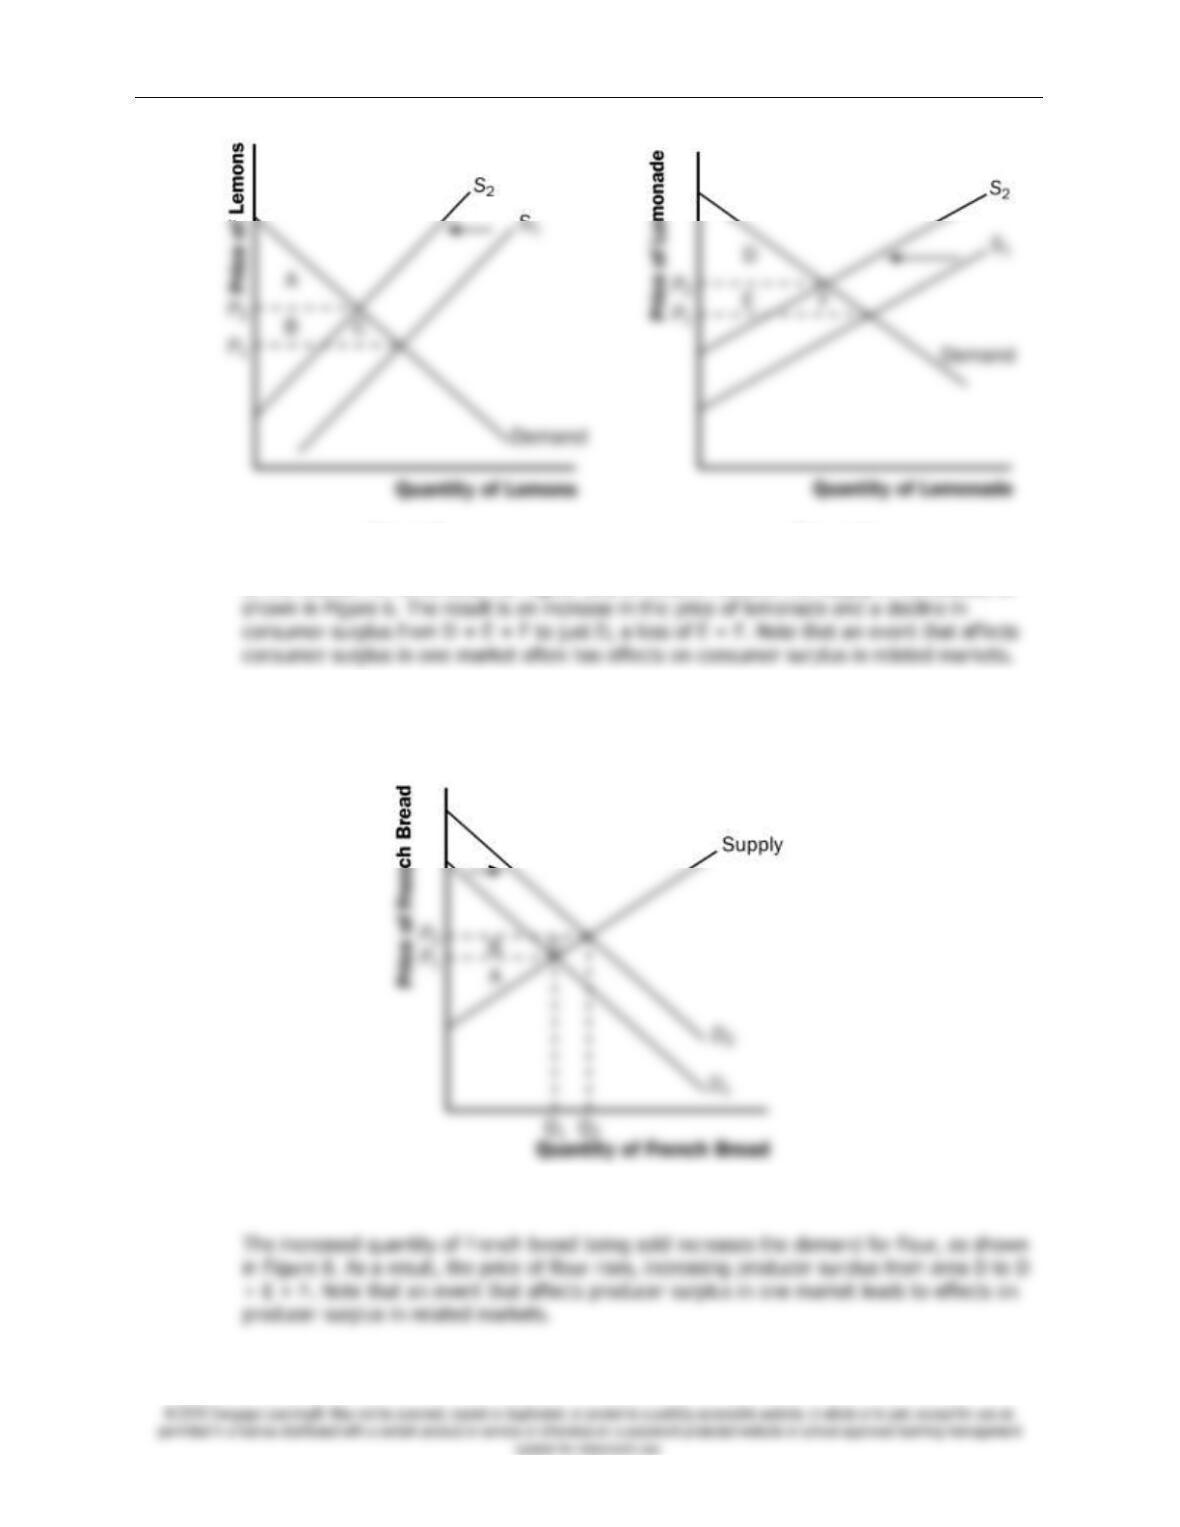
Figure 5 Figure 6
In the market for lemonade, the higher cost of lemons reduces the supply of lemonade, as
3. A rise in the demand for French bread leads to an increase in producer surplus in the market
for French bread, as shown in Figure 7. The shift of the demand curve leads to an increased
price, which increases producer surplus from area A to area A + B + C.
Figure 7
128 ❖ Chapter 7/Consumers, Producers, and the Efficiency of Markets
Figure 8
4. a. Bert’s demand schedule is:
Price
Quantity Demanded
Bert’s demand curve is shown in Figure 9.
Figure 9
Chapter 7/Consumers, Producers, and the Efficiency of Markets ❖ 129
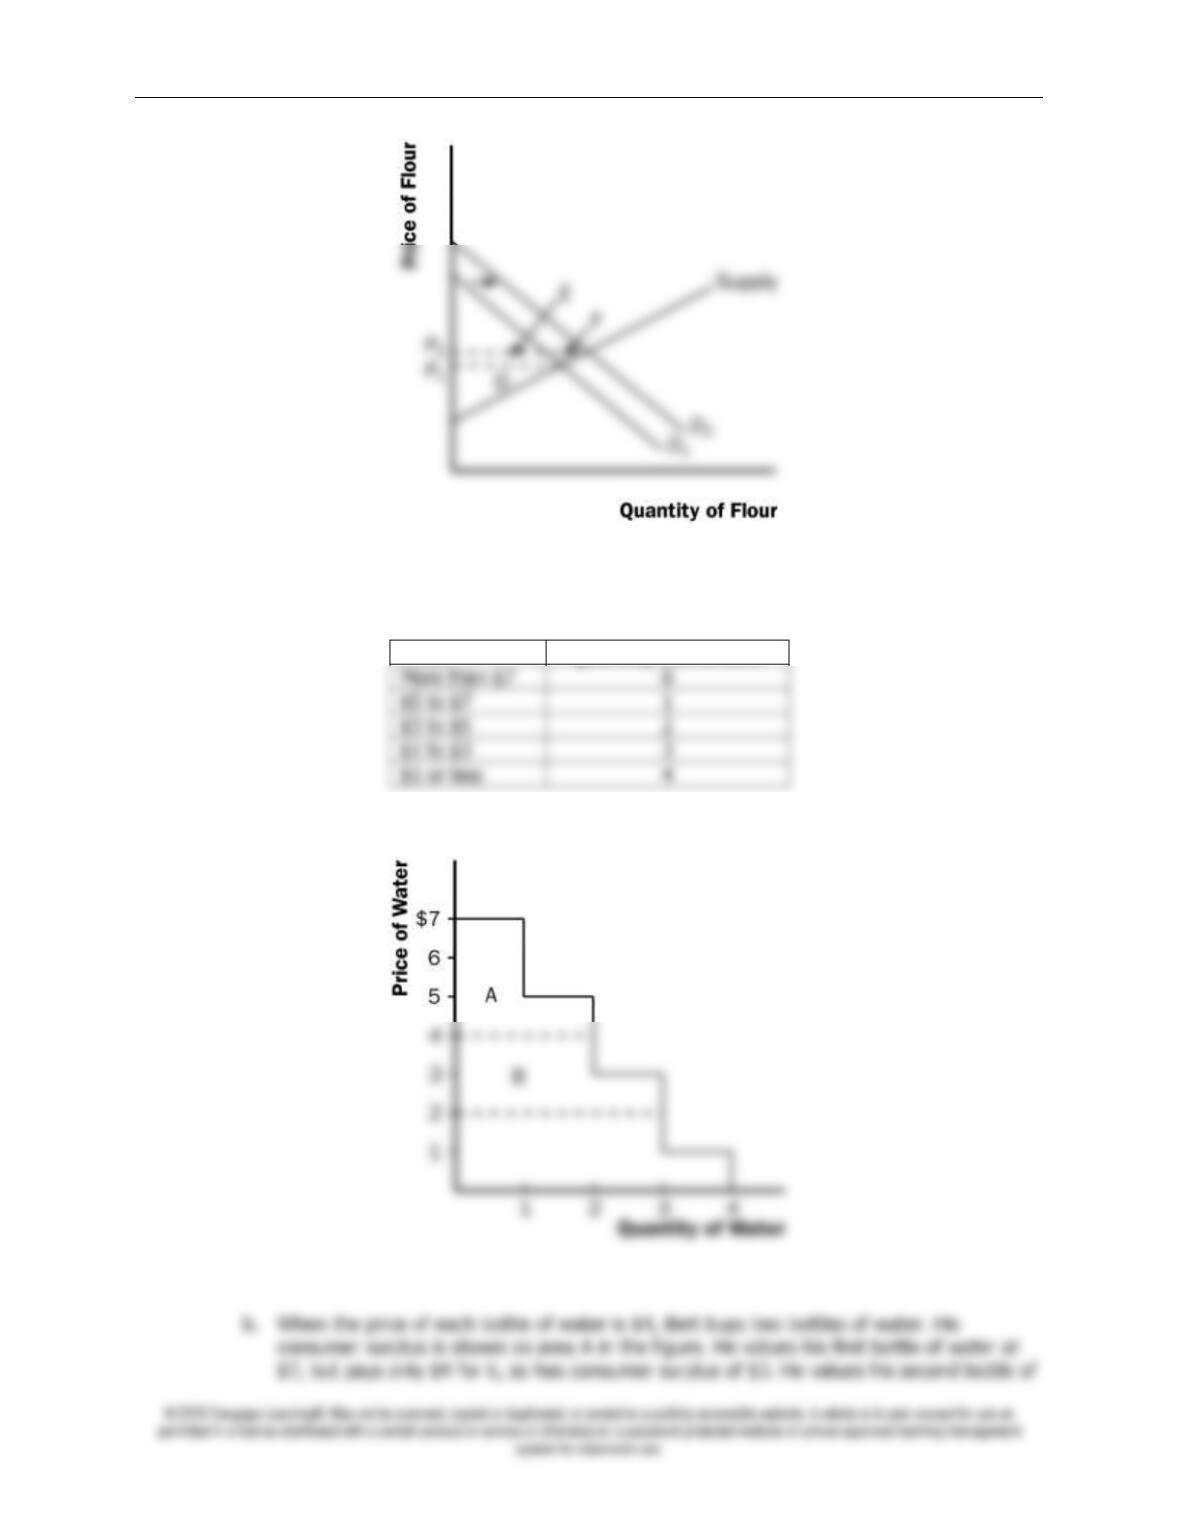
c. When the price of each bottle of water falls from $4 to $2, Bert buys three bottles of
water, an increase of one. His consumer surplus consists of both areas A and B in the
5. a. Ernie’s supply schedule for water is:
Ernie’s supply curve is shown in Figure 10.
Figure 10
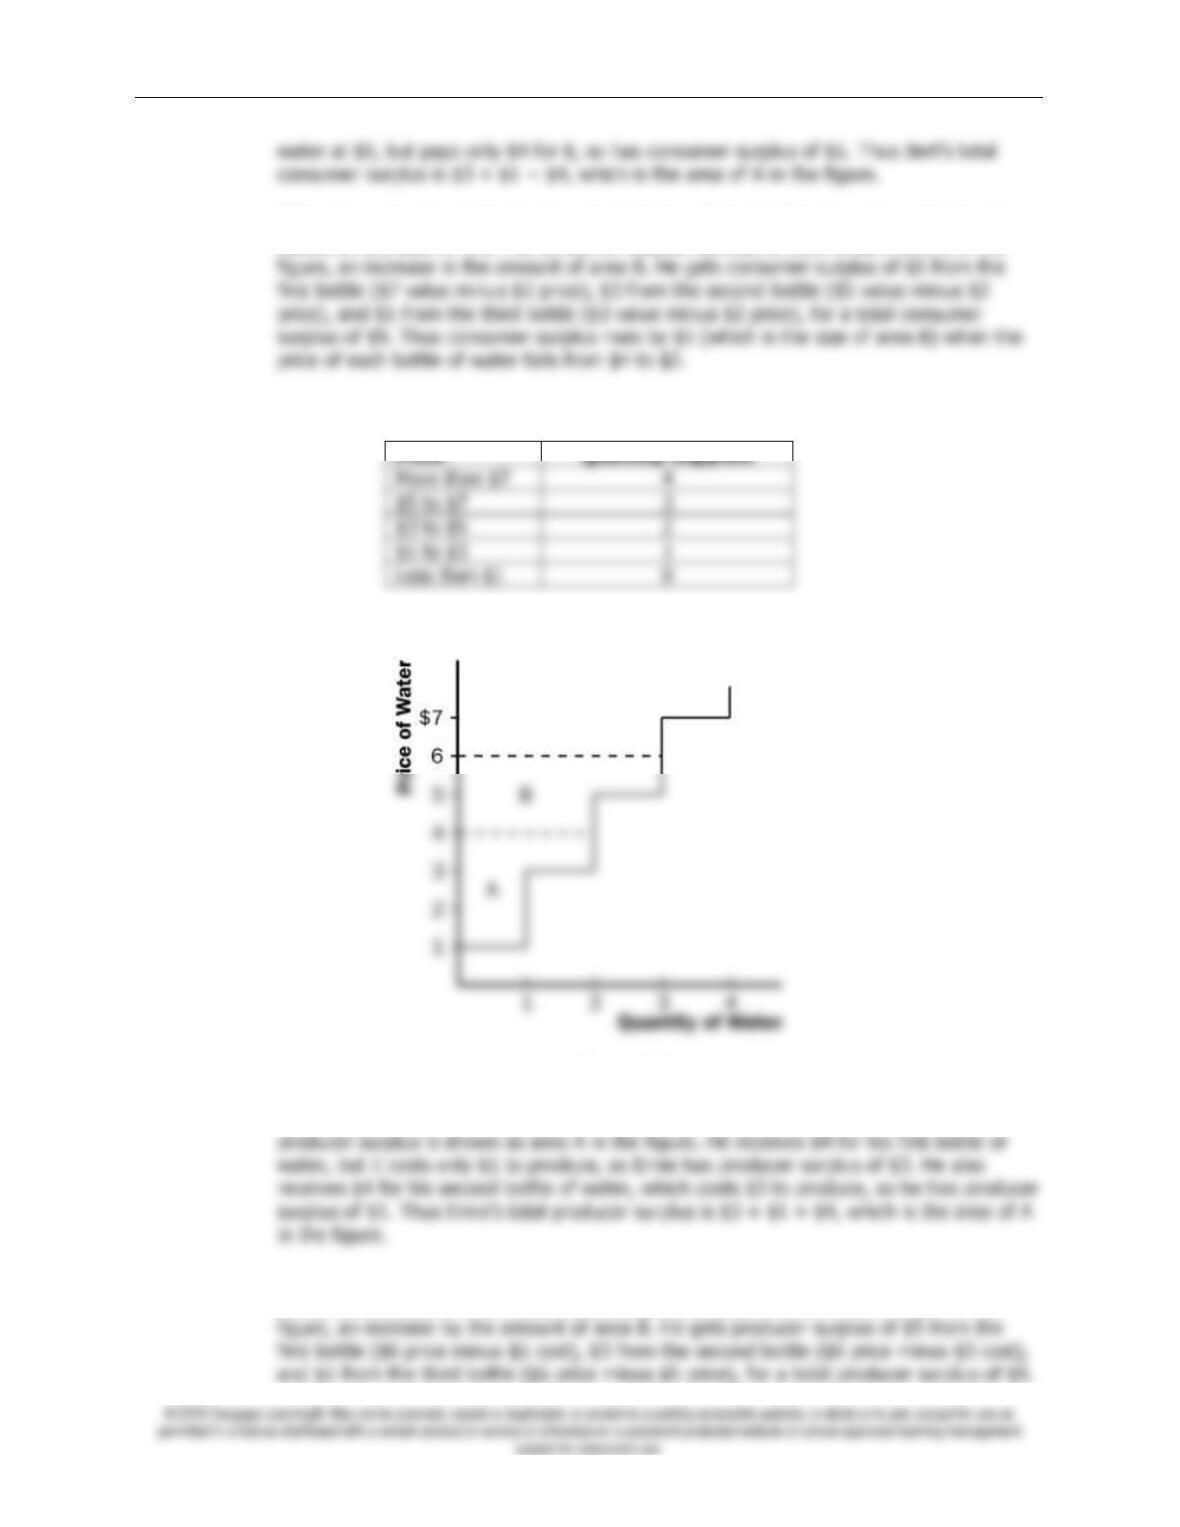
b. When the price of each bottle of water is $4, Ernie sells two bottles of water. His
c. When the price of each bottle of water rises from $4 to $6, Ernie sells three bottles of
water, an increase of one. His producer surplus consists of both areas A and B in the
130 ❖ Chapter 7/Consumers, Producers, and the Efficiency of Markets
6. a. From Ernie’s supply schedule and Bert’s demand schedule, the quantity demanded and
supplied are:
B
b. At a price of $4, consumer surplus is $4 and producer surplus is $4, as shown in
Problems 3 and 4 above. Total surplus is $4 + $4 = $8.
c. If Ernie produced one less bottle, his producer surplus would decline to $3, as shown in
d. If Ernie produced one additional bottle of water, his cost would be $5, but the price is
only $4, so his producer surplus would decline by $1. If Bert consumed one additional
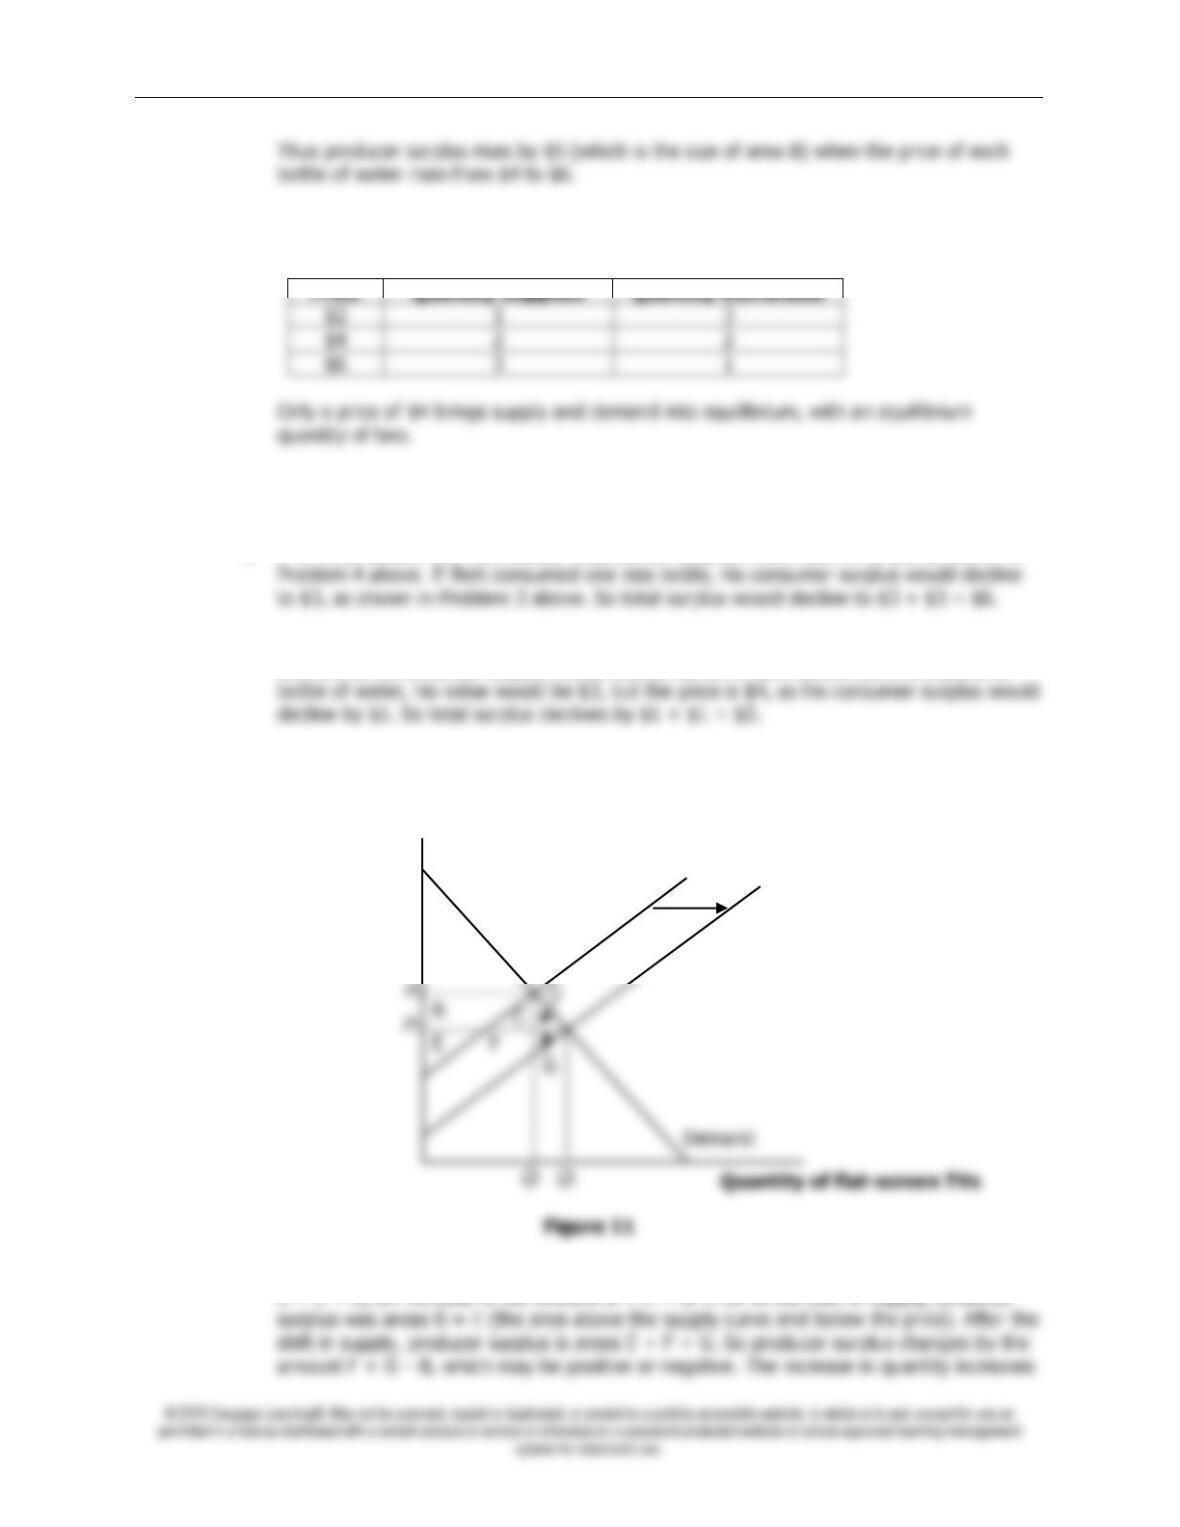
7. a. The effect of falling production costs in the market for flat-screen TVs results in a shift to
the right in the supply curve, as shown in Figure 11. As a result, the equilibrium price of
flat-screen TVs declines and the equilibrium quantity increases.
b. The decline in the price of flat-screen TVs increases consumer surplus from area A to A +
Price of flat-screen
TVs
S2
S1
A
Chapter 7/Consumers, Producers, and the Efficiency of Markets ❖ 131
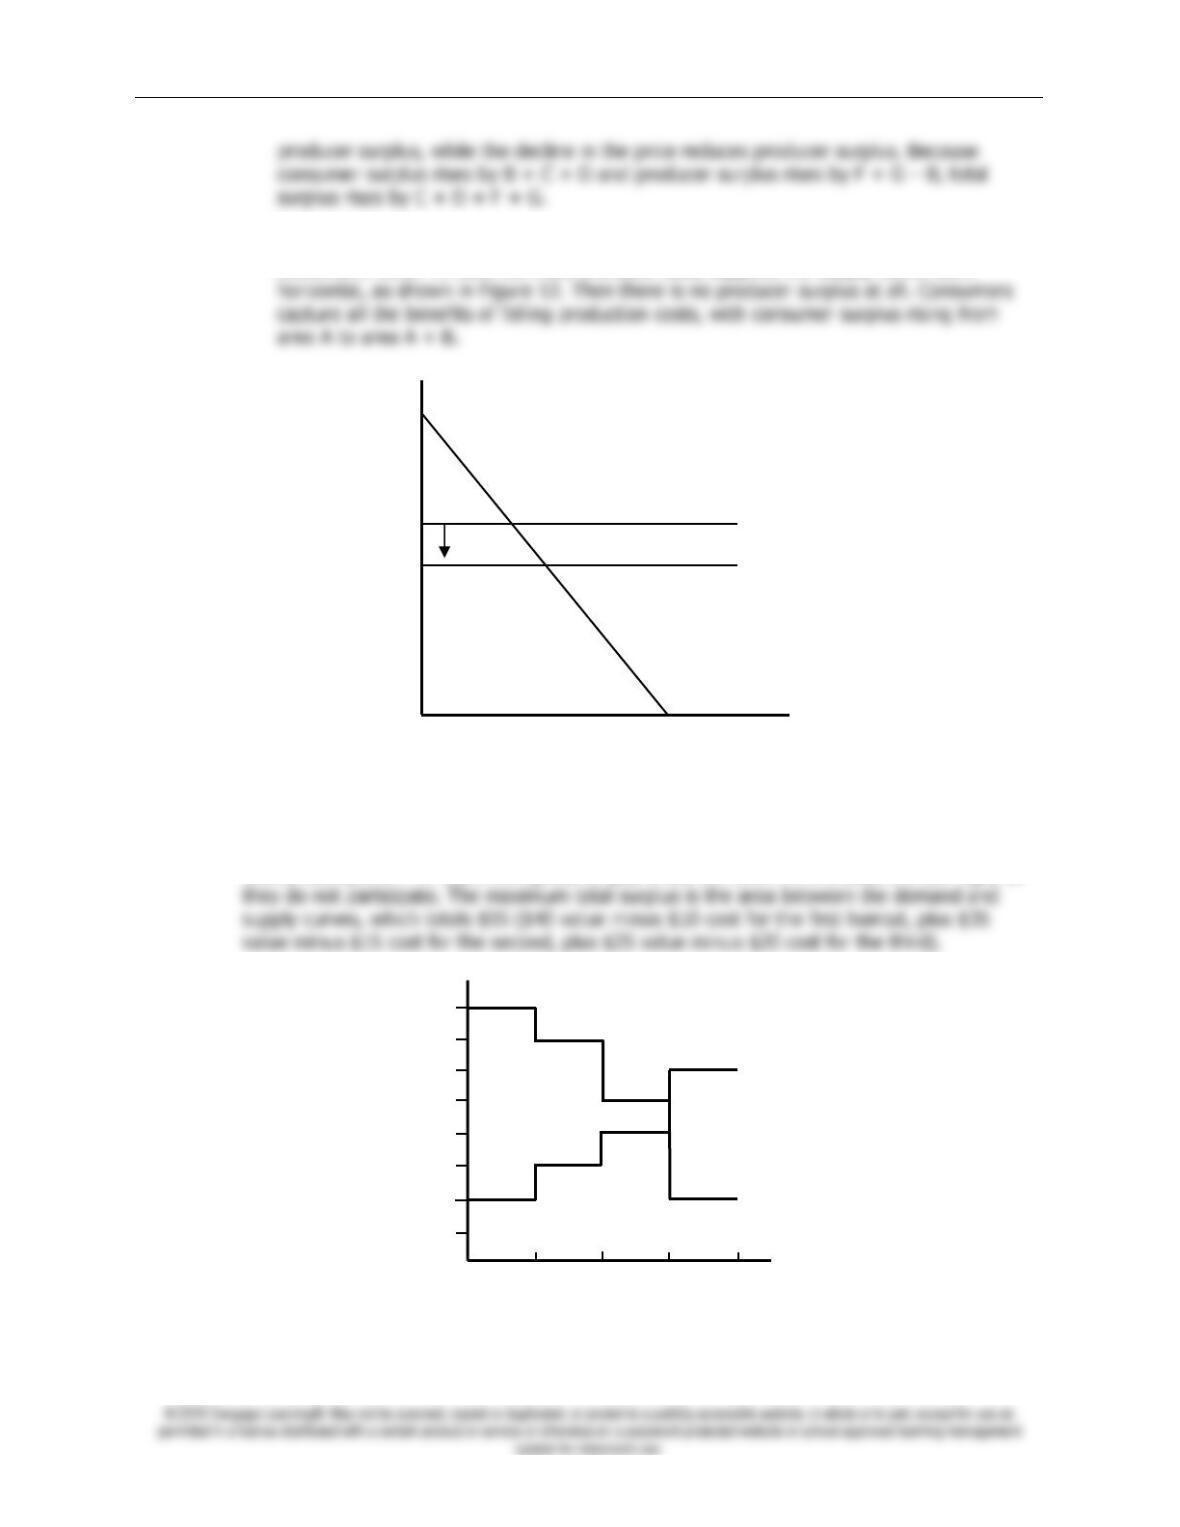
c. If the supply of flat-screen TVs is very elastic, then the shift of the supply curve benefits
consumers most. To take the most dramatic case, suppose the supply curve were
Figure 12
8. Figure 13 shows supply and demand curves for haircuts. Supply equals demand at a quantity
of three haircuts and a price between $20 and $25. Firms A, C, and D should cut the hair of
Claire, Gloria, and Phil. Jay’s willingness to pay is too low and firm B’s costs are too high, so
Figure 13
1
2
3
4
5
10
15
20
25
30
35
40
Quantity of Haircuts
Price of Haircuts
Claire
Gloria
Phil
Jay
D
A
C
B
A
B
S1
S2
Demand
Quantity of flat-screen TVs
Price of flat-screen TVs
132 ❖ Chapter 7/Consumers, Producers, and the Efficiency of Markets
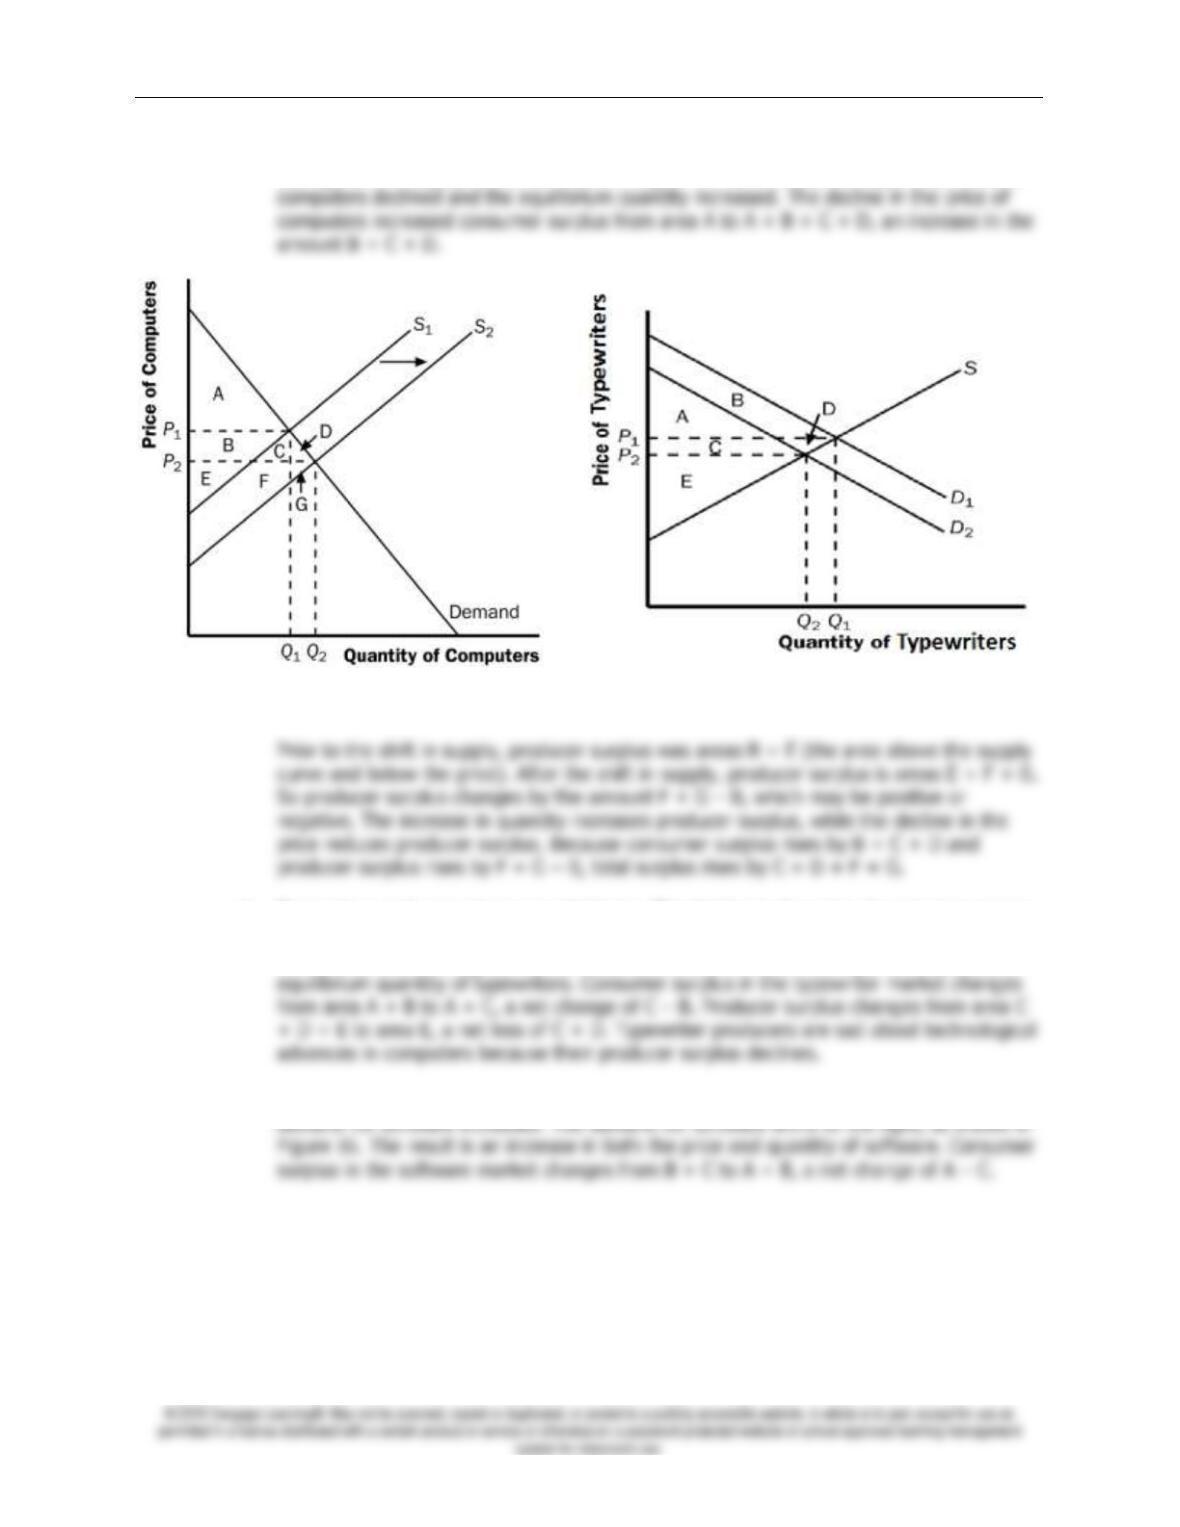
9. a. The effect of falling production costs in the market for computers resulted in a shift to
the right in the supply curve, as shown in Figure 14. As a result, the equilibrium price of
Figure 14 Figure 15
b. Typewriters and computers are substitutes. The decline in the price of computers means
that people substituted computers for typewriters, shifting the demand for typewriters to
the left, as shown in Figure 15. The result is a decline in both the equilibrium price and
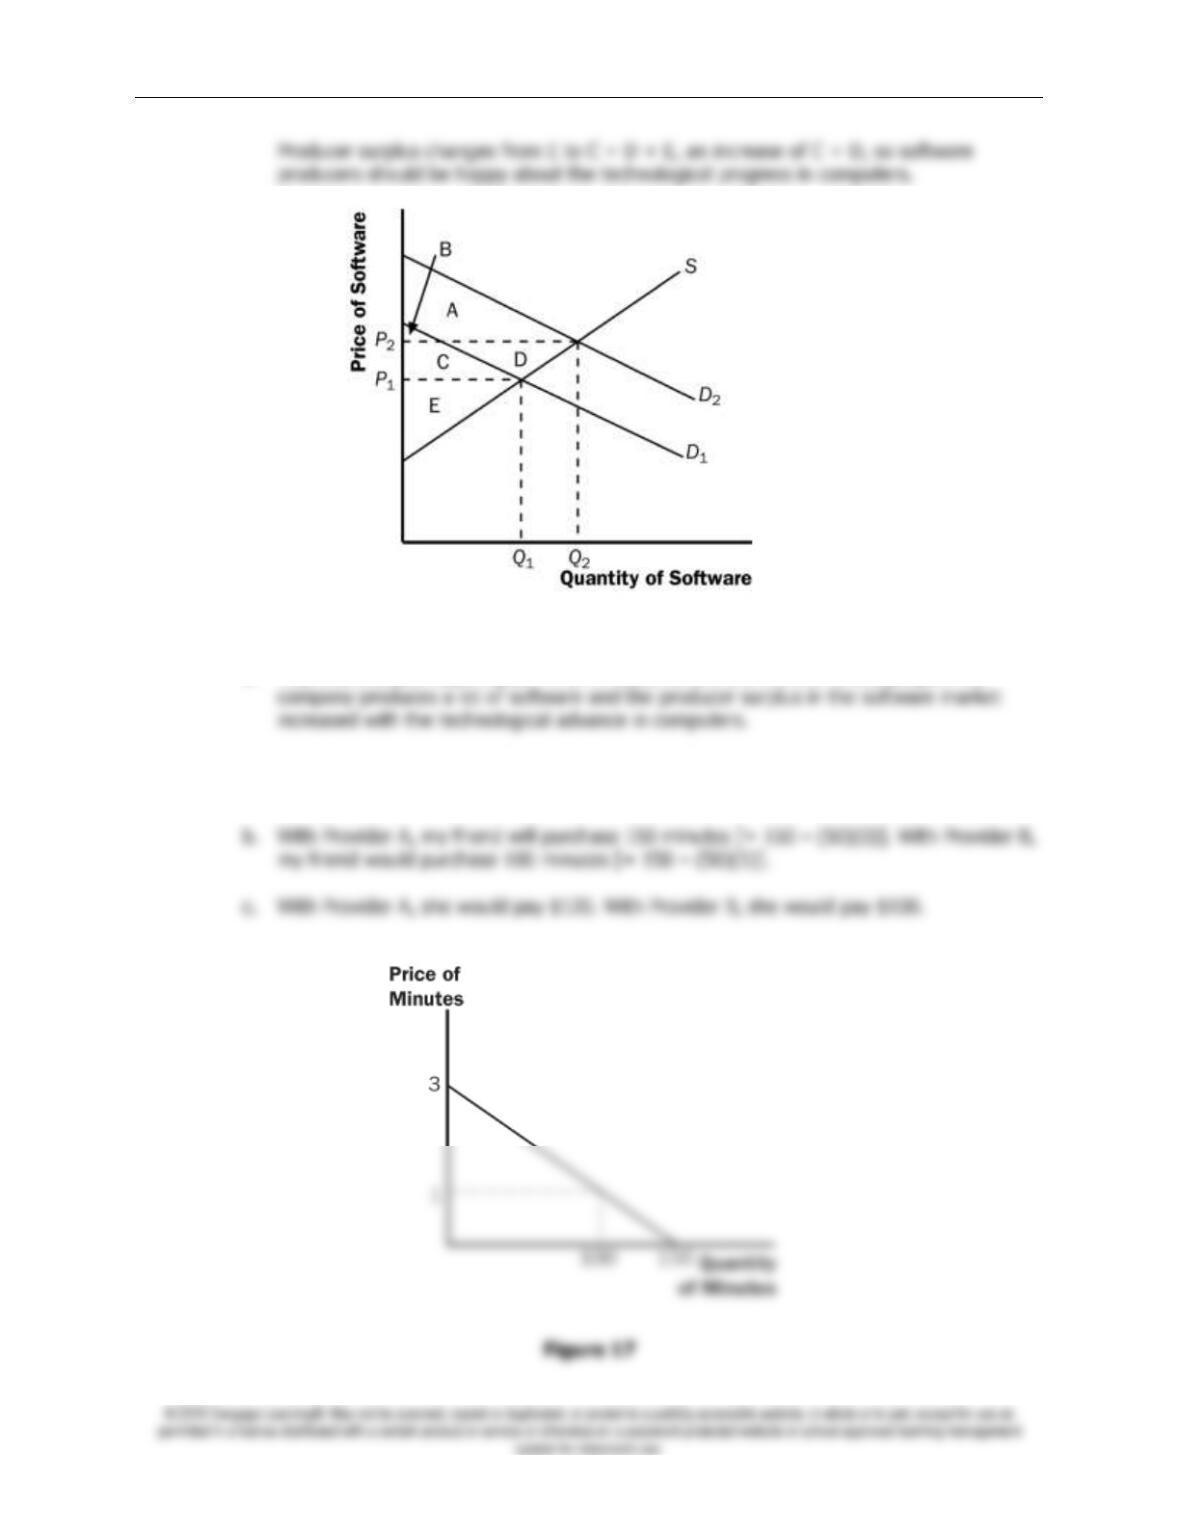
c. Software and computers are complements. When the price of computers decreases, the
Chapter 7/Consumers, Producers, and the Efficiency of Markets ❖ 133
Figure 16
d. Yes, this analysis helps explain why Bill Gates is one the world’s richest people. His
10. a. With Provider A, the cost of an extra minute is $0. With Provider B, the cost of an extra
minute is $1.
134 ❖ Chapter 7/Consumers, Producers, and the Efficiency of Markets
e. I would recommend Provider A because she receives greater consumer surplus when
buying from that provider.
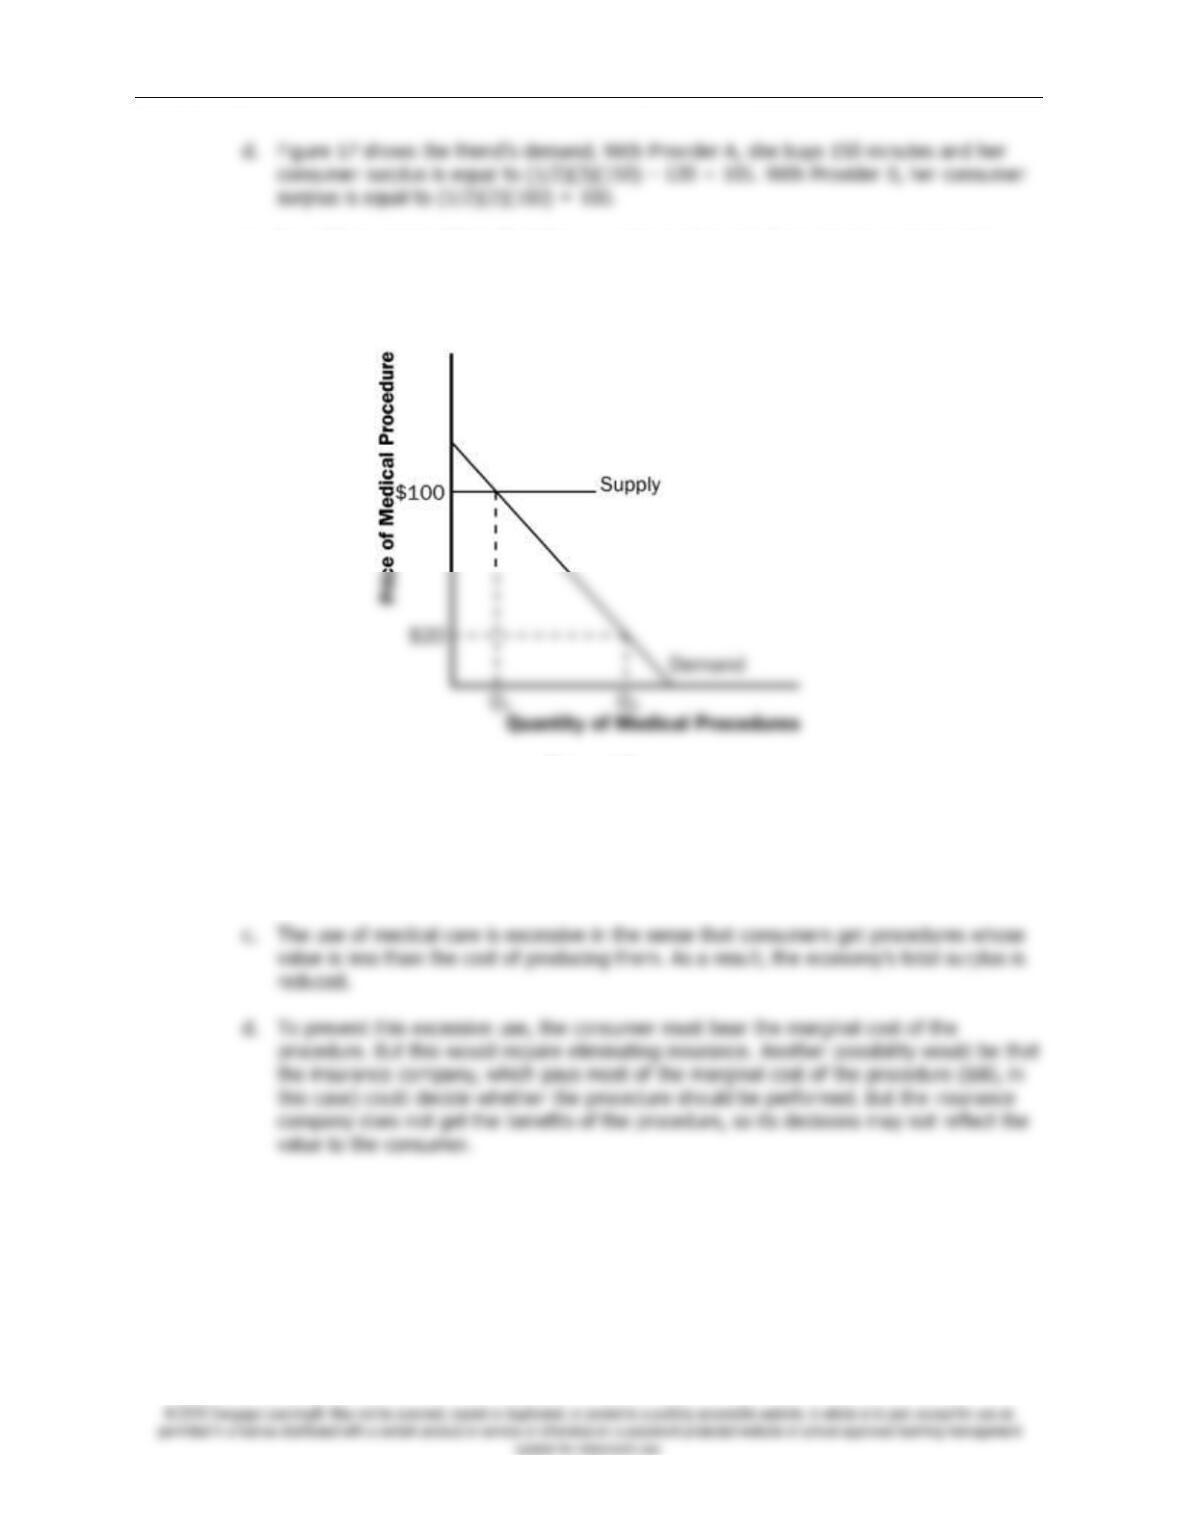
11. a. Figure 18 illustrates the demand for medical care. If each procedure has a price of $100,
quantity demanded will be
Q
1 procedures.
Figure 18
b. If consumers pay only $20 per procedure, the quantity demanded will be
Q
2 procedures.
Because the cost to society is $100, the number of procedures performed is too large to
maximize total surplus. The quantity that maximizes total surplus is
Q
1 procedures, which
is less than
Q
2.