1
2
3
4
5
6
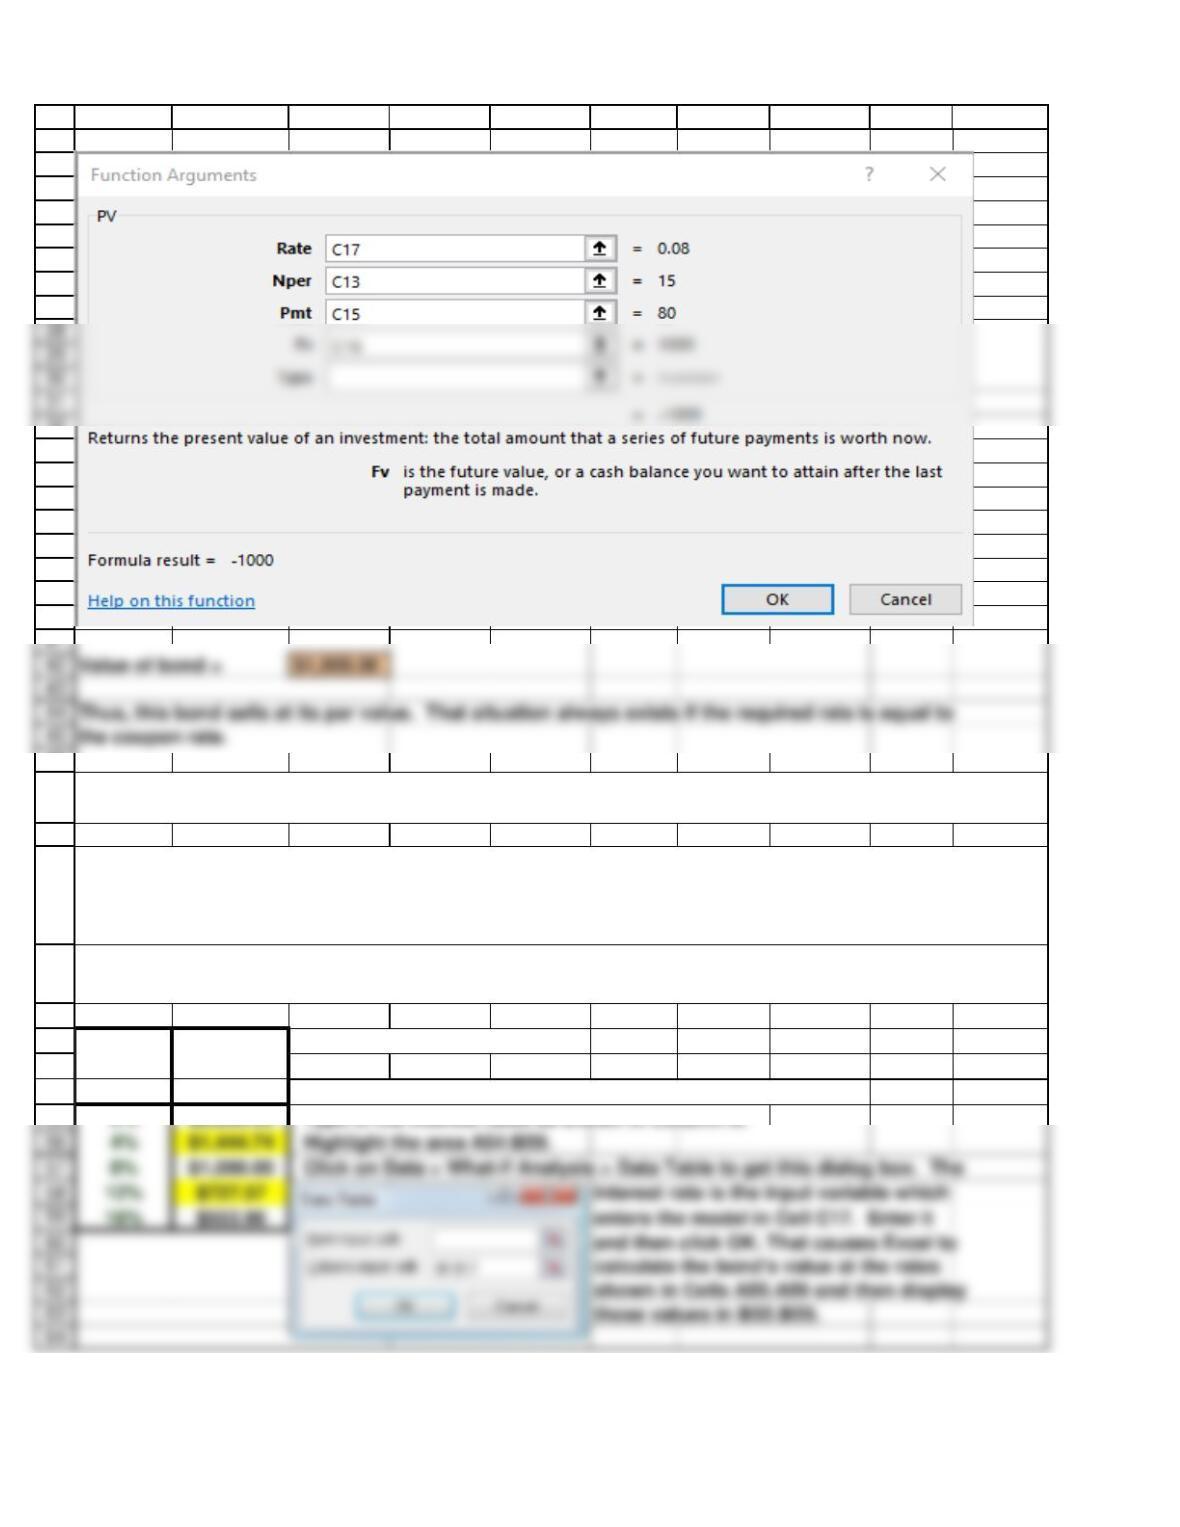
8
9
10
11
12
13
14
A B C D E F G H I J
07 Chapter model 12/12/2018
BOND VALUATION (Section 7-3)
INPUT DATA
Years to Maturity 15
Coupon rate 8% You know that 8% = 0.08, so rates can be shown as percents
Chapter 7. Bonds and Their Valuation
The value of any financial asset is the present value of the asset’s expected future cash flows. The key
inputs are (1) the expected cash flows and (2) the appropriate discount rate, given the bond’s risk,
maturity, and other characteristics. The model developed here analyzes bonds in various ways.
Bond valuation requires keen judgment with regard to assessing the riskiness of the bond, i.e., what is
the likelihood that the promised coupon and maturity payments will actually be made at the scheduled
A bond has a 15-year maturity, an 8% annual coupon, and a $1,000 par value. The required rate of return
on the bond is 8%, given its risk, maturity, liquidity, and other rates in the economy. What is a fair value
for the bond, i.e., its market price?
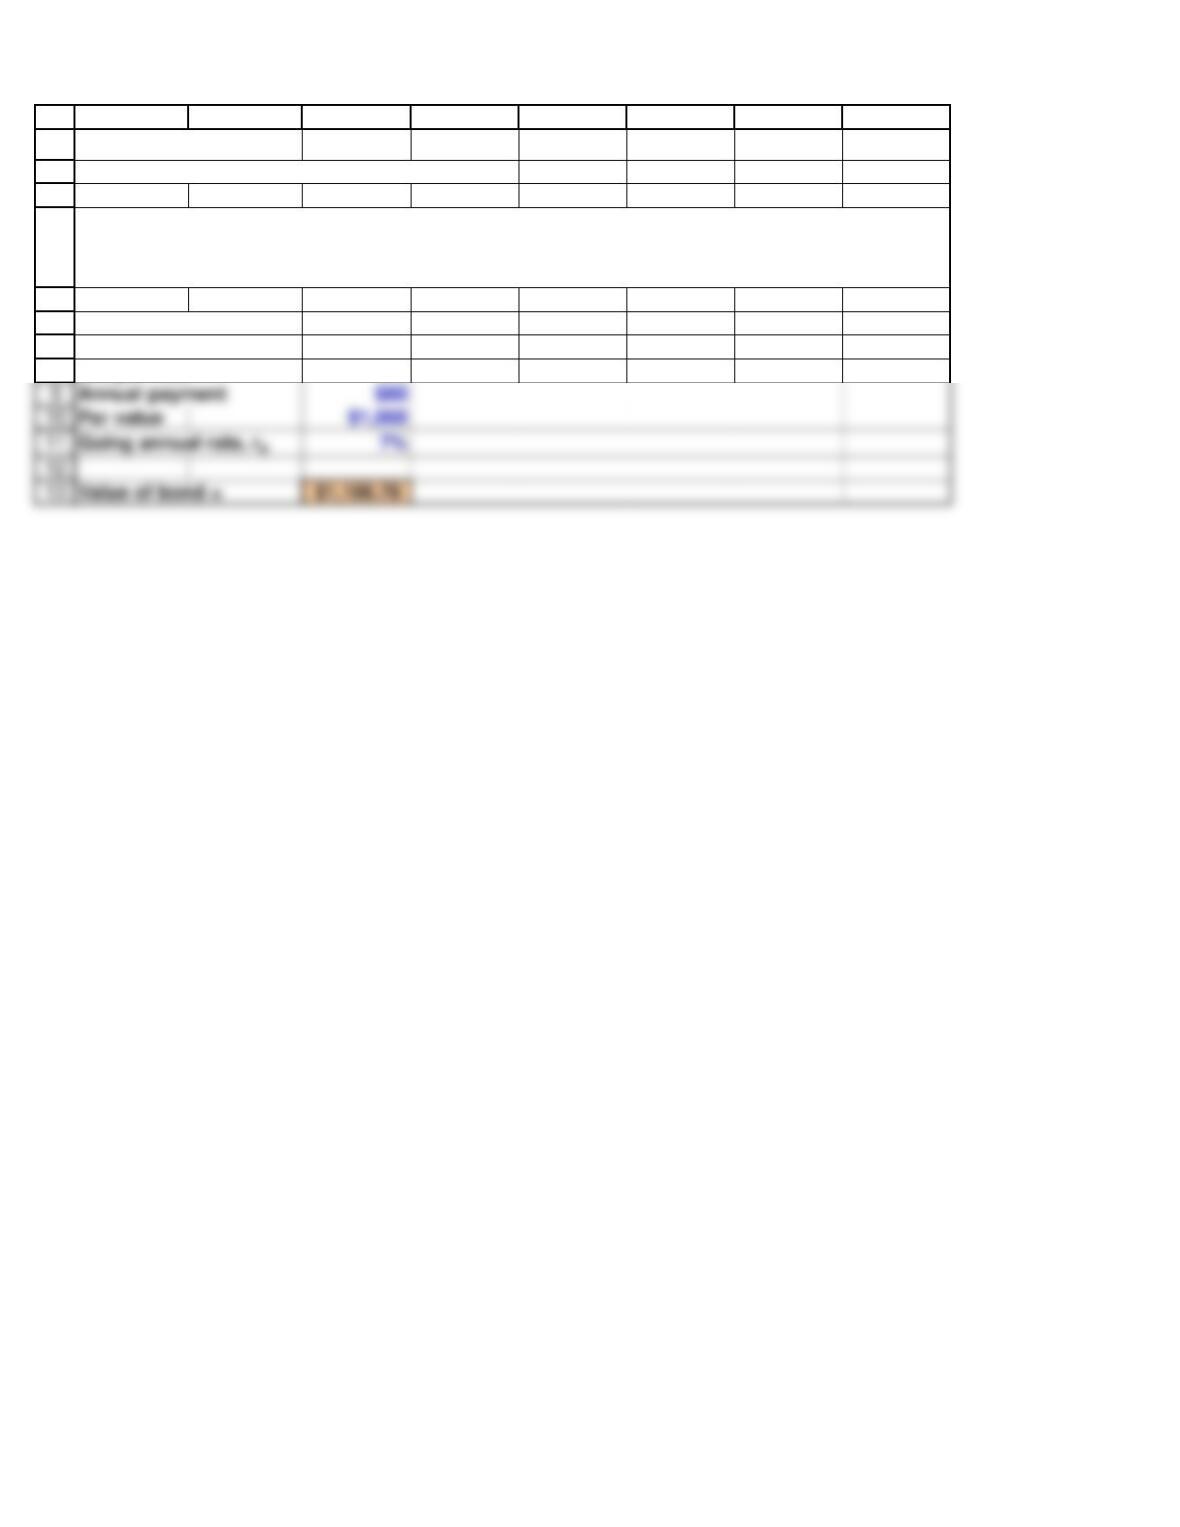
Annual Payment $80 or as fractions. Excel works with fractions, so it reads 8% as
Par value $1,000 0.08.
20
21
22
23
24
25
26
27
32
33
34
35
36
37
38
39
40
46
47
48
49
50
51
52
53
54
59
55
A B C D E F G H I J
Required Bond Type in the labels as shown.
Rate Value
(r) $1,000.00 Enter =C42 here to display the value calculated in C42.
0% $2,200.00 Type in the interest rates as shown in Column A.
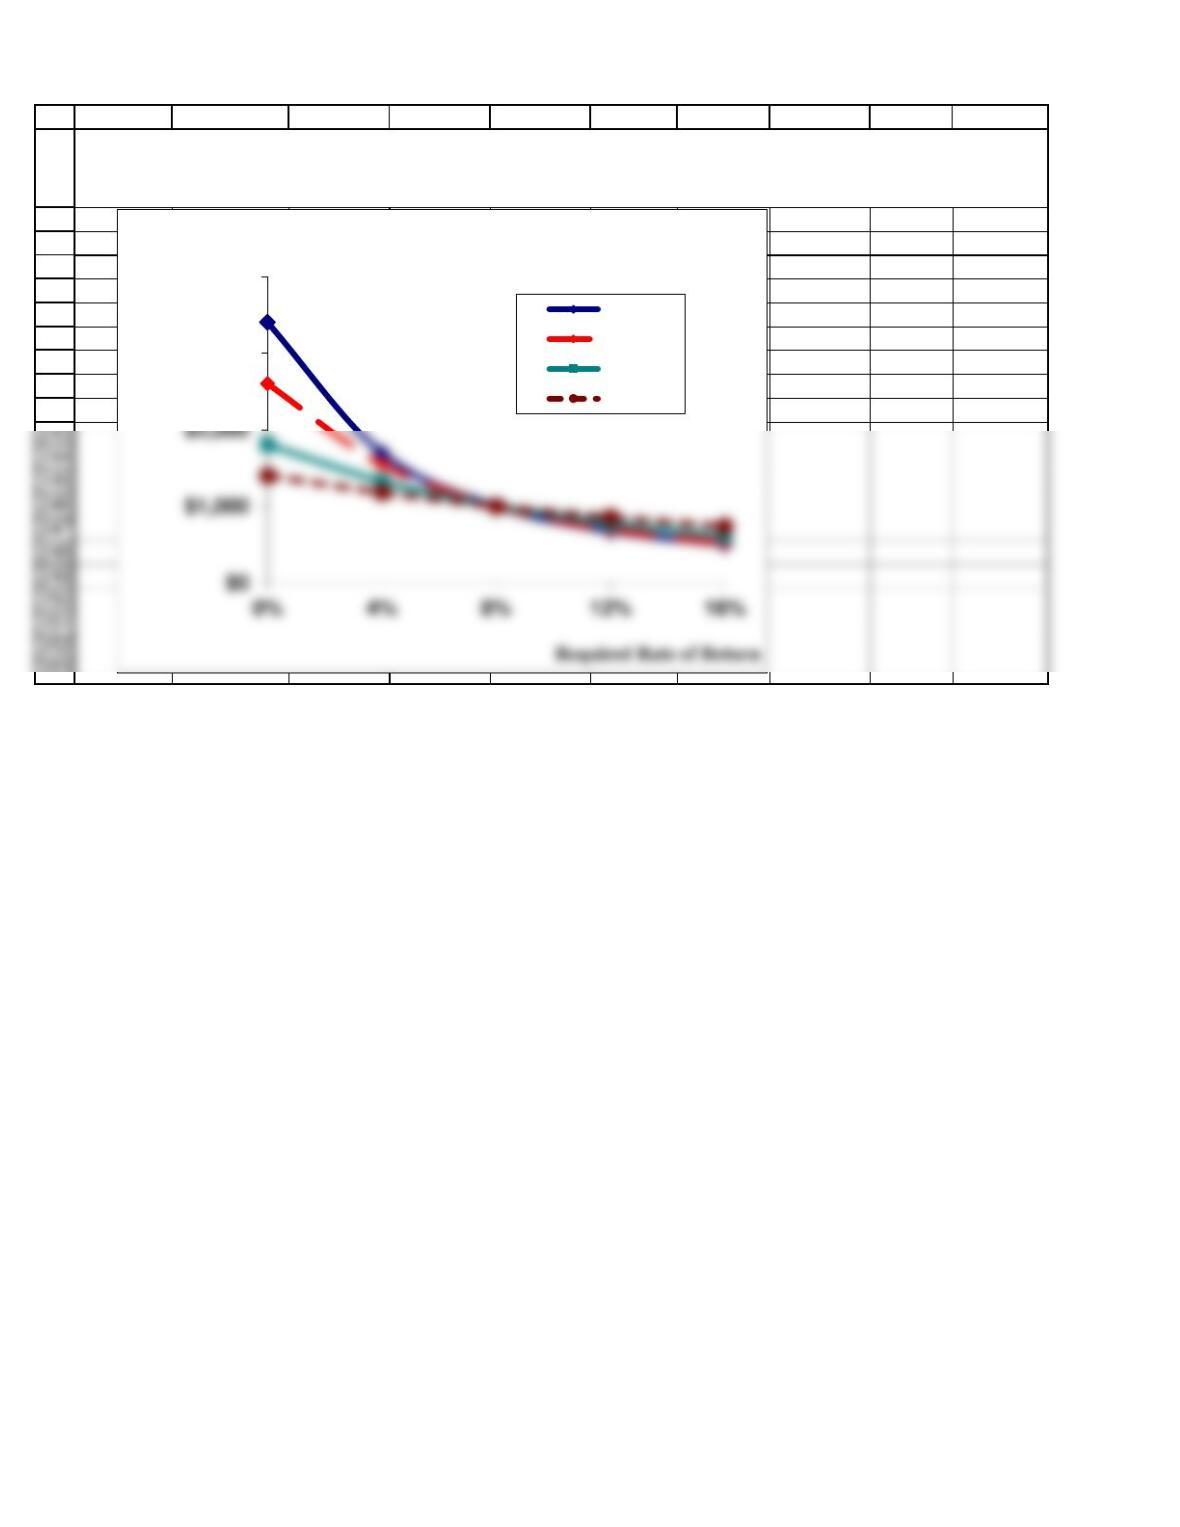
Suppose the required rate rd (a) fell from 8% to 4% or (b) rose to 12%. How would those changes affect
the value of the bond?
First, change Cell C17 from 8% to 4% and observe that the bond’s value rises to $1,444.74. Then change
Cell C17 to 12% and note that the value declines to $727.57. You can see that the bond’s price falls when
the going interest rate (or required rate of return) rises, and the price rises when the interest rate falls.
Finish by resetting Cell C17 to 8%.
An alternative way to determine the effect of interest rates on bond prices involves the use of Excel’s
“Data Tables.”
Current price -$1,422.52 Show the price as a negative–you pay this amount.
65
66
67
68
69
70
71
72
73
74
75
76
77
78
79
80
81
82
84
85
86
88
89
91
92
93
94
95
96
97
101
A B C D E F G H I J
BOND YIELDS (Section 7-4)
YIELD TO MATURITY (YTM)
EXAMPLE
Use the Rate function to solve the problem. Proceed as above with the PV function, except select
the Rate function, then insert the required data, and click OK.
Years to Maturity 14
Coupon rate 8%
Annual Payment $80.00
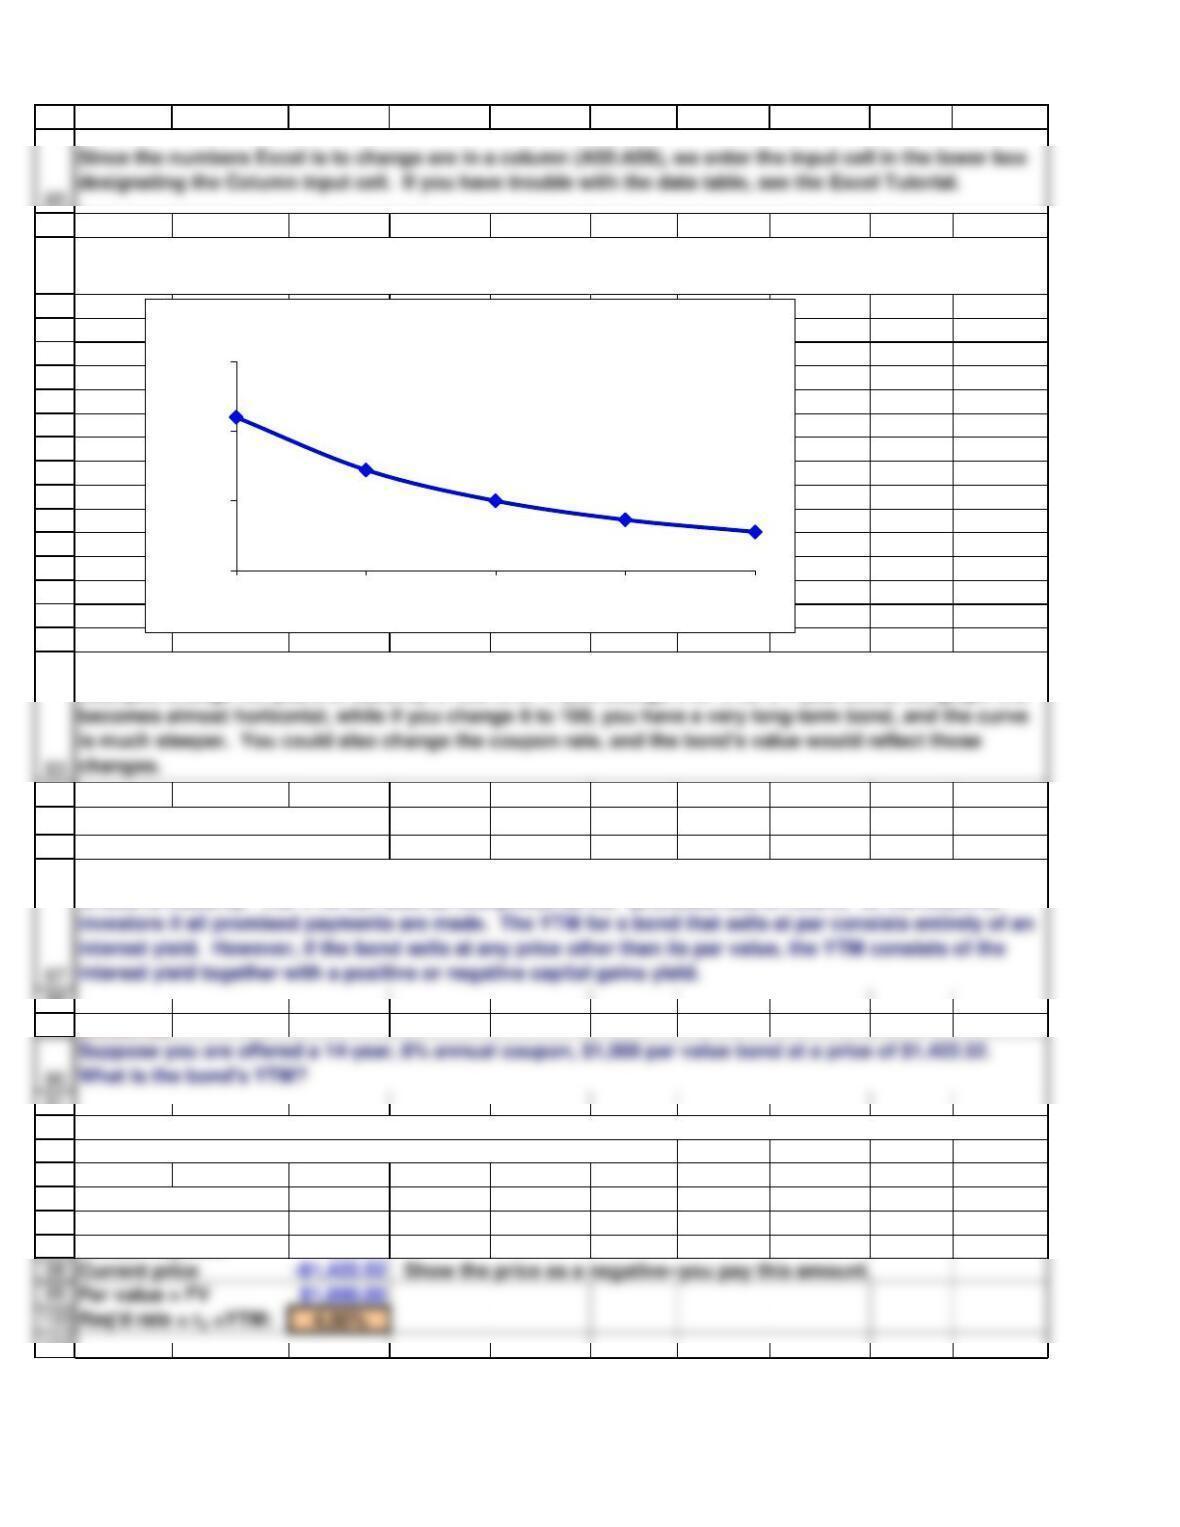
We can use the data table to construct the graph shown below. Graphs are discussed also in the Excel
Tutorial.
With the model we now have, you could change the inputs and observe changes in the graph. For
example, change the years to maturity in Cell C13. If you change it to 1, for a 1-year bond, the graph line
The YTM is the rate of return that a bond earns if the issuer makes all scheduled payments and the bond
is held to maturity. The YTM can also be interpreted as the “promised rate of return,” or the return to
$0
$1,000
$2,000
$3,000
0% 4% 8% 12% 16%
Interest Rate Sensitivity
Call price = FV $1,080.00
102
103
104
106
107
108
109
110
111
112
113
117
118
119
A B C D E F G H I J
YIELD TO CALL (YTC)
EXAMPLE
Years to call: 9The bond originally had 10 years until the call date. Now it
Coupon rate: 8% has 9 years.
Annual Pmt: $80.00
Current price: -$1,422.52
The YTM is the same as the expected rate of return provided (1) the probability of default is zero and (2)
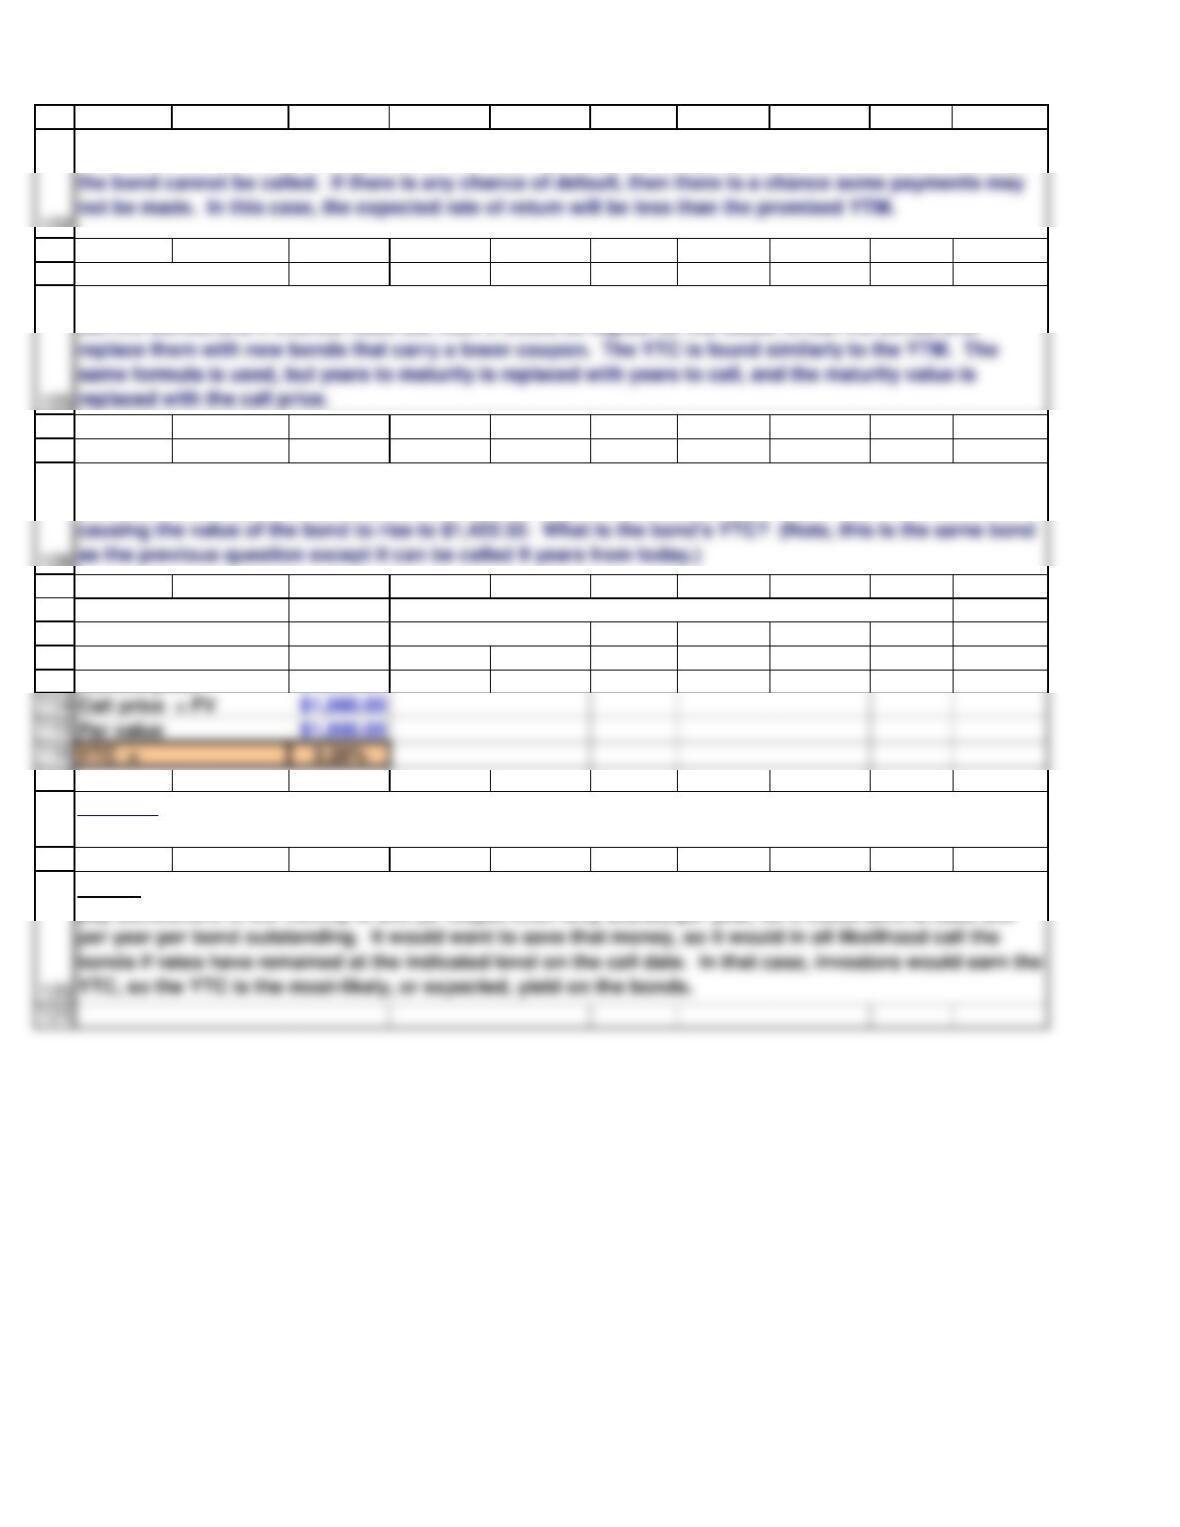
The YTC is the rate of return investors will receive if their bonds are called. If the issuer has the right to
call the bonds, and if interest rates fall, then it would be logical for the issuer to call the bonds and
Suppose you purchase a 15-year, 8% annual coupon, $1,000 par value bond, but the bond originally could
be called after 10 years at a call price of $1,080. One year later, interest rates have fallen from 8% to 4%
Question: This bond’s YTM is 4%, but its YTC is only 3.28%. Which would an investor be more likely to
actually earn?
Answer. The company could call the old bonds, which pay $80 per year, and replace them with bonds that
pay somewhere in the vicinity of $40 (or maybe even only $32.80) per year, so it could save at least $40
122
123
124
125
126
127
128
129
130
131
134
136
137
138
139
140
141
142
143
152
A B C D E F G H I J
EXTRA INFORMATION–CURRENT YIELD (The current yield is discussed in a footnote.)
EXAMPLE
Par value $1,000.00
Coupon rate 8% Current Yield = 8.15%
CHANGES IN BOND VALUES OVER TIME (Section 7-5)
YTM for all 3 bonds 8%
Par (or face) value $1,000
Initial years to maturity
15
Coupon rate, Bond A: 5%
The current yield is the annual interest payment divided by the bond’s current price. The current yield
provides information regarding the amount of cash income that a bond will generate in a given year.
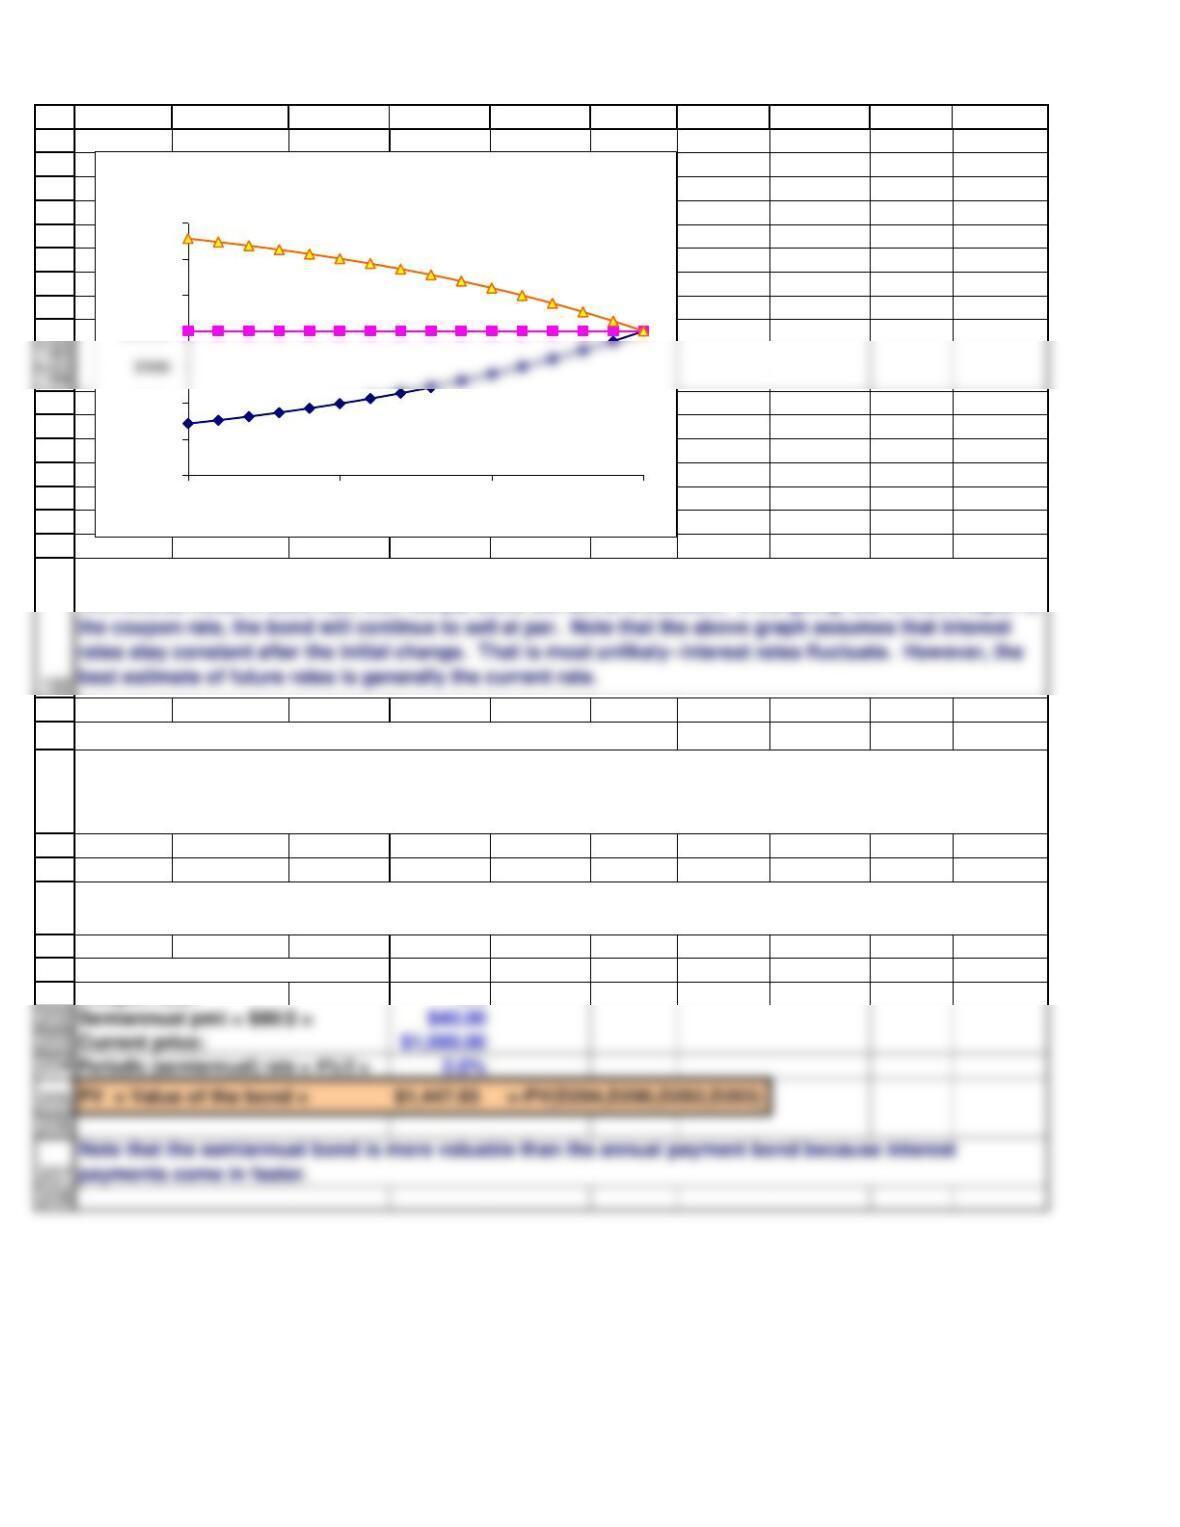
We plot the three bonds’ prices in the graph shown below. All the bonds’ prices must end up at par at
maturity, because that is what a bondholder will receive (plus the last interest payment). Thus, Bond A’s
What is the current yield on a $1,000 par value, 8% annual coupon bond that is currently selling for
$981.60?
Simply divide the annual interest payment by the price of the bond. Even if the bond made semiannual
payments, we would still use the annual interest.
The current yield provides information on a bond’s cash return, but it gives no indication of the bond’s
total return. To see this, consider a zero coupon bond. Since zeros pay no coupon, the current yield
Sudden changes in interest rates do occur, but gradual changes over time are more common. Therefore,
it is useful to examine how different bonds (identical but for their coupon rates) will behave over time.
Annual Payment $80.00
Current price $981.60
153
154
155
156
157
158
159
164
165
166
167
A B C D E F G H I J
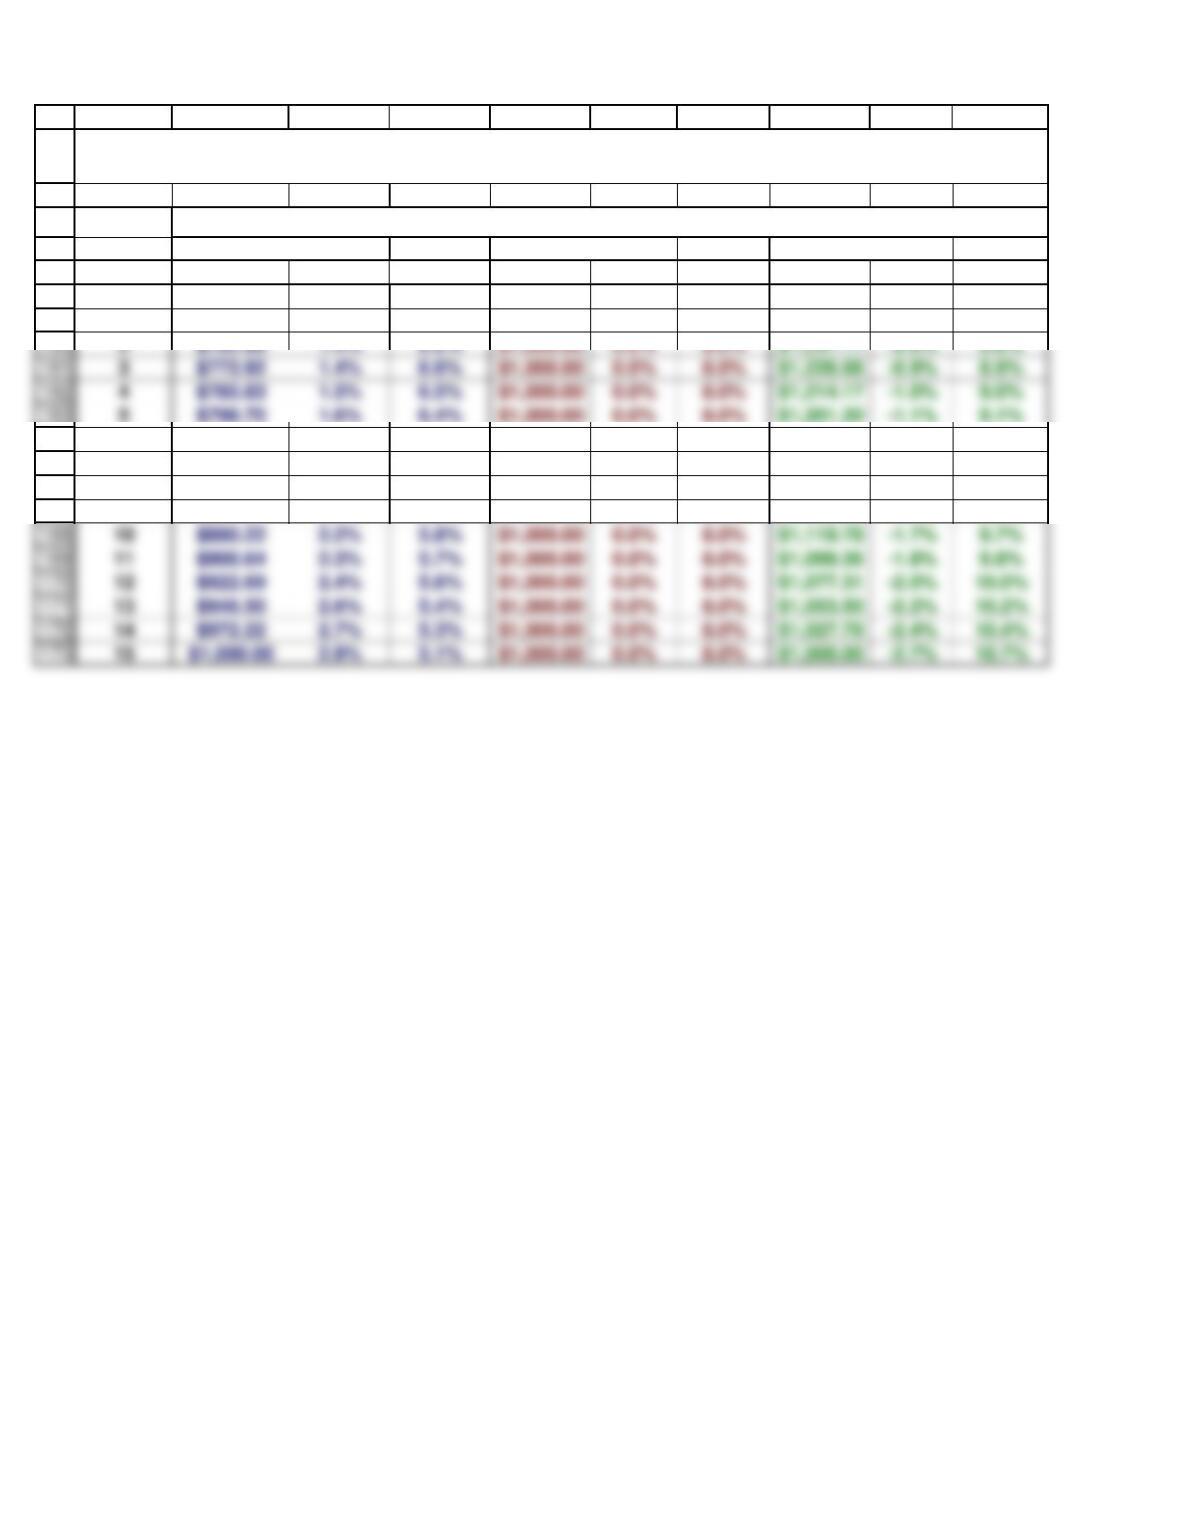
Coupon rate = 5% Coupon rate = 8% Coupon rate = 11%
tPrice Cap g yld Curr yld Price Curr yld Cap g yld Price Curr yld Cap g yld
0$743.22 ignore ignore $1,000.00 ignore ignore $1,256.78 ignore ignore
1$752.67 1.3% 6.7% $1,000.00 0.0% 8.0% $1,247.33 -0.8% 8.8%
6$812.59 1.7% 6.3% $1,000.00 0.0% 8.0% $1,187.41 -1.2% 9.2%
7$827.60 1.8% 6.2% $1,000.00 0.0% 8.0% $1,172.40 -1.3% 9.3%
8$843.81 2.0% 6.0% $1,000.00 0.0% 8.0% $1,156.19 -1.4% 9.4%
9$861.31 2.1% 5.9% $1,000.00 0.0% 8.0% $1,138.69 -1.5% 9.5%
BOND VALUES OVER TIME
We find the capital gains yield by finding the change in the bond’s price divided by the beginning-of-
year price, and the current yield by subtracting the capital gains yield from 8%.
2$762.89 1.4% 6.6% $1,000.00 0.0% 8.0% $1,237.11 -0.8% 8.8%
3$773.92 1.4% 6.6% $1,000.00 0.0% 8.0% $1,226.08 -0.9% 8.9%
4$785.83 1.5% 6.5% $1,000.00 0.0% 8.0% $1,214.17 -1.0% 9.0%
5$798.70 1.6% 6.4% $1,000.00 0.0% 8.0% $1,201.30 -1.1% 9.1%
Semiannual pmt = $80/2 = $40.00
Current price: $1,000.00
174
175
176
177
178
179
180
181
182
185
186
187
188
189
190
191
193
194
195
196
197
198
199
200
201
A B C D E F G H I J
BONDS WITH SEMIANNUAL COUPONS (Section 7-6)
EXAMPLE
Periods to maturity = 15 × 2 = 30
Coupon rate: 8%
What is the price of a 15-year, 8% semiannual coupon, $1,000 par value bond if the nominal YTM is 4%?
If rates fall, the par value bond will go to a premium, but it will move toward par as maturity approaches.
The reverse holds if rates rise; then the par bond will sell at a discount. If the going rate remains equal to
Since most bonds pay interest semiannually, we now look at the valuation of semiannual bonds. We
must make three modifications to our original valuation model: (1) divide the coupon payment by 2, (2)
multiply the years to maturity by 2, and (3) divide the nominal interest rate by 2.
$600
$700
$800
$1,000
$1,100
$1,200
$1,300
0 5 10 15
Price of Bond Over Time
Coupon = 11%
Coupon = 5%
Coupon = 8%
209
210
211
212
213
214
215
8% $1,000.00 $1,000.00 $1,000.00 $1,000.00
222
223
224
225
226
227
228
A B C D E F G H I J
ASSESSING A BOND’S RISKINESS (Section 7-7)
Coupon rate 8%
Payment $80.00
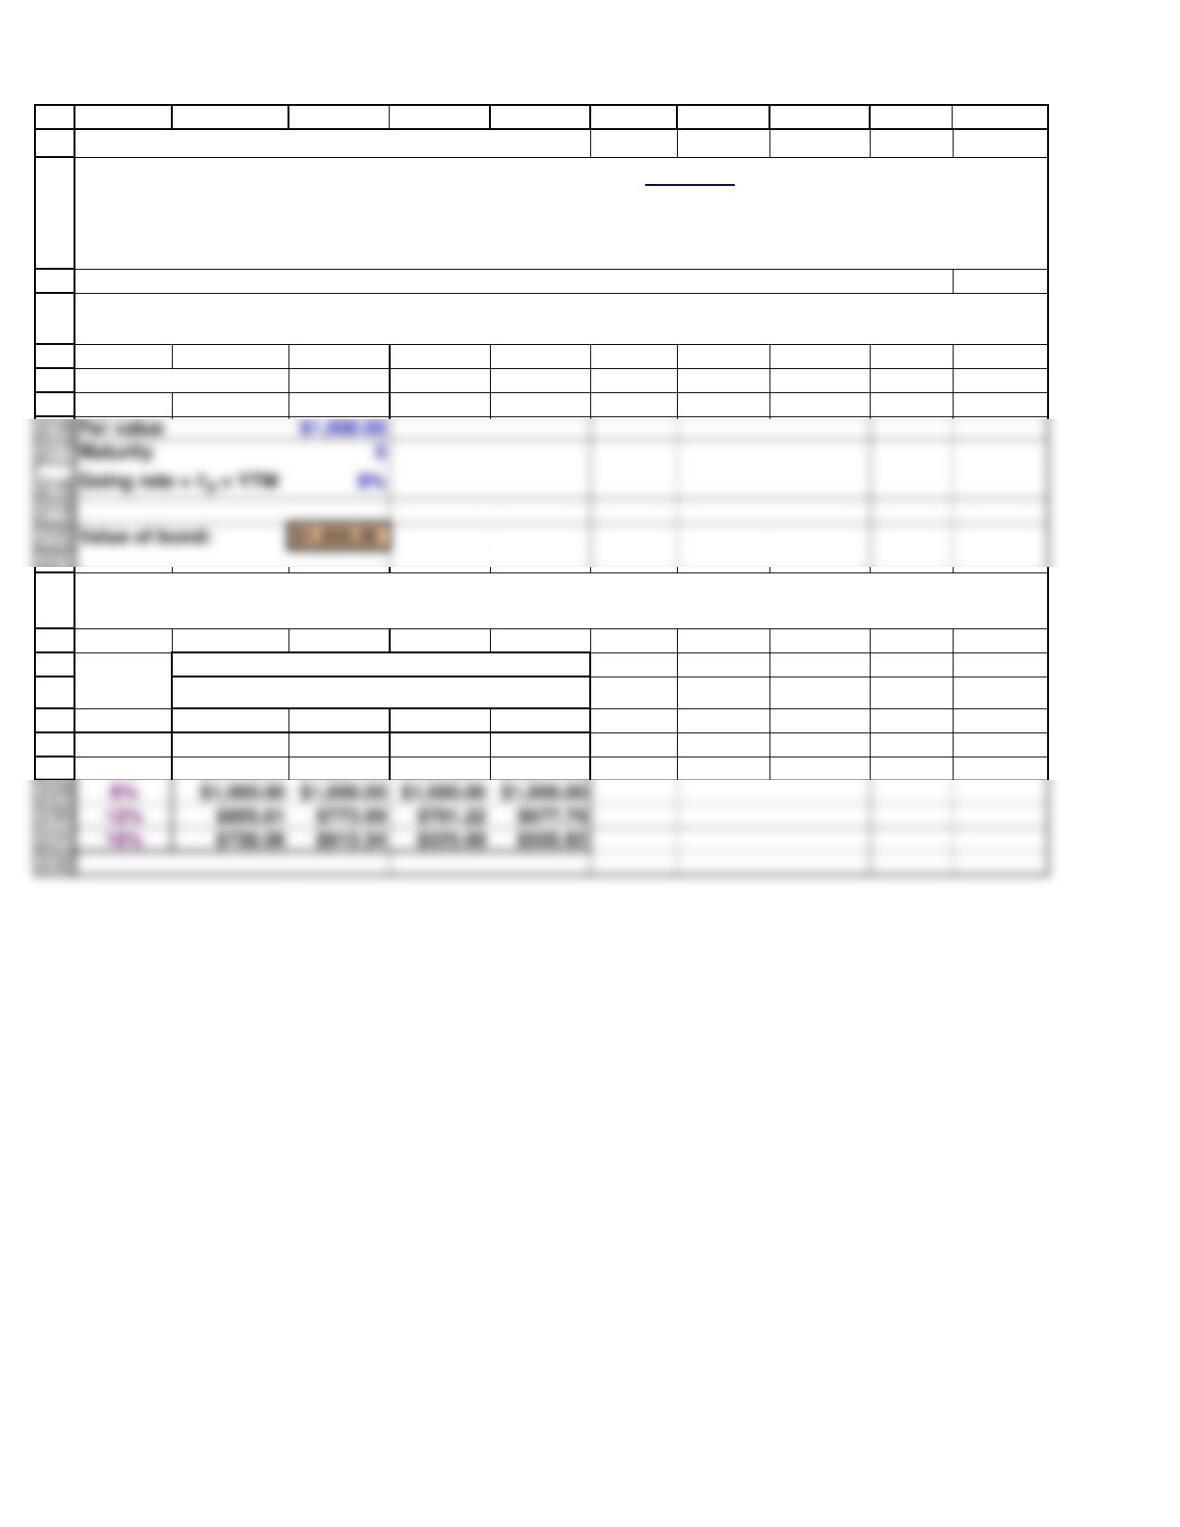
$1,000.00 510 20 30
0% $1,400.00 $1,800.00 $2,600.00 $3,400.00
4% $1,178.07 $1,324.44 $1,543.61 $1,691.68
Required
Rate, rd
Years to Maturity
Bond Value Under Different Conditions
A bond’s price declines if interest rates rise, and this is called price risk. We can measure price risk by the
slope of the line in the following graph. Price sensitivity is greater the longer the maturity, other things
held constant. Thus, if two bonds have the same coupon, the bond with the longer maturity will have
more price risk, or price sensitivity.
EXAMPLE. Compare the price risk of four bonds, all of which have an 8% annual coupon and a $1,000
face value. The bonds mature in 5, 10, 20, and 30 years.
First, we solve for the value of the 5-year bond, and then set up a 2-variable Data Table, where we let both
rd and Years change, as shown below.
Par value $1,000.00
233
234
235
236
237
238
239
240
241
242
253
A B C D E F G H I J
We can show the price sensitivity of bonds with different maturities by graphing the data shown in the
data table. The graph below does this. The longer the maturity, the steeper the lines, hence the greater
the bond’s price risk.
$3,000
$4,000
Bond Value
Price Risk
30-year
20-year
10-year
5-year
Annual payment $100
Par value $1,000
Value of bond = $1,150.72
1
2
3
4
5
6
13
14
15
16
A B C D E F G H
SECTION 7-3 12/12/2018
SOLUTIONS TO SELF-TEST QUESTIONS
Years to maturity 8
Years to maturity 12
Coupon rate 10%
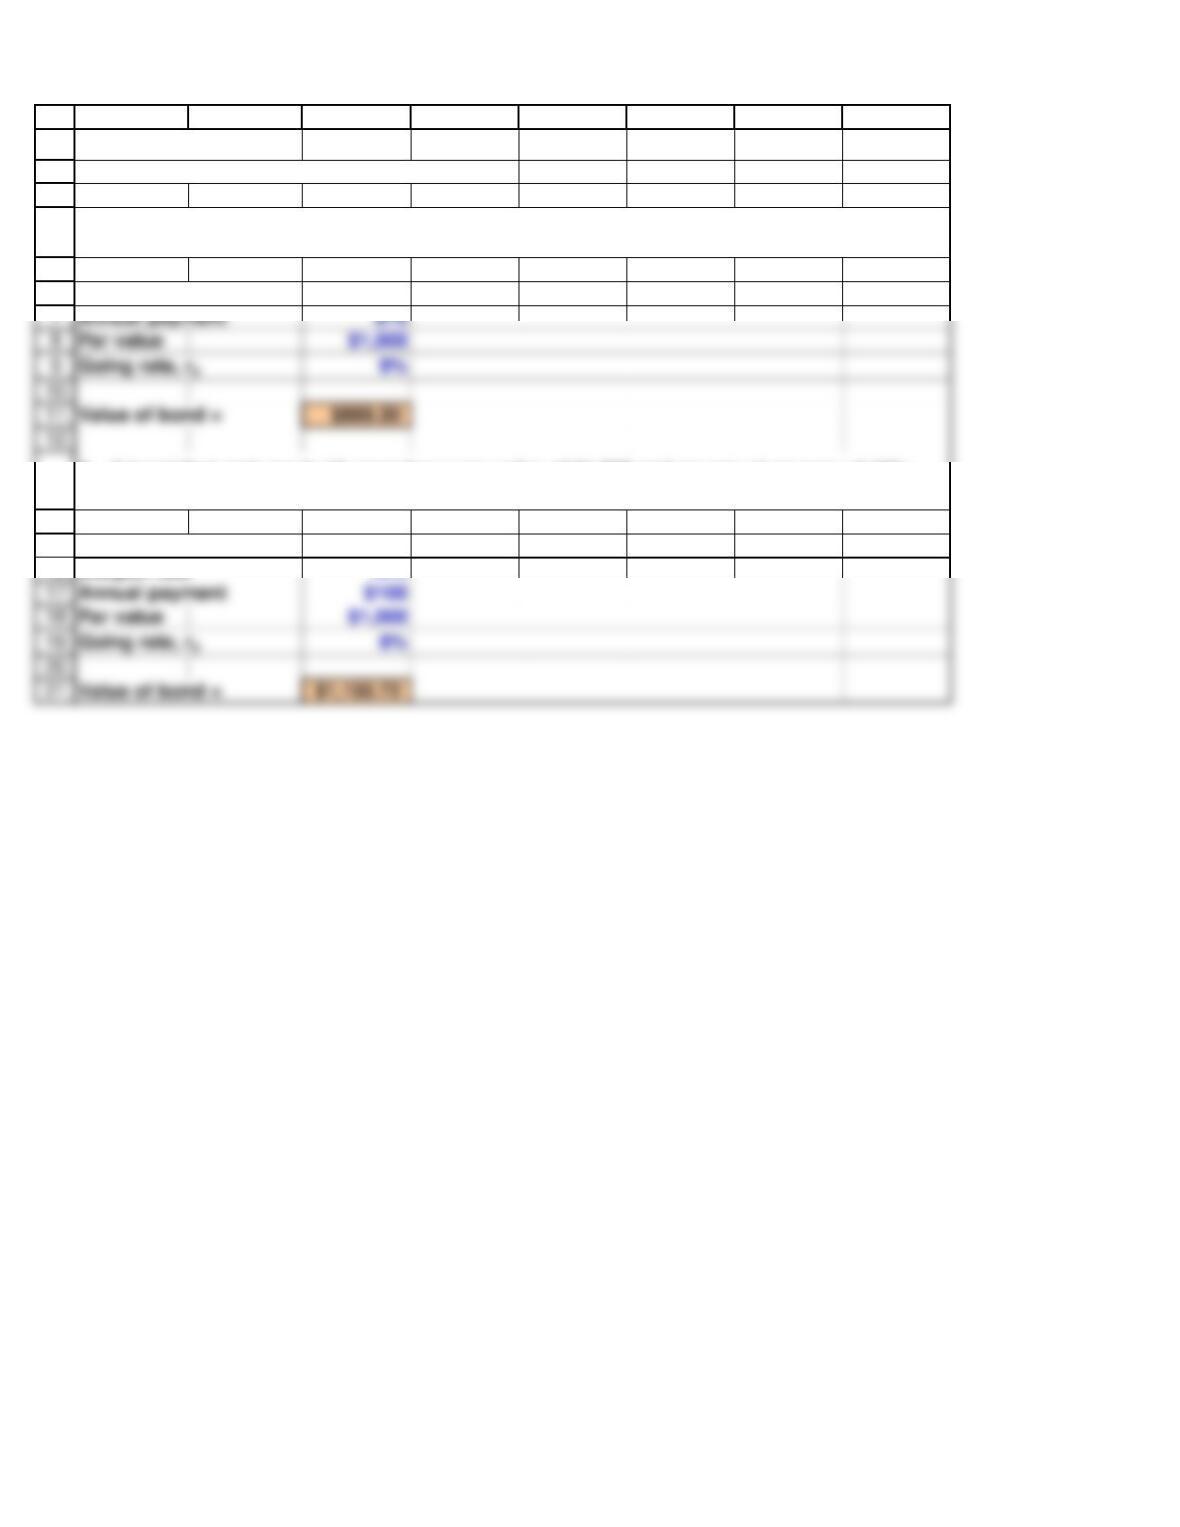
1. A bond that matures in 8 years has a par value of $1,000 and an annual coupon payment of
$70; its market interest rate is 9%. What is its price?
2. A bond that matures in 12 years has a par value of $1,000 and an annual coupon of 10%;
the market interest rate is 8%. What is its price?
Annual payment $70
Par value $1,000
Value of bond = $889.30
1
2
3
4
5
6
7
Current price -$1,275 Current price -$1,275
Par value = FV $1,000 Call price $1,120
12
13
14
15
20
21
22
23
A B C D E F G H
SECTION 7-4 12/12/2018
SOLUTIONS TO SELF-TEST QUESTIONS
Years to maturity 7
Annual payment $90.00
Years to maturity 20 Years to call 5
Annual payment $120 Annual payment $120
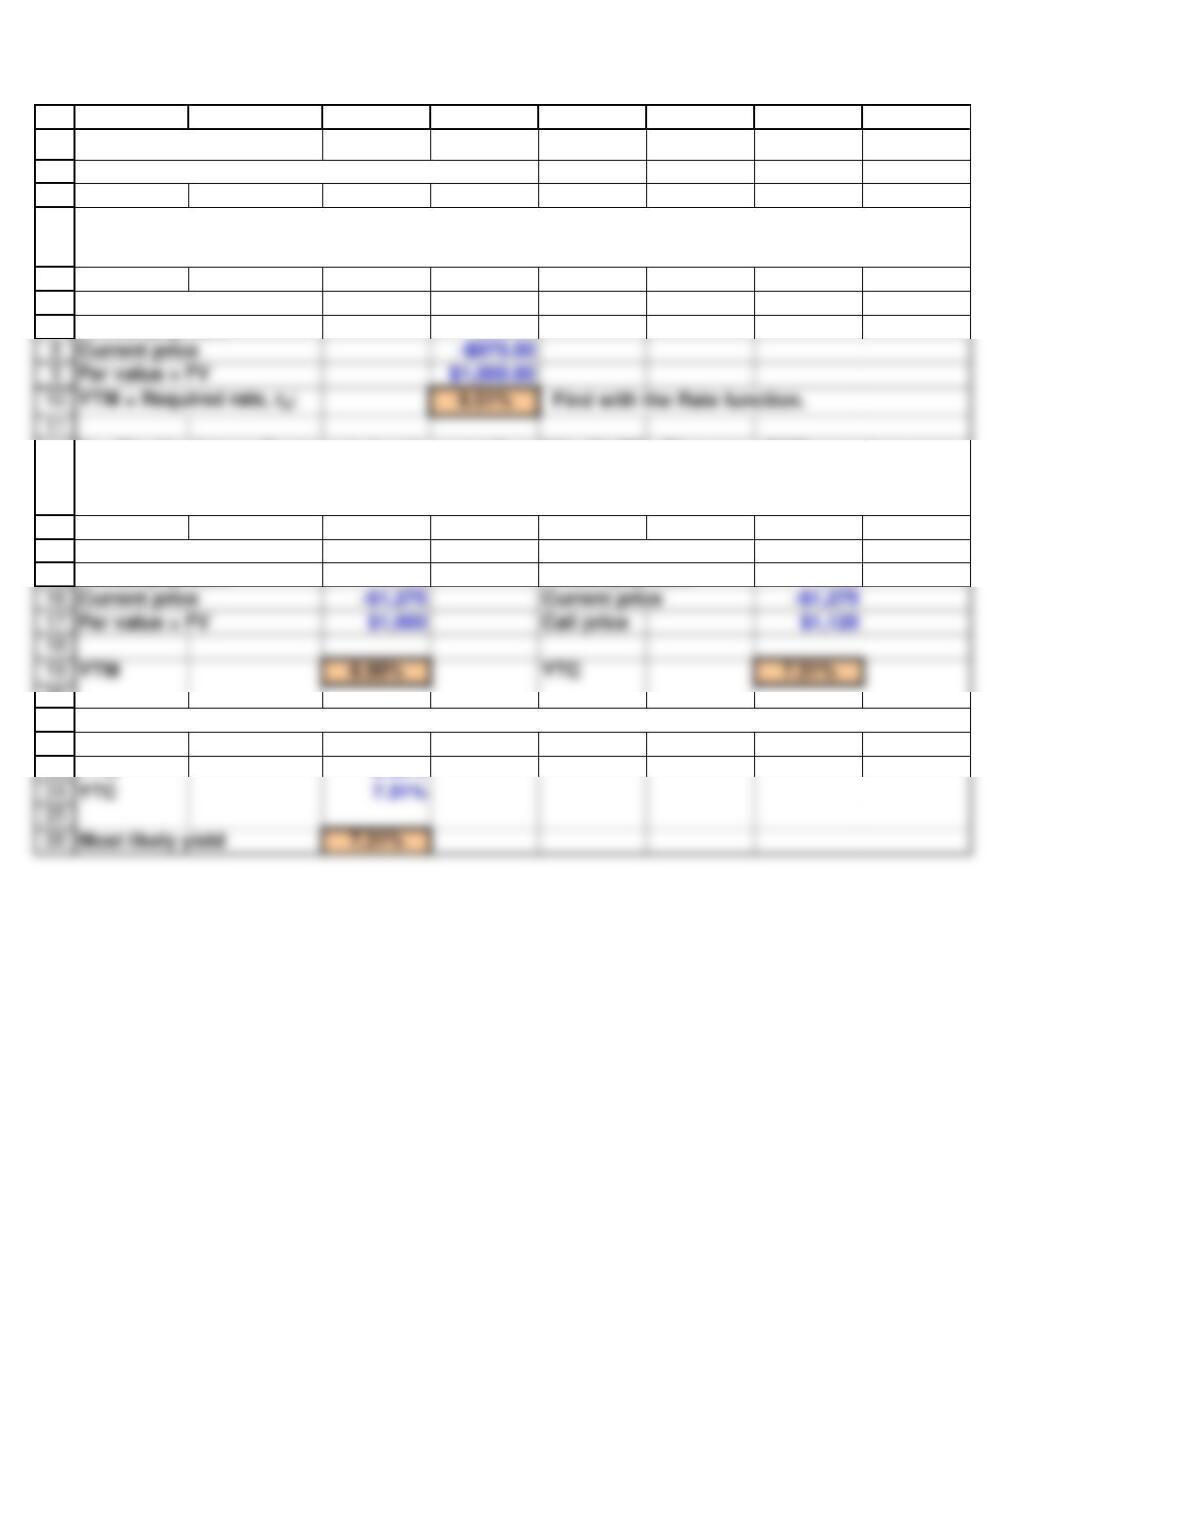
YTM 8.99%
2. Halley Enterprises’ bonds currently sell for $975. They have a 7-year maturity, an annual
coupon of $90, and a par value of $1,000. What is their yield to maturity?
3a. The Henderson Company’s bonds currently sell for $1,275. They pay a $120 annual coupon,
have a 20-year maturity, and a par value of $1,000, but they can be called in 5 years at $1,120.
What are their YTM and their YTC?
3b. If the yield curve remained flat which rate would investors expect to earn?
Current price -$975.00
1
2
3
4
5
6
7
8
9
10
11
12
13
14
A B C D E F G H
SECTION 7-5 12/12/2018
SOLUTIONS TO SELF-TEST QUESTIONS
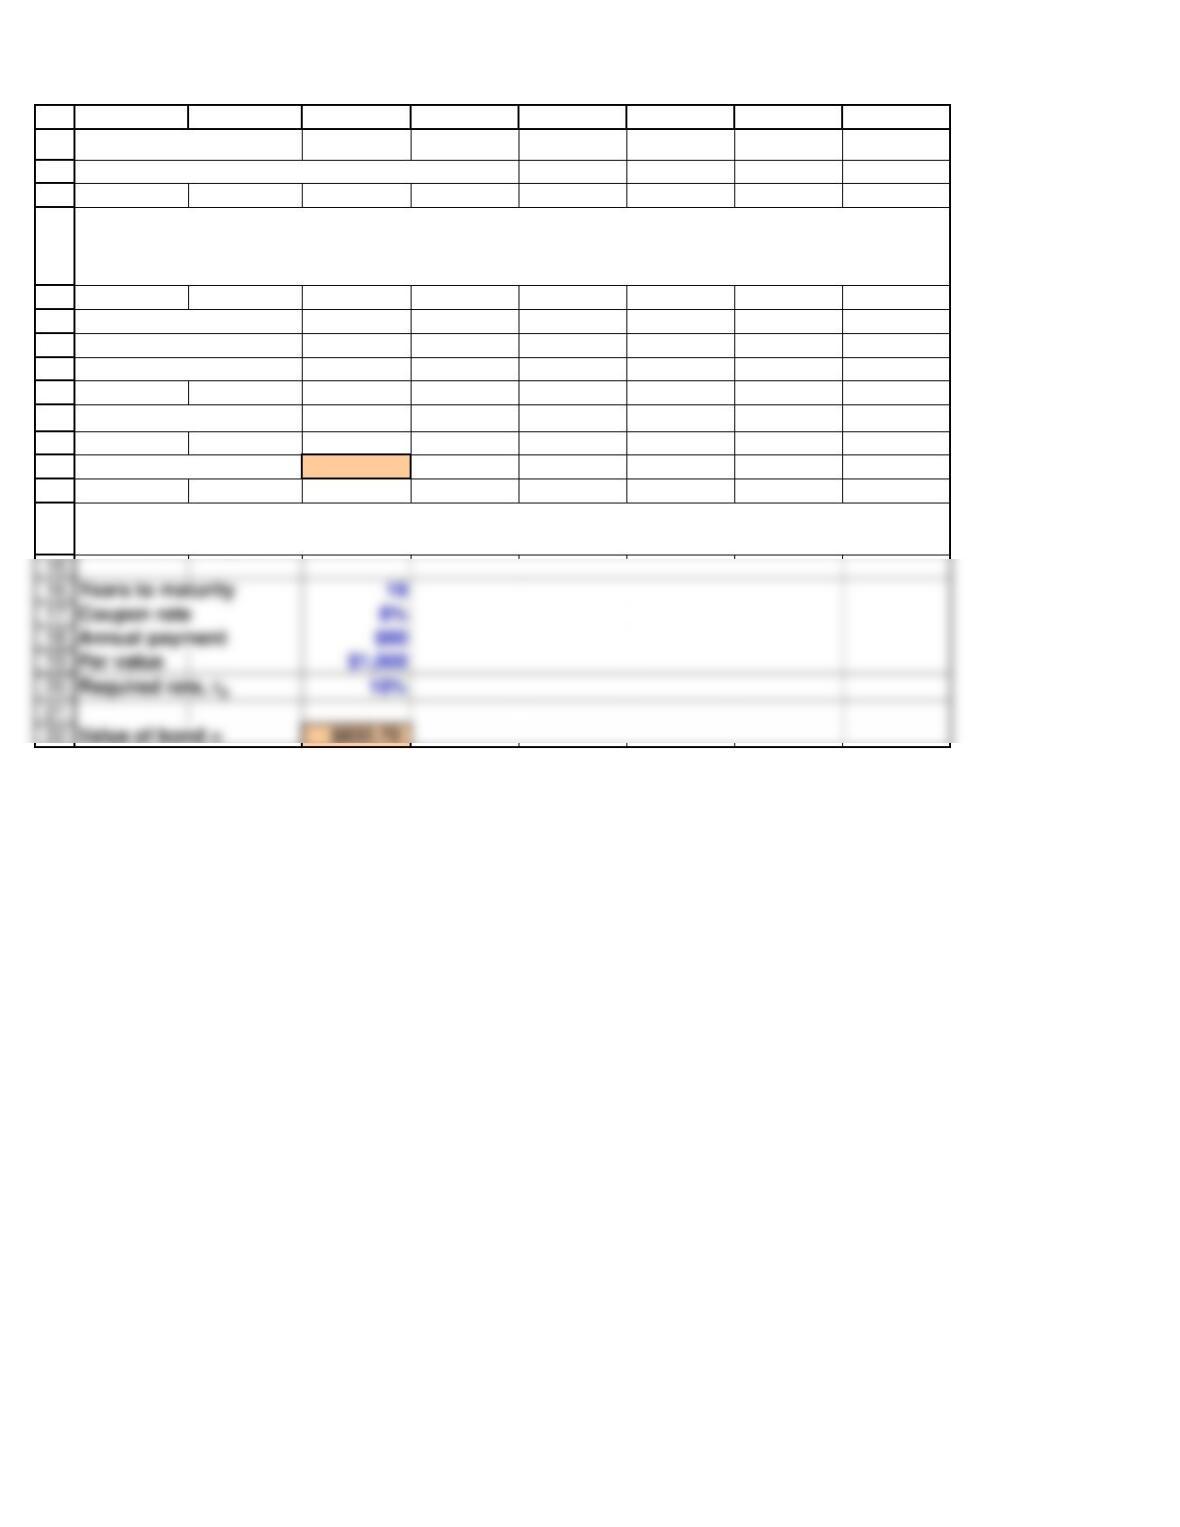
Years to maturity 19
Coupon rate 8%
Annual payment $80
Par value $1,000
Required rate, rd6%
Value of bond = $1,223.16
2a. Last year a firm issued 20-year, 8% annual coupon bonds at a par value of $1,000.
Suppose that one year later the going market interest rate drops to 6%. What is the new price
of the bonds assuming that they now have 19 years to maturity?
2b. Suppose that one year after issue, the going market interest rate is 10% (rather than 6%).
What would the price have been?
Years to maturity 19
Coupon rate 8%
Annual payment $80
Par value $1,000
Required rate, rd10%
Value of bond = $832.70
1
2
3
4
5
6
7
8
A B C D E F G H
SECTION 7-6 12/12/2018
SOLUTIONS TO SELF-TEST QUESTIONS
Coupons per year 2
Years to maturity 20
Coupon rate 8%
2. Hartwell Corporation bonds have a 20-year maturity, an 8% semiannual coupon, and a face
value of $1,000. The going nominal annual interest rate (rd) is 7%. What is the bond‘s price?
Annual payment $80
Par value $1,000
Value of bond = $1,106.78
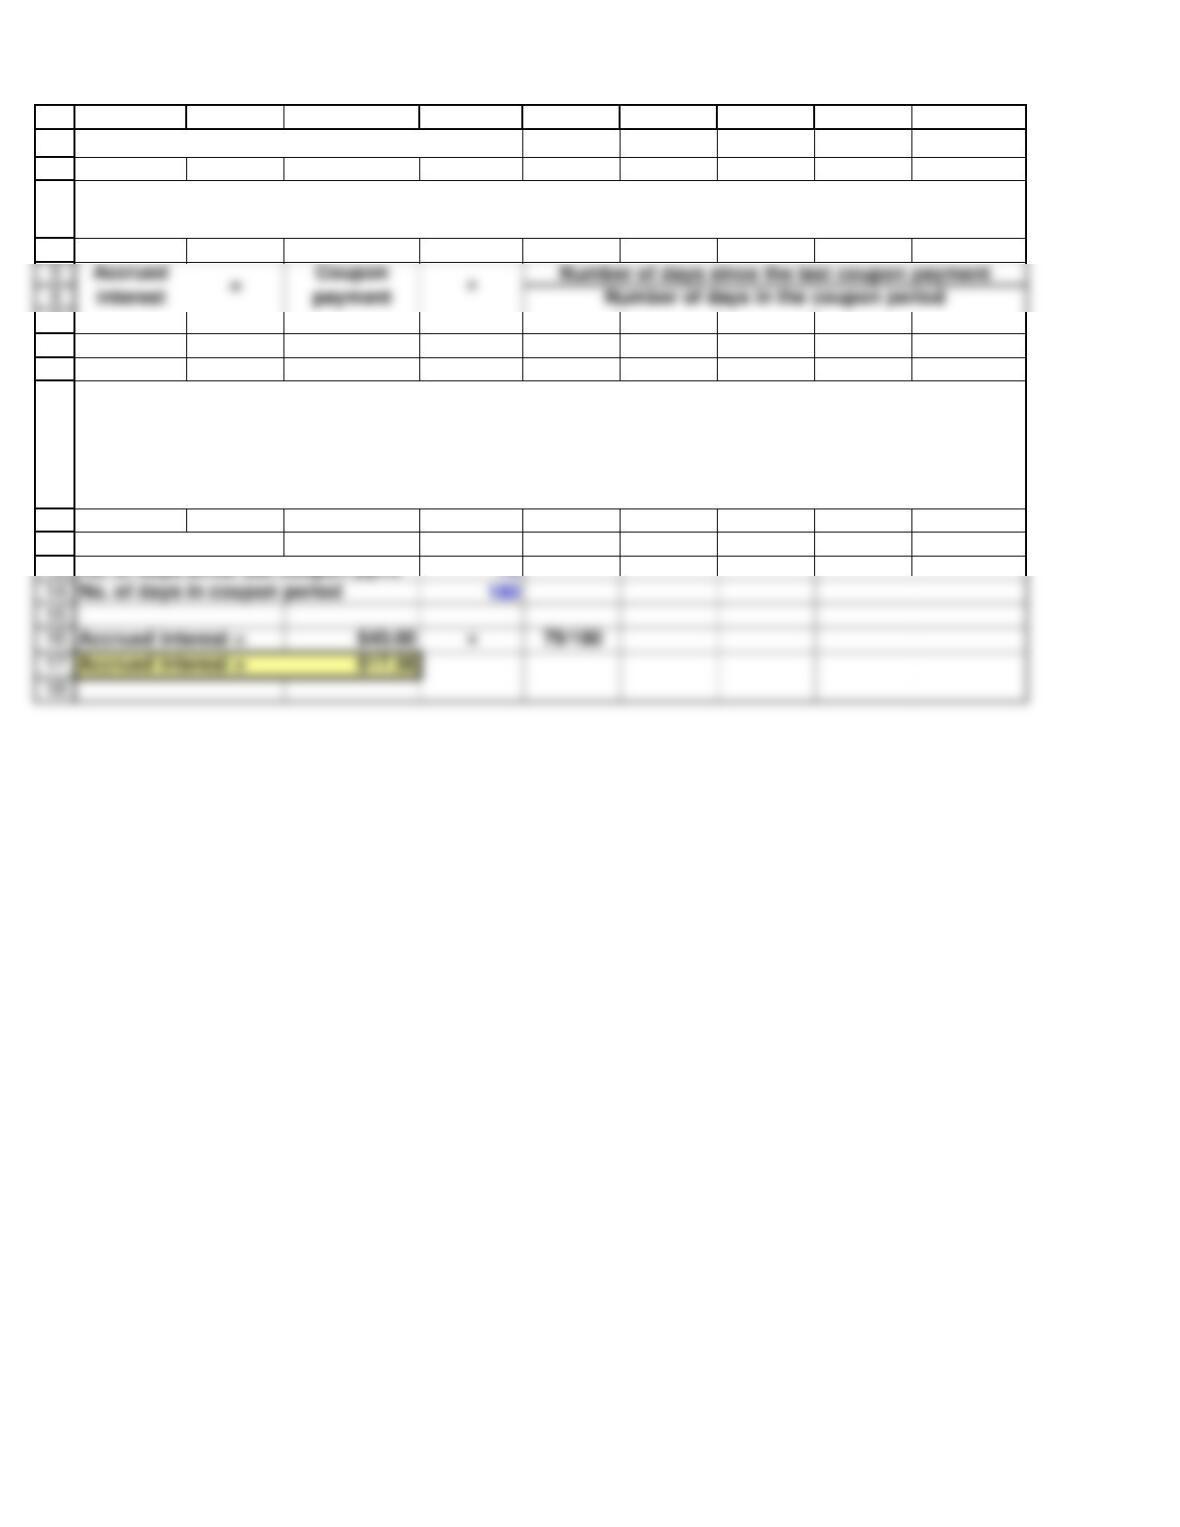
No. of days in coupon period 180
1
2
3
4
7
8
9
10
11
12
13
A B C D E F G H I
CALCULATION OF ACCRUED INTEREST 12/12/2018
EXAMPLE
Coupon payment $40.00
No. of days since last coupon pymt 79
Accrued interest represents the amount of interest that has accumulated between coupon payments,
and it can be calculated as follows:
A 10-year corporate bond that was issued on May 31, 2018. The bond has an 8% semiannual coupon
and a par value of $1,000–which means 6 months later on November 30, 2018, the bond will pay its first
$40 coupon, and on May 31, 2019, it will pay its second $40 coupon. If you buy the bond on August 19,
2019 (79 days since the bond’s last coupon payment on May 31), how much will you have to pay the
seller in accrued interest?
19
20
21
22
23
24
25
26
27
28
29
30
31
32
33
34
35
36
37
38
39
40
41
42
43
44
45
46
47
48
49
50
51
52
53
54
55
56
57
58
59
60
61
62
63
64
65
66
A B C D E F G H I
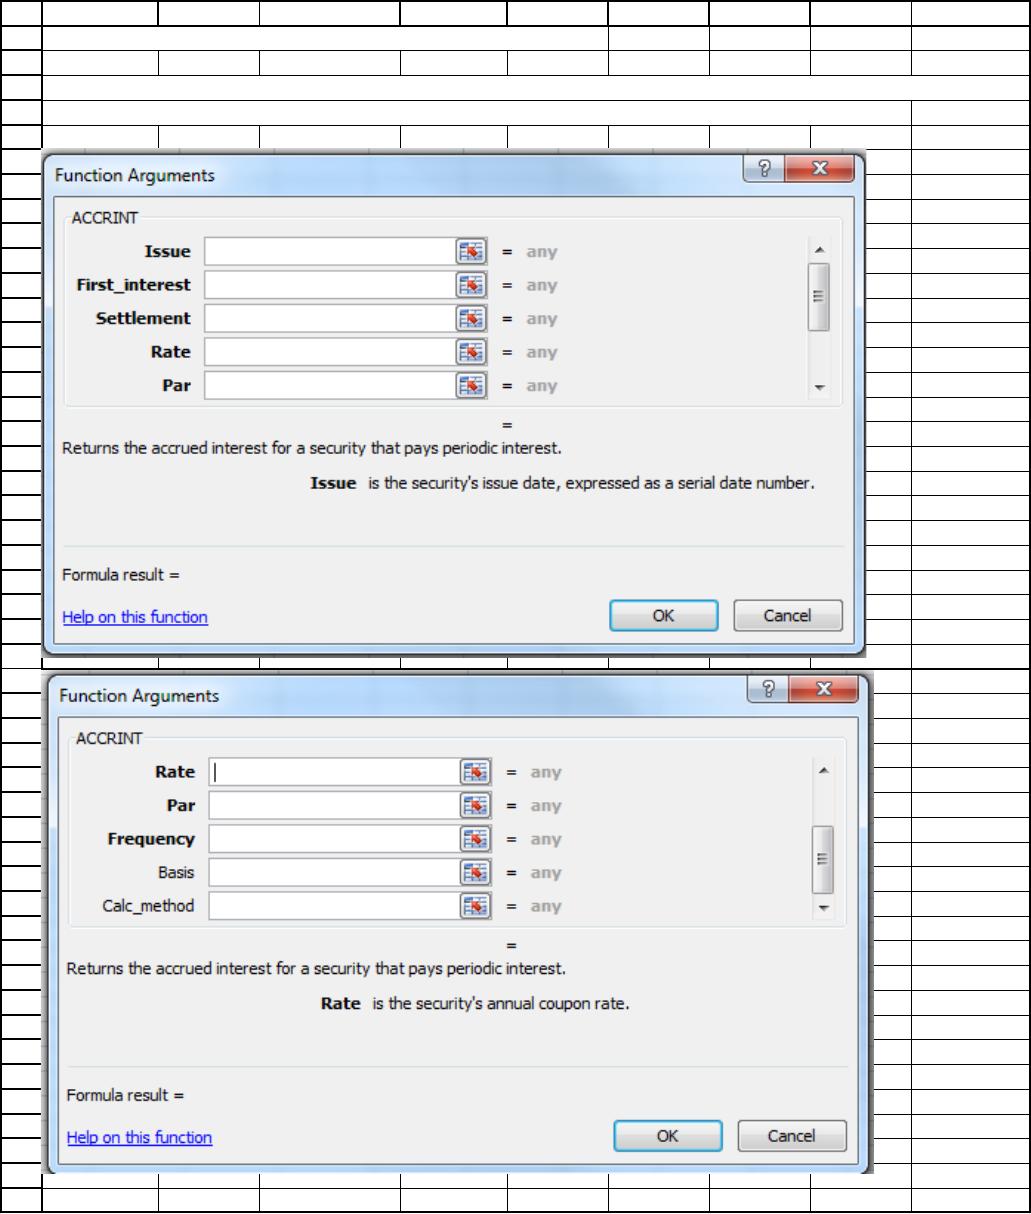
CALCULATION WITH EXCELFUNCTION, ACCRINT
You can also use Excel’s Accrued Interest Function to easily calculate a bond’s accrued interest.
The format is shown below (the number of inputs requires 2 images to show them all):
67
68
69
70
71
72
73
74
75
76
A B C D E F G H I
KEY INPUTS
Bond’s issue date 43,616 Issue date, 5/31/19, expressed as serial number
First interest date 43,799 First interest date, 11/30/19, expressed as serial number
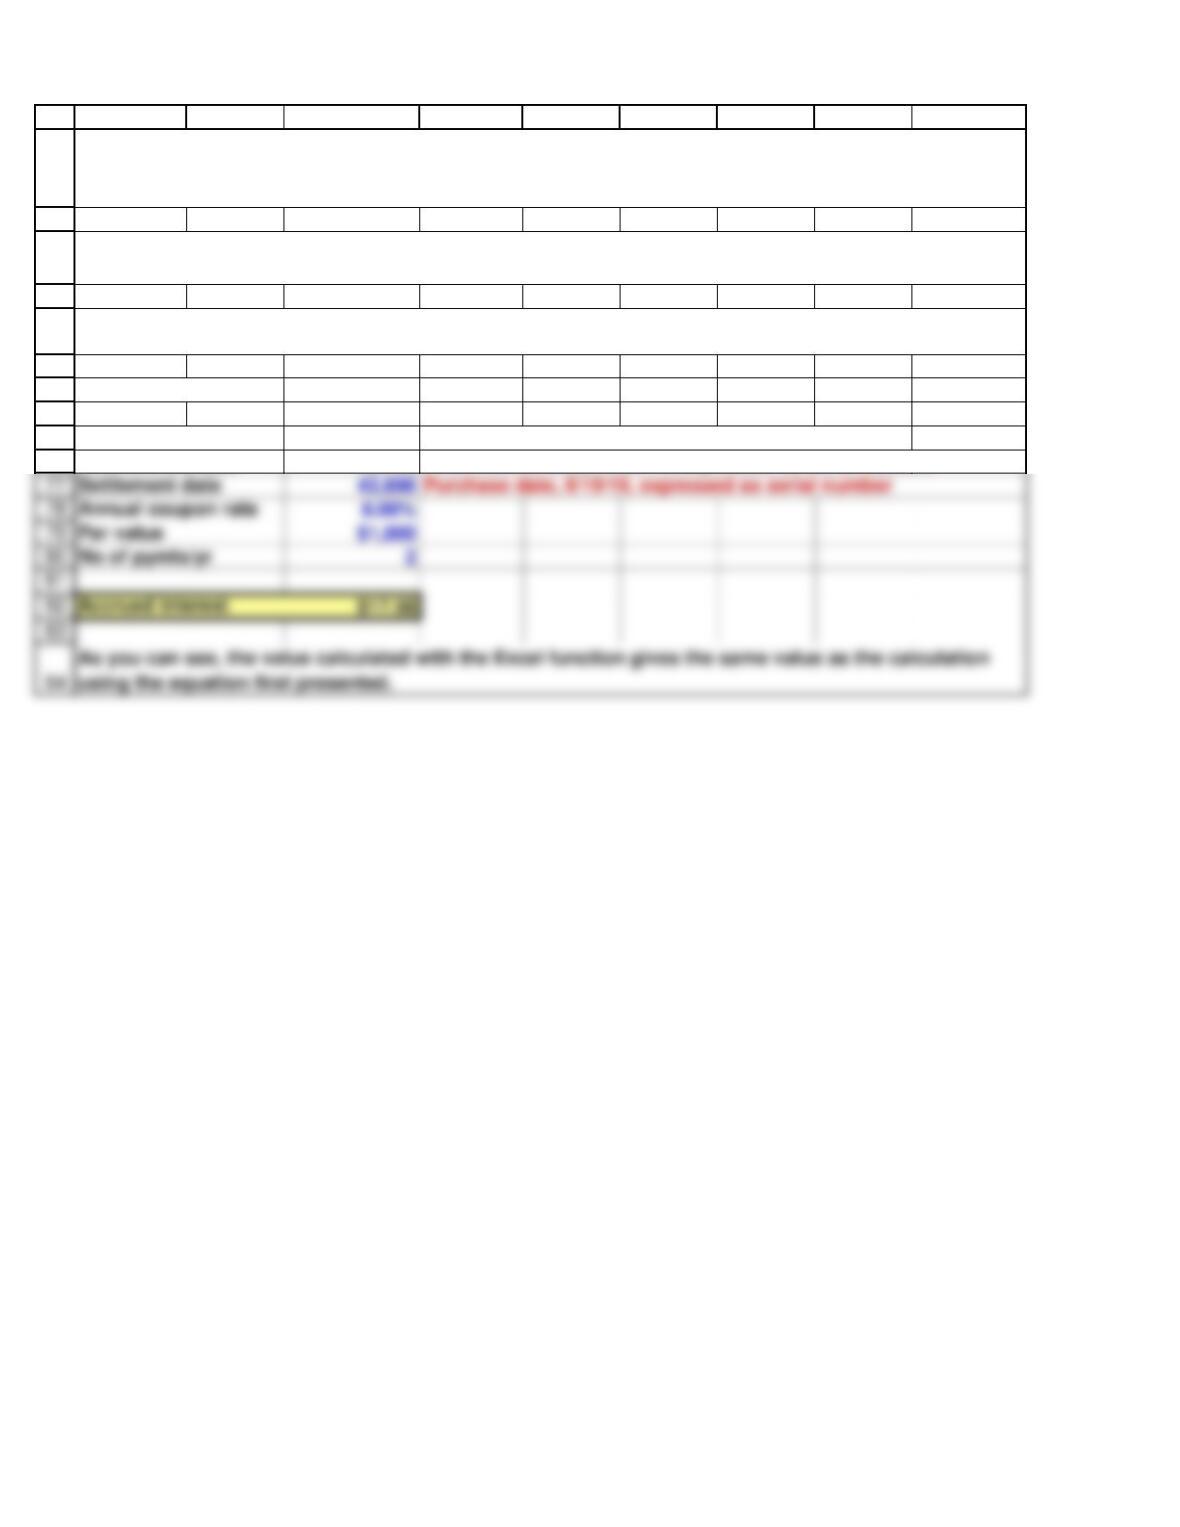
If the value for basis is left blank, the assumptions are a 30-day month and a 360-day year. If 1 is
entered here, then the assumptions are the actual number of days in the month and the actual number
of days in the year.
No value is entered for Calc_method because the “settlement” date or purchase date is before the first
interest date.
If you have any questions regarding the inputs for this function, simply click on the “Help on this
function” at the bottom of the function’s dialog box (as shown on the image above).
Settlement date 43,696 Purchase date, 8/19/19, expressed as serial number
Annual coupon rate 8.00%
Par value $1,000
No of pymts/yr 2
using the equation first presented.
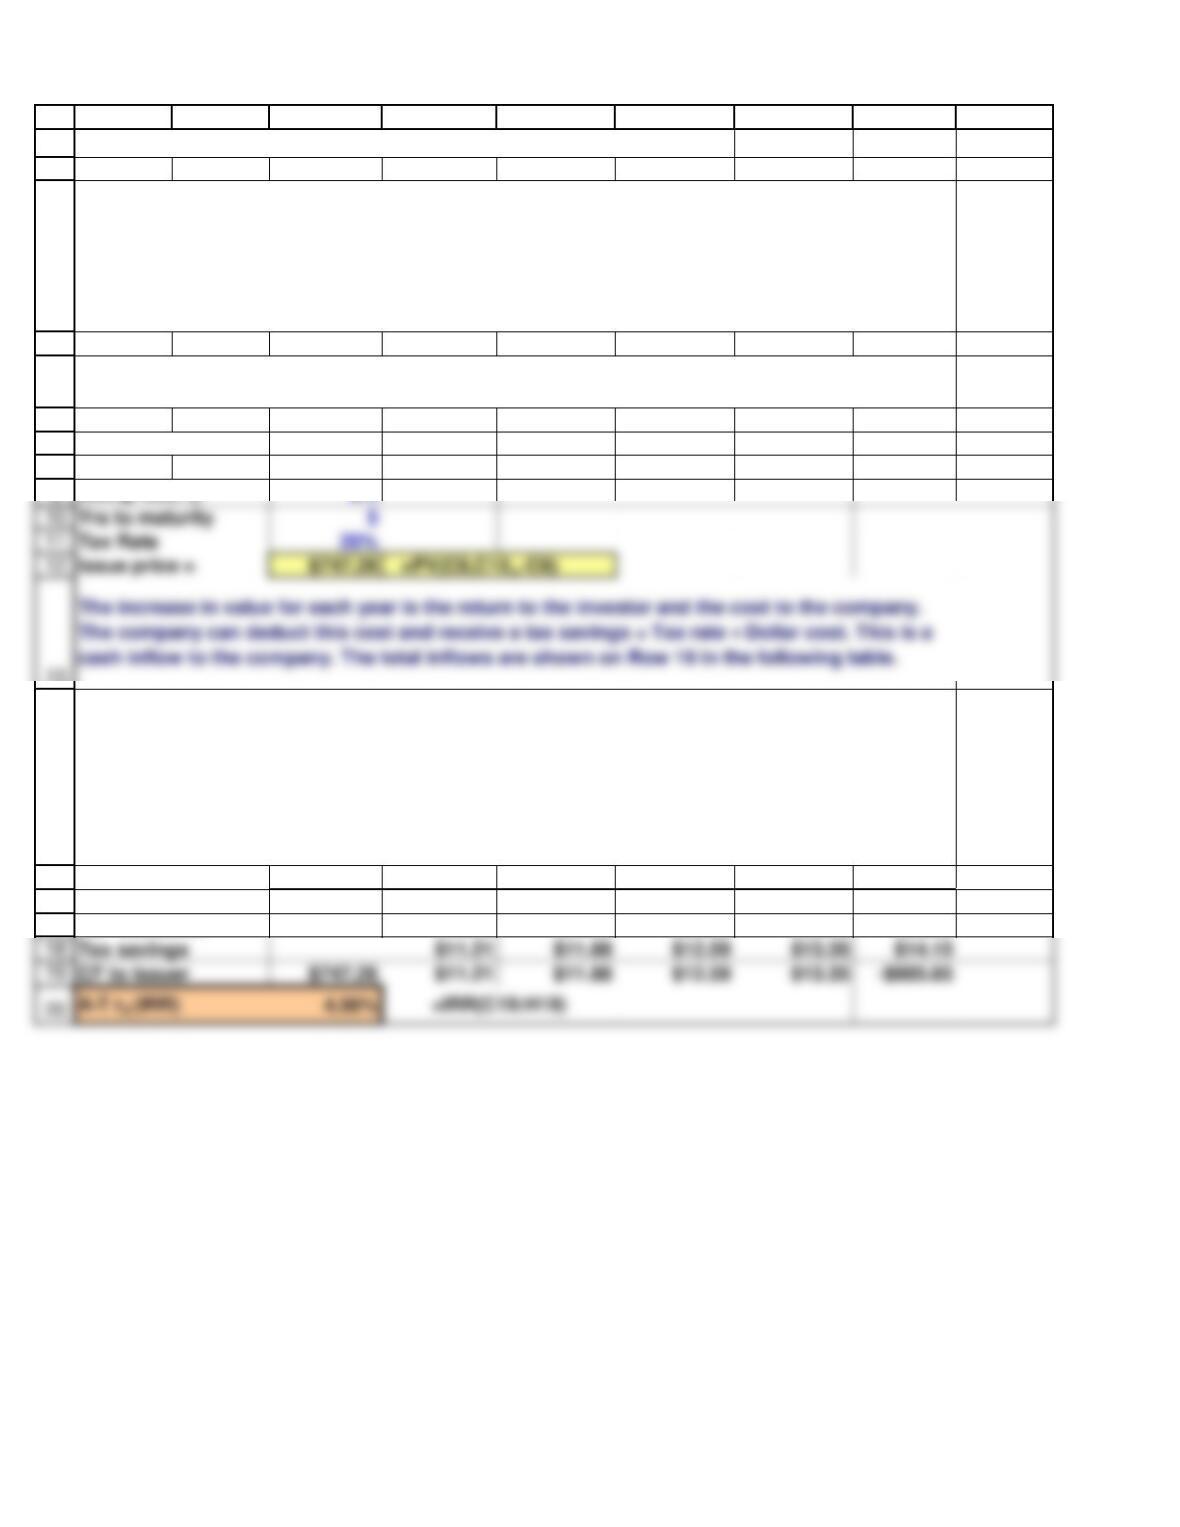
Tax savings $11.21 $11.88 $12.59 $13.35 $14.15
1
2
3
4
5
6
7
8
13
14
15
16
17
A B C D E F G H I
WEB APPENDIX 7A: ANALYSIS OF A ZERO COUPON BOND 12/12/2018
Basic data
Par value $1,000
Going rate, rd6%
Time period 0 1 2 3 4 5
Accrued value $747.26 $792.09 $839.62 $890.00 $943.40 $1,000.00
Int. deduction $44.84 $47.53 $50.38 $53.40 $56.60
Vandenburg Corporation needs $50 million to finance a project, and it has decided to raise the
funds by issuing $1,000 par value, zero coupon bonds that mature in 5 years. The going
interest rate on such debt is 6%, and the corporate tax rate is 25%. Find the issue price of
Vandenburg’s bonds, construct a table to analyze the cash flows attributable to one of the
bonds, and determine the issue’s after-tax cost of debt. Then, indicate the total par value of the
issue.
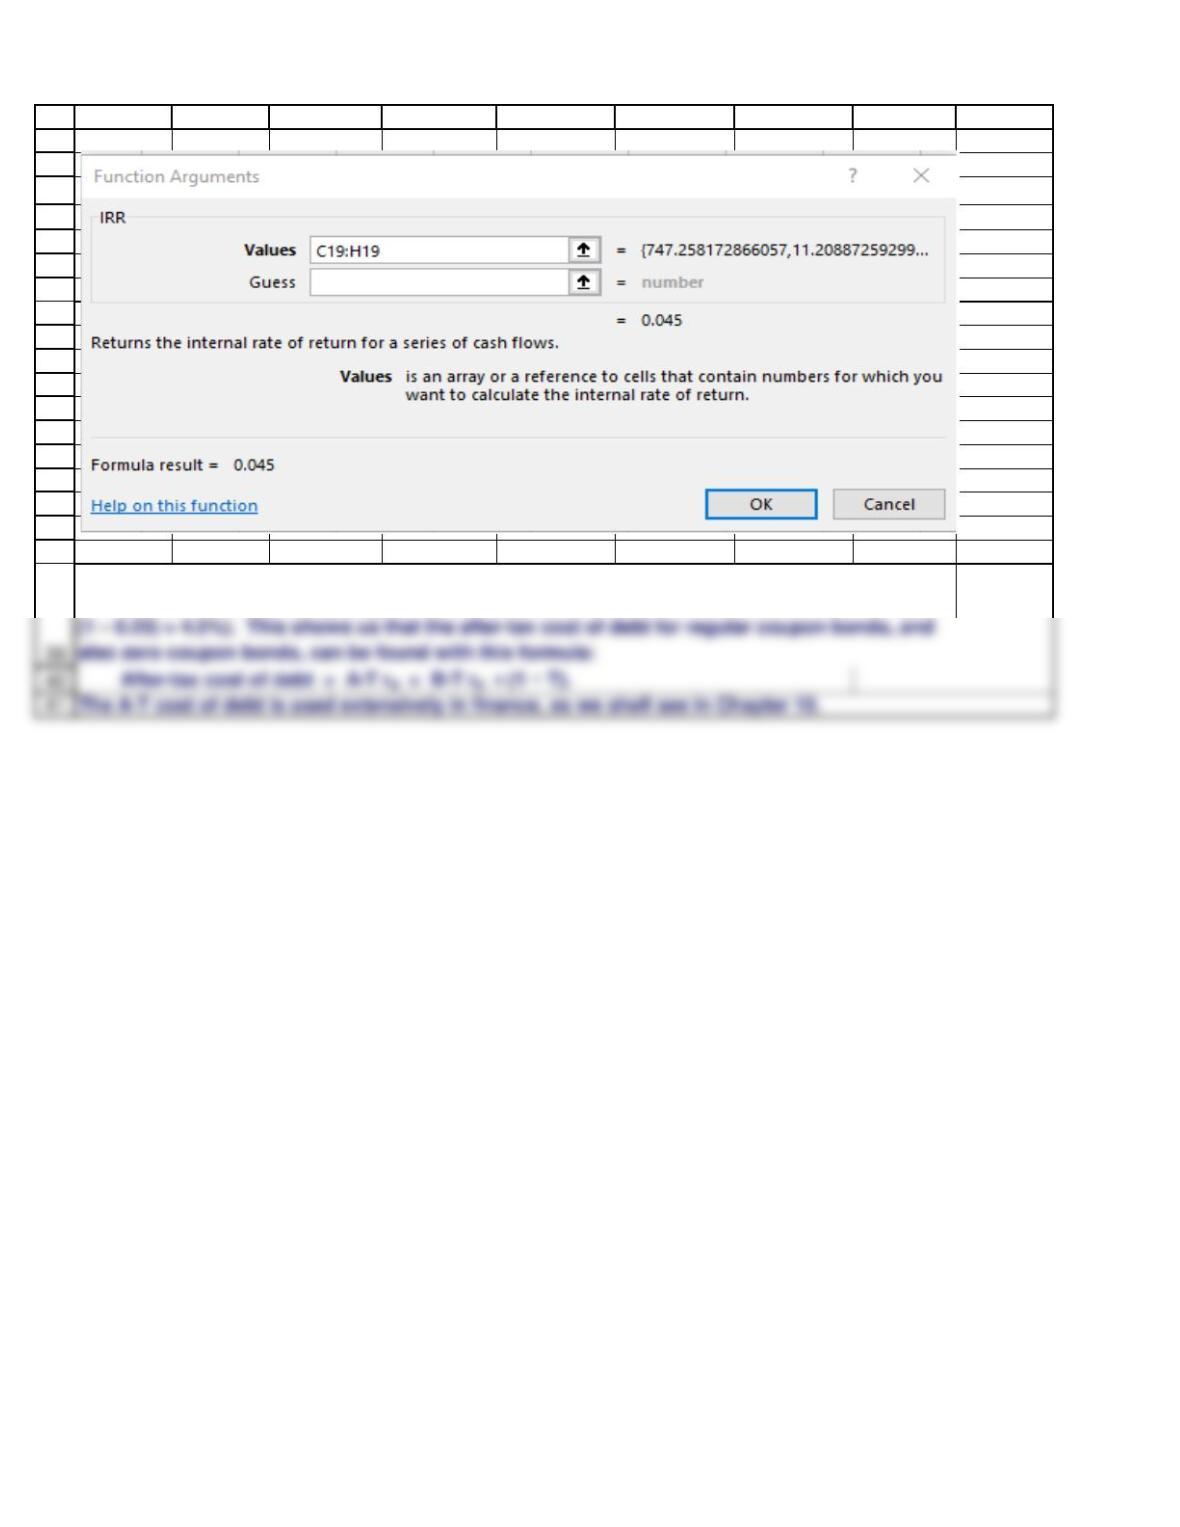
Set up the cash flow table as shown below. Then, use Excel’s IRR function to find the after-tax
cost of debt.
The after-tax cost of the bonds is found by taking the IRR of the pertinent cash flows. The IRR,
or “Internal Rate of Return,” is discussed in detail in Chapter 11, but it is simply the interest rate
that forces the net present value of a series of cash flows to zero. The IRR can be calculated by
accessing the function wizard, fx, on the Formulas tab. The IRR function can be found in the
list of Financial functions. You must enter the range for the cash flows. If you want, you can
make a guess as to the IRR, but that is not necessary. The completed IRR menu is shown
below.
Yrs to maturity 5
Tax Rate 25%
Issue price = $747.26 =PV(C9,C10,,-C8)
21
22
23
24
25
26
27
28
29
30
31
32
33
34
35
36
37
38
A B C D E F G H I
The after-tax cost of debt, 4.5%, as calculated with the IRR function is the same as the after-tax
cost of debt found by multiplying the before-tax cost of debt times one minus the tax rate, (6% ×
1
2
3
4
5
6
7
8
9
13
14
15
16
17
18
19
20
26
27
28
29
30
31
32
A B C D E F G H I
WEB APPENDIX 7B: BOND RISK AND DURATION 12/12/2018
Basic data
Yrs to maturity = N 20
Going rate, rd = I/YR 9%
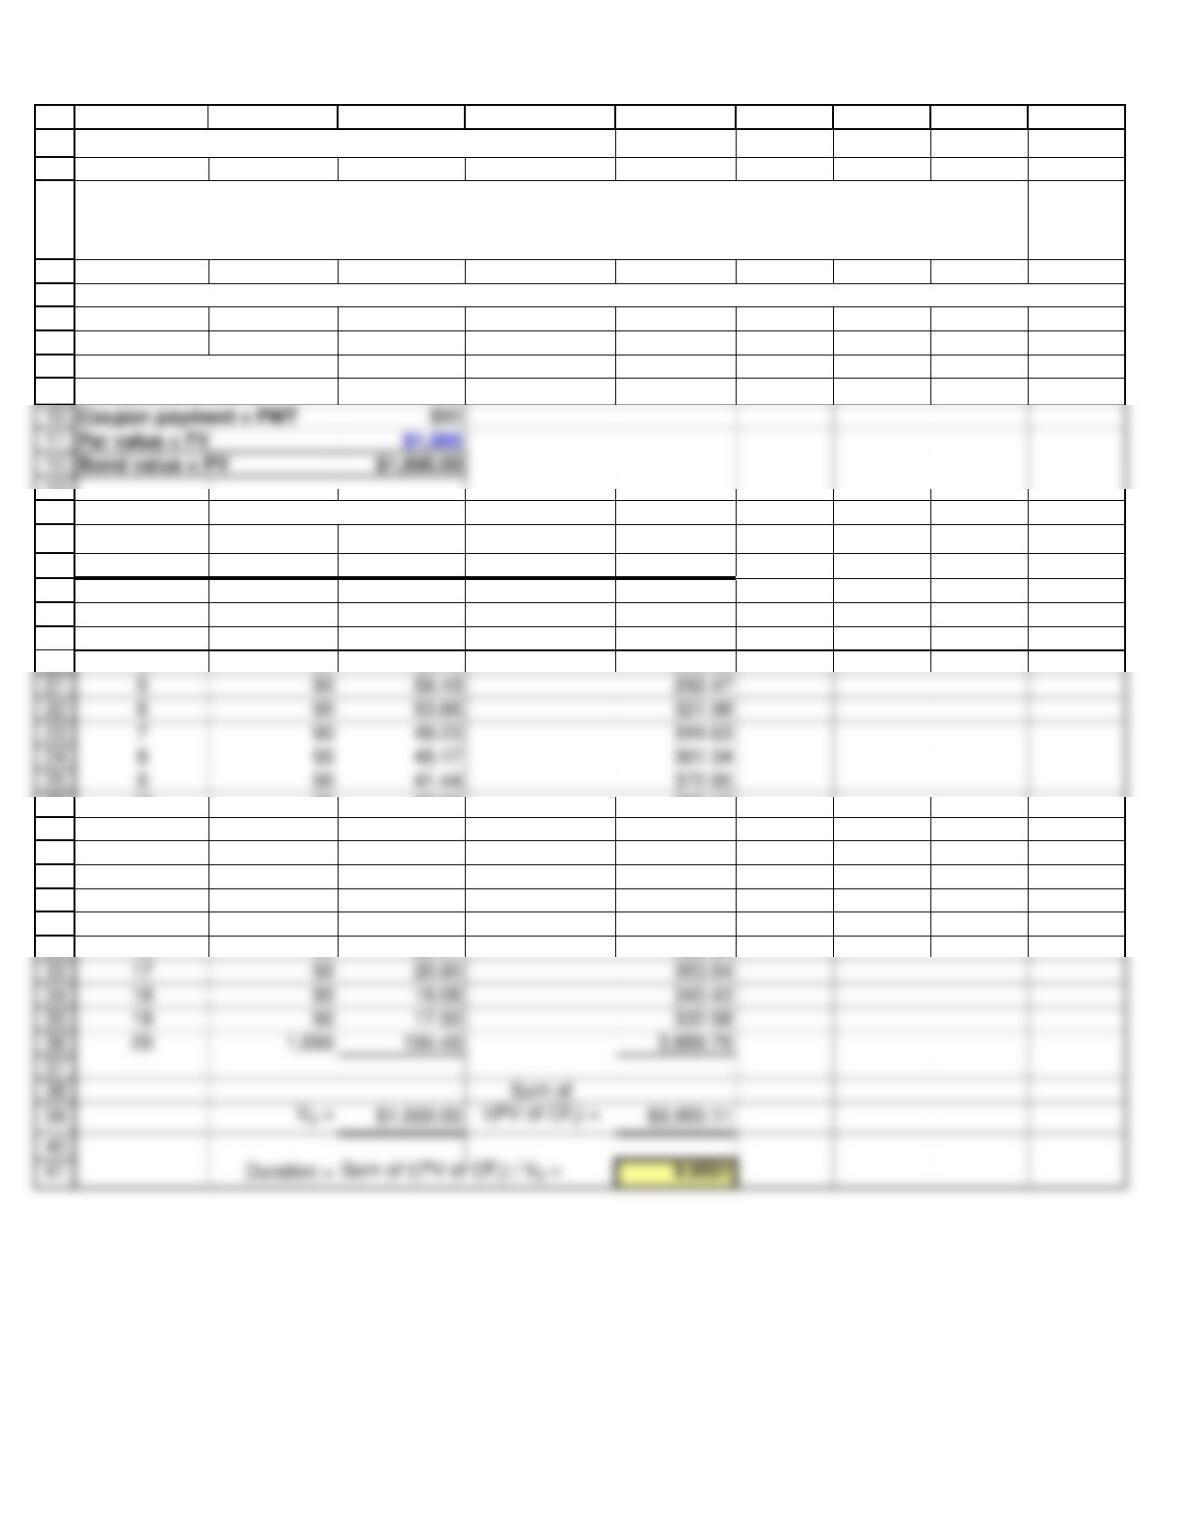
TABLE 7B.1. Calculation of Duration
t
CFtPV of CFtt(PV of CFt)
(1) (2) (3) (4)
1$90 $82.57 $82.57
290 75.75 151.50
390 69.50 208.49
490 63.76 255.03
10 90 38.02 380.17
11 90 34.88 383.66
12 90 32.00 383.98
13 90 29.36 381.63
14 90 26.93 377.05
15 90 24.71 370.63
16 90 22.67 362.69
The setup to calculate this bond’s duration is shown below:
You have invested in a 20-year, 9% annual coupon bond that currently sells at its par value of $1,000. It
provides cash flows of $90 per year for 19 years and a cash flow of $1,090 in the 20th year. What is this
bond’s duration?
Coupon payment = PMT $90
Par value = FV $1,000
Bond value = PV $1,000.00