Chapter 7
PRODUCTION ANALYSIS AND COMPENSATION POLICY
QUESTIONS AND ANSWERS
Q7.1 Is use of least-cost input combinations a necessary condition for profit maximization? Is
it a sufficient condition? Explain.
Q7.1 ANSWER
Employment of least-cost input combinations is a necessary but not sufficient condition
for profit maximization. It is necessary because a failure to operate with a least-cost
input combination means that costs could be lowered and profits increased at any given
Q7.2 “Output per worker is expected to increase by 10 percent during the next year.
Therefore, wages can also increase by 10 percent with no harmful effects on
employment, output prices, or employer profits.” Discuss this statement.
Q7.2 ANSWER
This statement is correct so long as the projected increase in output per worker is solely
due to an improvement in labor productivity and provided that the demand for output is
also expected to rise. Gains in labor productivity are sometimes derived from an
Production Analysis and Compensation Policy 169
Q7.3 Commission-based and piece-rate-based compensation plans are commonly employed
by businesses. Use the concepts developed in the chapter to explain these phenomena.
Q7.3 ANSWER
Commission-based and piece rate-based compensation plans ensure that the relevant
Q7.4 “Hourly wage rates are an anachronism. Efficiency requires incentive-based pay tied
to performance.” Discuss this statement.
Q7.4 ANSWER
Given that many successful firms use hourly wage rates, it seems rash to dismiss them as
an inefficient method for employee compensation. When hourly wages are paid,
Q7.5 Explain why the MP/P relation is deficient as the sole mechanism for determining the
optimal level of resource employment.
Q7.5 ANSWER
The equality of the MP/P ratio across input factors in a production system is necessary
170 Chapter 7
Q7.6 Clarify how profits are maximized and the optimal level of employment is achieved in a
competitive labor market when the price of labor PL = MRPL.
Q7.6 ANSWER
The MRPL represents the value created by each additional worker, and represents net
marginal revenue considering all costs except wages. In a competitive labor market, the
Q7.7 “Oregon’s minimum wage increased from $4.75 in 1996 to $5.50 in 1997, to $6 in 1998,
and to $6.50 in 1999. According to a study by the Oregon Center for Public Policy, the
minimum wage increases in Oregon did not harm welfare recipients’ opportunities to
find work. In fact, a larger percentage of welfare recipients in Oregon found jobs after
the minimum wage increased than before the increases.” Discuss how these facts could
be consistent with a downward-sloping demand curve for unskilled labor.
Q7.7 ANSWER
It is interesting to note that sharp increases in the Oregon state minimum wage during
the late-1990s had little apparent effect on the ability of welfare recipients to find new
higher-pay job opportunities. While perhaps surprising, these facts are entirely
Q7.8 Powerful unions like the AFL-CIO are staunch advocates for increasing the federal
minimum wage despite the fact that highly-trained and experienced AFL-CIO workers
Production Analysis and Compensation Policy 171
tend to earn far more than the minimum wage. Can you give an economic rationale for
the AFL-CIO’s position?
Q7.8 ANSWER
Higher Federal minimum wages increase the number of workers willing to work, but
decrease the number of workers employers are willing to hire. Raising wages by
governmental edict creates a surplus of labor, or unemployment. Ample empirical
Q7.9 Cite some ways for increasing productivity growth in the United States.
Q7.9 ANSWER
During the 2000-05 period, the pace of annual increase in productivity in the United
States averaged 3.1 percent, a big jump from the 1.4 percent annual rate common during
the 1973-1995 period. This burst in U.S. productivity growth is greater than in many
advanced industrial economies.
172 Chapter 7
Q7.10 Explain why company productivity is important to managers, employees, and investors.
Is superior worker productivity a necessary and sufficient condition for above-average
compensation?
Q7.10 ANSWER
For managers and other employees, profits and revenues per employee give helpful
insight concerning the income potential from employment. When profits and revenues
per employee are high, the potential for high wages and growing incomes for
exceptional employees can be significant. On the other hand, companies in industries
SELF-TEST PROBLEMS AND SOLUTIONS
ST7.1 Optimal Input Usage. Medical Testing Labs, Inc., provides routine testing services for
blood banks in the Los Angeles area. Tests are supervised by skilled technicians using
equipment produced by two leading competitors in the medical equipment industry.
Records for the current year show an average of 27 tests per hour being performed on
the Testlogic-1 and 48 tests per hour on a new machine, the Accutest-3. The Testlogic–1
Production Analysis and Compensation Policy 173
is leased for $18,000 per month, and the Accutest-3 is leased at $32,000 per month. On
average, each machine is operated 25 eight-hour days per month.
A. Describe the logic of the rule used to determine an optimal mix of input usage.
B. Does Medical Testing Lab usage reflect an optimal mix of testing equipment?
C. Describe the logic of the rule used to determine an optimal level of input usage.
D. If tests are conducted at a price of $6 each while labor and all other costs are
fixed, should the company lease more machines?
ST7.1 SOLUTION
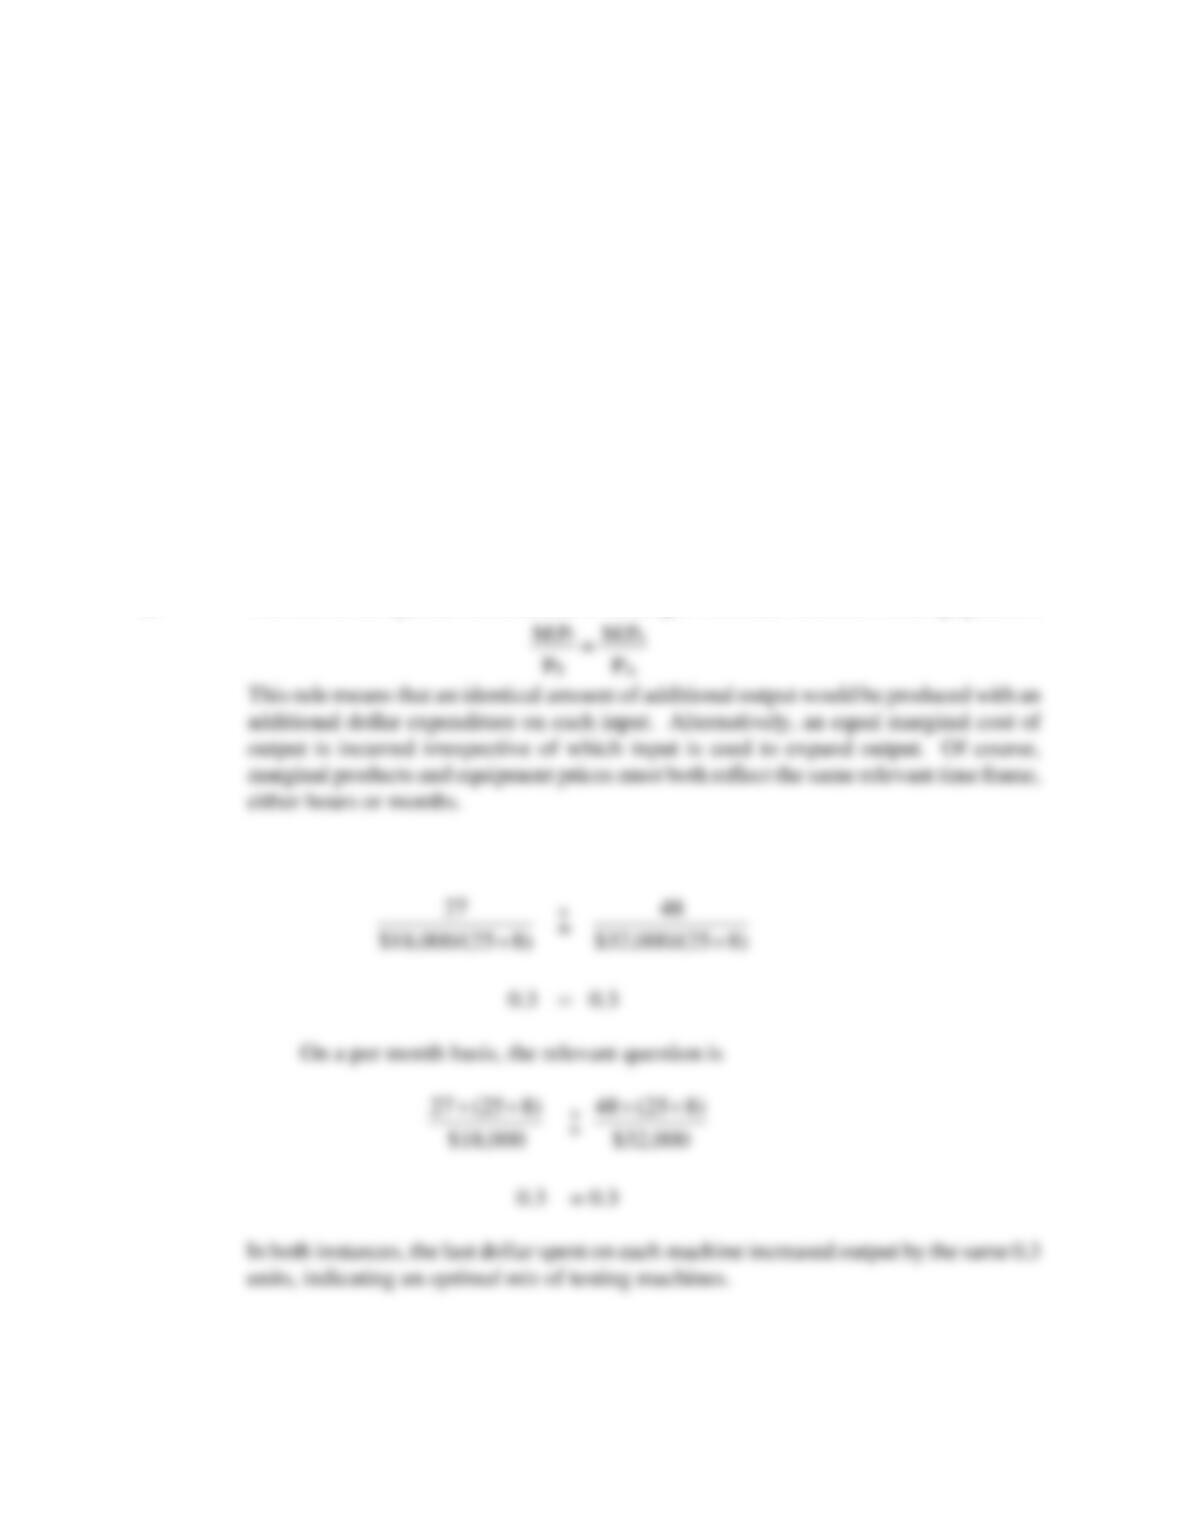
A. The rule for an optimal combination of Testlogic-1 (T) and Accutest-3 (A) equipment is
B. On a per hour basis, the relevant question is
C. The rule for optimal input employment is

174 Chapter 7
D. For each machine hour, the relevant question is
Testlogic-1
Or, in per month terms:
Testlogic-1
Production Analysis and Compensation Policy 175
ST7.2 Production Function Estimation. Washington-Pacific, Inc., manufactures and sells
lumber, plywood, veneer, particle board, medium-density fiberboard, and laminated
beams. The company has estimated the following multiplicative production function for
basic lumber products in the Pacific Northwest market using monthly production data
over the past two and one-half years (30 observations):
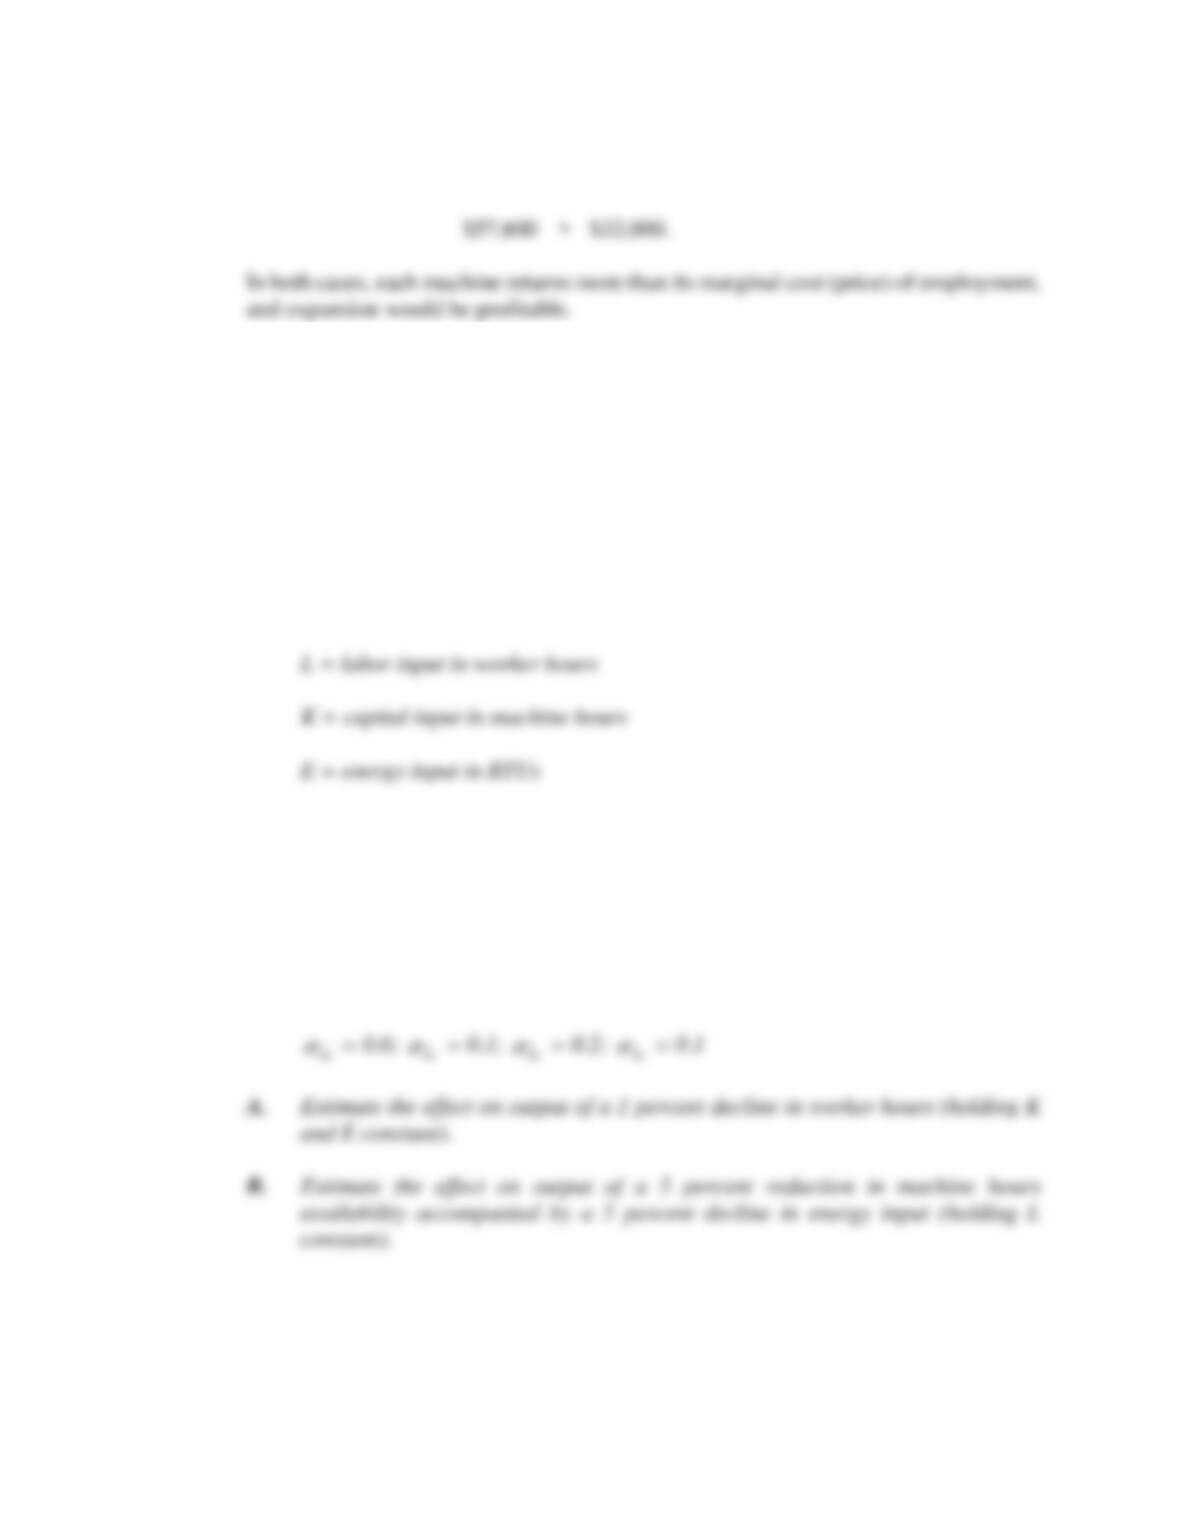
where
Q = output
Each of the parameters of this model was estimated by regression analysis using
monthly data over a recent three-year period. Coefficient estimation results were as
follows:
b0
ˆ
= 0.9;
b1
ˆ
= 0.4;
b2
ˆ
= 0.4; and
b3
ˆ
= 0.2
The standard error estimates for each coefficient are:
C. Estimate the returns to scale for this production system.
ST7.2 SOLUTION
EKL
b
= Q bbb
0321
176 Chapter 7
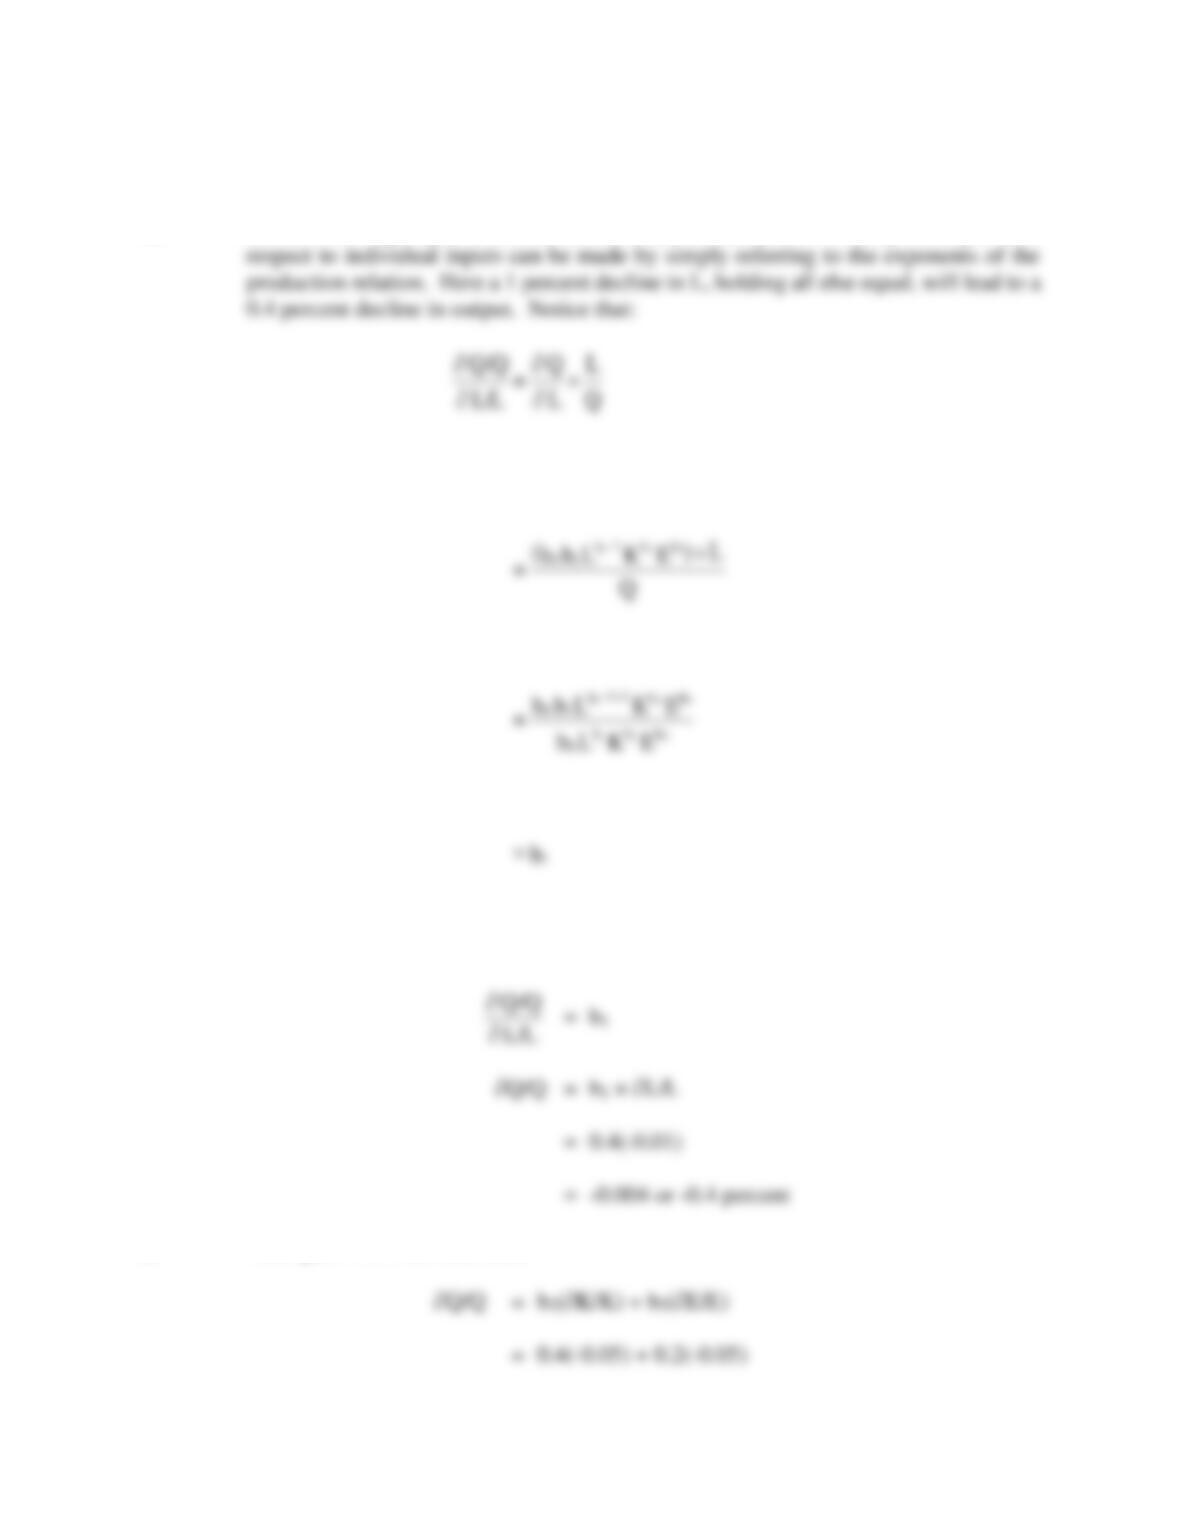
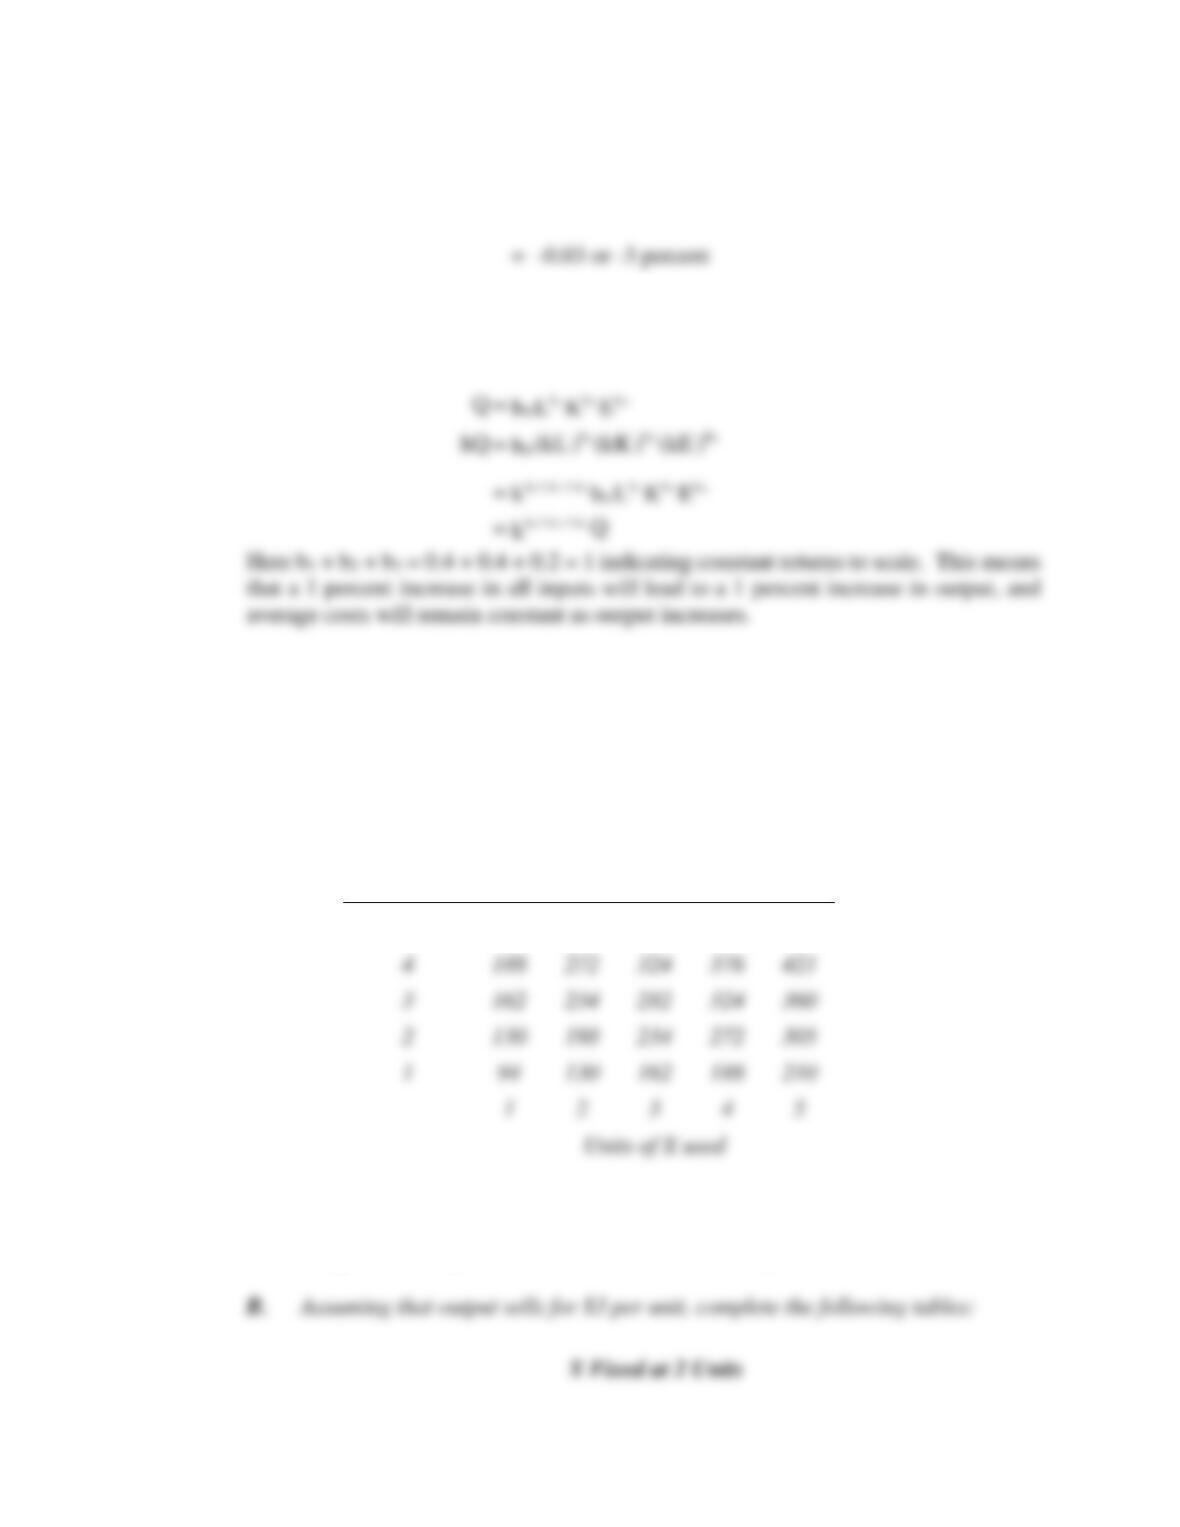
A. For Cobb-Douglas production functions, calculations of the elasticity of output with
And because (∂Q/Q)/( ∂L/L) is the percent change in Q due to a 1 percent change in L,
B. From part A it is obvious that:
Production Analysis and Compensation Policy 177
C. In the case of Cobb-Douglas production functions, returns to scale are determined by
simply summing exponents because:
PROBLEMS AND SOLUTIONS
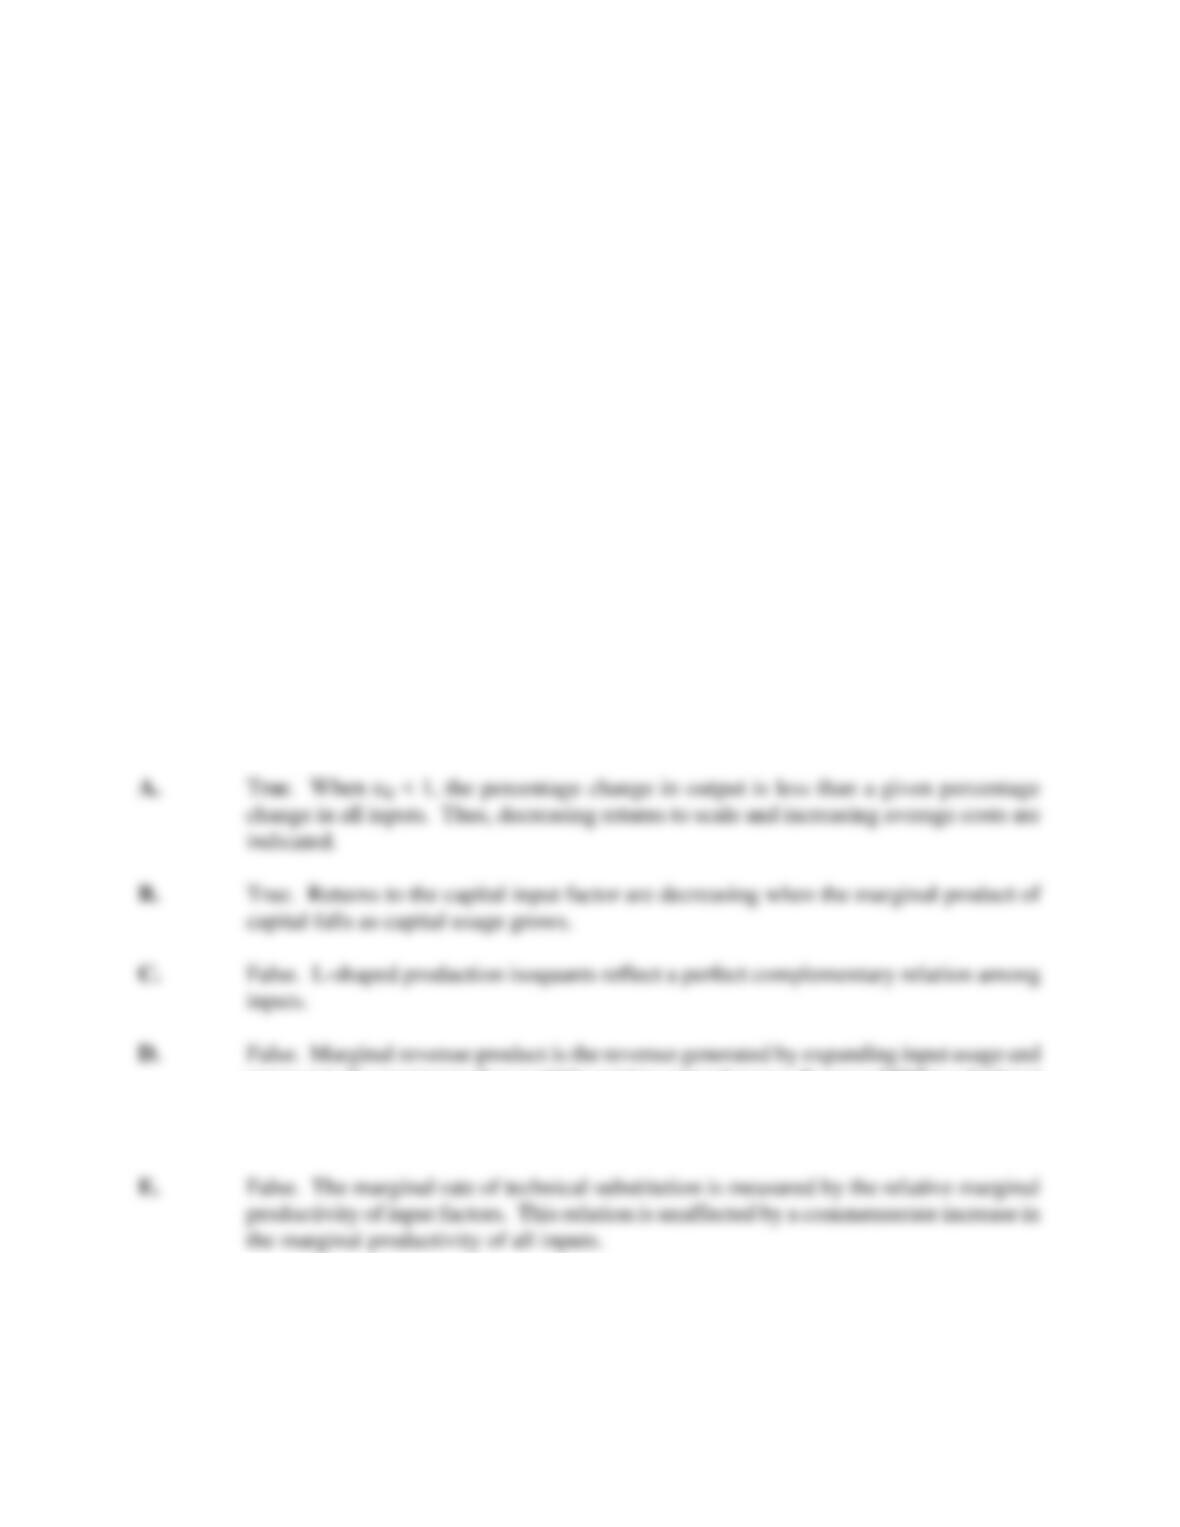
P7.1 Marginal Rate of Technical Substitution. The following production table gives
estimates of the maximum amounts of output possible with different combinations of two
input factors, X and Y. (Assume that these are just illustrative points on a spectrum of
continuous input combinations.)
Units of
Y Used
Estimated Output per Day
5
210
305
360
421
470
A. Do the two inputs exhibit the characteristics of constant, increasing, or decreasing
marginal rates of technical substitution? How do you know?

178 Chapter 7
Units of
Y Used
Total
Product
of Y
Marginal
Product
of Y
Average
Product
of Y
Marginal
Revenue
Product
of Y
1
Y Fixed at 3 Units
Units of
X Used
Total
Product
of X
Marginal
Product
of X
Average
Product
of X
Marginal
Revenue
Product
of X
1
2
3
5
C. Assume that the quantity of X is fixed at 2 units. If output sells for $3 and the cost
of Y is $120 per day, how many units of Y will be employed?
D. Assume that the company is currently producing 162 units of output per day using
1 unit of X and 3 units of Y. The daily cost per unit of X is $120 and that of Y is
also $120. Would you recommend a change in the present input combination?
Why or why not?
P7.1 SOLUTION
A. The inputs exhibit the characteristic of a decreasing marginal rate of technical
B.
2
3
4
5

Production Analysis and Compensation Policy 179
X Fixed at 2 Units
Units of
Y Employed
TPY
(1)
MPY
(2)
APY
(3)
MRPY
(4) = $3 × (2)
1
130
130
130
$390
Y Fixed at 3 Units
Units of
X Employed
TPX
(1)
MPX
(2)
APX
(3)
MRPX
(4) = $3 × (2)
1
162
162
162
$486
D. A change would be in order because the firm could produce 188 units at the same cost
E. The system exhibits constant returns to scale. This is true because a given increase in
both inputs causes an increase in output of the same proportion.
X
Y
Output
1
1
94 × 1 = 94
5
5
180 Chapter 7
P7.2 Production Function Concepts. Indicate whether each of the following statements is
true or false. Explain your answers.
A. Decreasing returns to scale and increasing average costs are indicated when
εQ < 1.
B. If the marginal product of capital falls as capital usage grows, the returns to
capital are decreasing.
C. L-shaped isoquants describe production systems in which inputs are perfect
substitutes.
D. Marginal revenue product measures the profit earned through expanding input
usage.
E. The marginal rate of technical substitution will be affected by a given percentage
increase in the marginal productivity of all inputs.
P7.2 SOLUTION
represents the maximum that could be paid to expand usage. Because MRP is calculated
before input costs (wages in the case of labor, for example), it does not measure the
increase in profit earned through expansion.
P7.3 Compensation Policy. “Pay for performance” means that employee compensation
closely reflects the amount of value derived from each employee’s effort. In economic
terms, the value derived from employee effort is measured by net marginal revenue
product. It is the amount of profit generated by the employee, before accounting for
Production Analysis and Compensation Policy 181
employment costs. Holding all else equal, indicate whether each of the following factors
would be responsible for increasing or decreasing the amount of money available for
employee merit-based pay.
A. Government mandates for employer-provided health insurance
B. Rising productivity due to better worker training
C. Rising employer sales due to falling imports
D. Falling prices for industry output
E. Rising prevalence of uniform employee stock options.
P7.3 SOLUTION
A. Decreasing. Government mandates for employer-provided health insurance increase the
costs of employment with no offsetting benefit in terms of increasing worker
productivity and thereby decrease the funds available for merit-based pay.
P7.4 Returns to Scale. Determine whether the following production functions exhibit
constant, increasing, or decreasing returns to scale.
A. Q = 0.5X + 2Y + 40Z
B. Q = 3L + 10K + 500
C. Q = 4A + 6B + 8AB
182 Chapter 7
D. Q = 7L2 + 5LK + 2K2
E. Q = 10L0.5K0.3
P7.4 SOLUTION
A. Initially, let X = Y = Z = 100, so output is:
B. Initially, let L = K = 100, so output is:
C. Initially, let A = B = 100, so output is:
D. Initially, let L = K = 100, so output is:
Production Analysis and Compensation Policy 183
E. Initially, let L = K = 100, so output is:
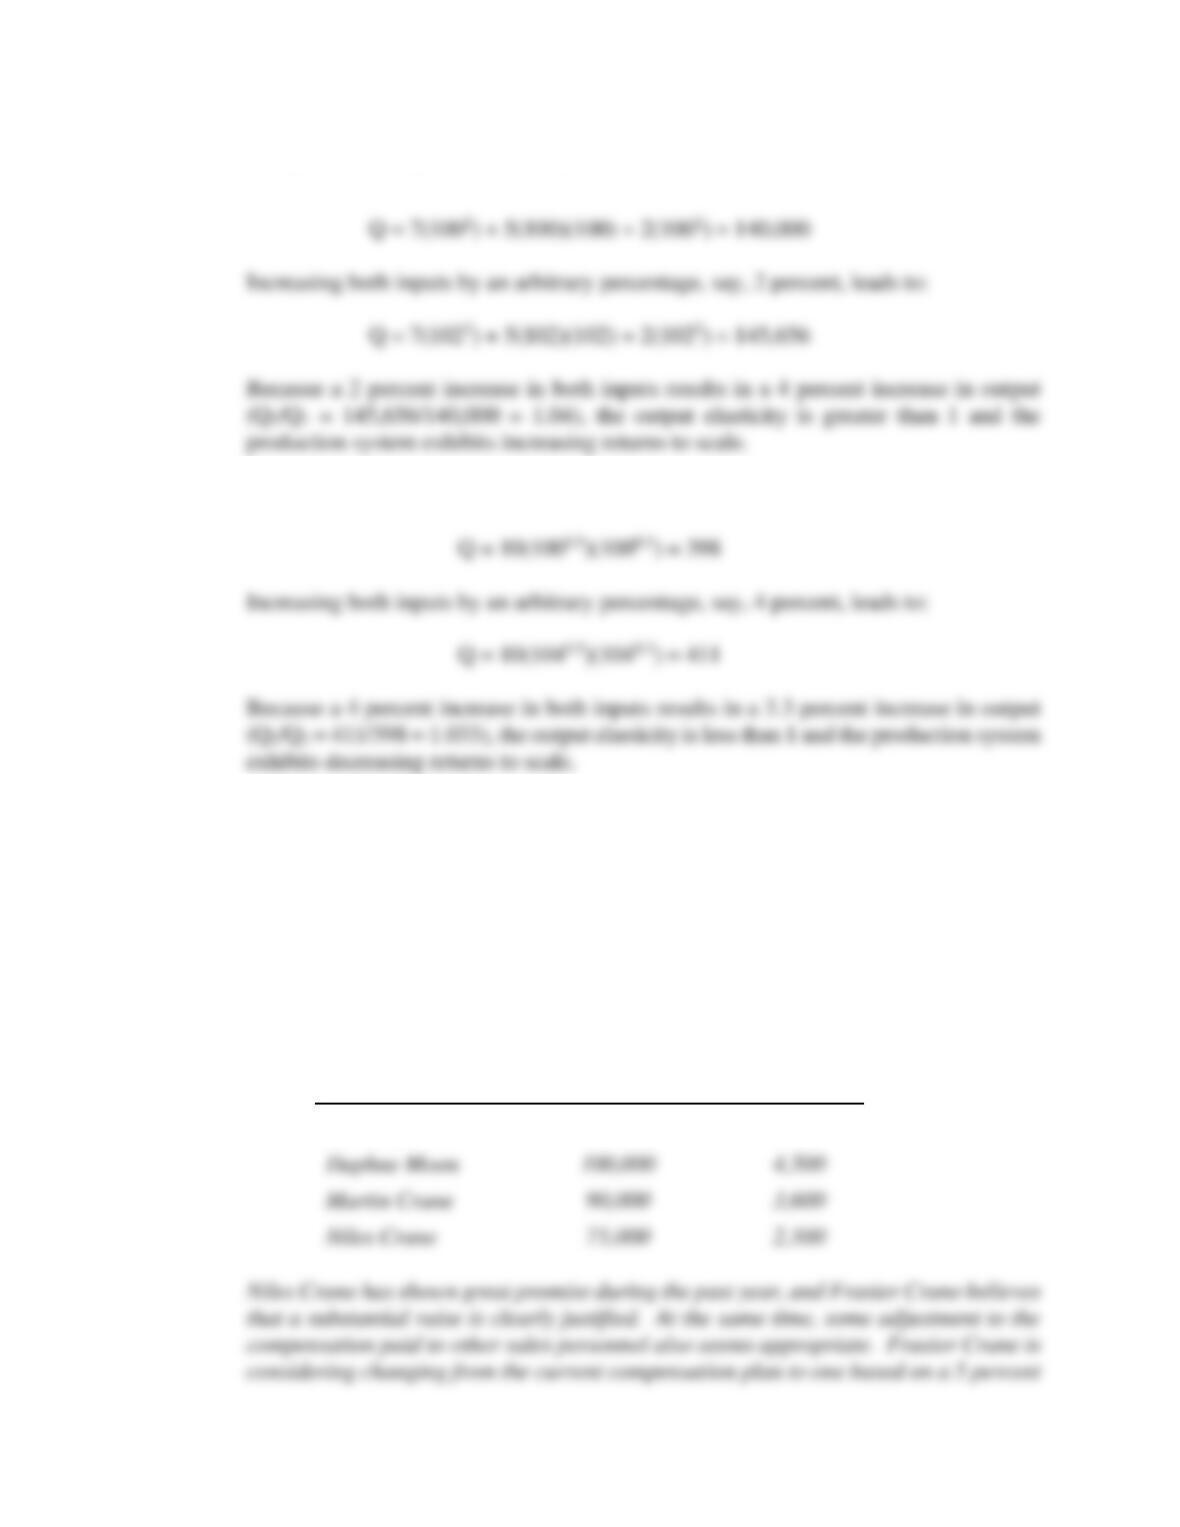
P7.5 Optimal Compensation Policy. Café-Nervosa.com, based in Seattle, Washington, is a
rapidly growing family business that offers a line of distinctive coffee products to local
and regional coffee shops. Assume founder and president Frasier Crane is reviewing
the company’s sales force compensation plan. Currently, the company pays its three
experienced sales staff members a salary based on years of service, past contributions to
the company, and so on. Niles Crane, a new sales trainee and brother of Frasier Crane,
is paid a more modest salary. Monthly sales and salary data for each employee are as
follows:
Sales Staff
Average Monthly
Sales
Monthly
Salary
Roz Doyle
$160,000
$6,000
184 Chapter 7
commission. He sees such a plan as being fairer to the parties involved and believes it
would also provide strong incentives for needed market expansion.
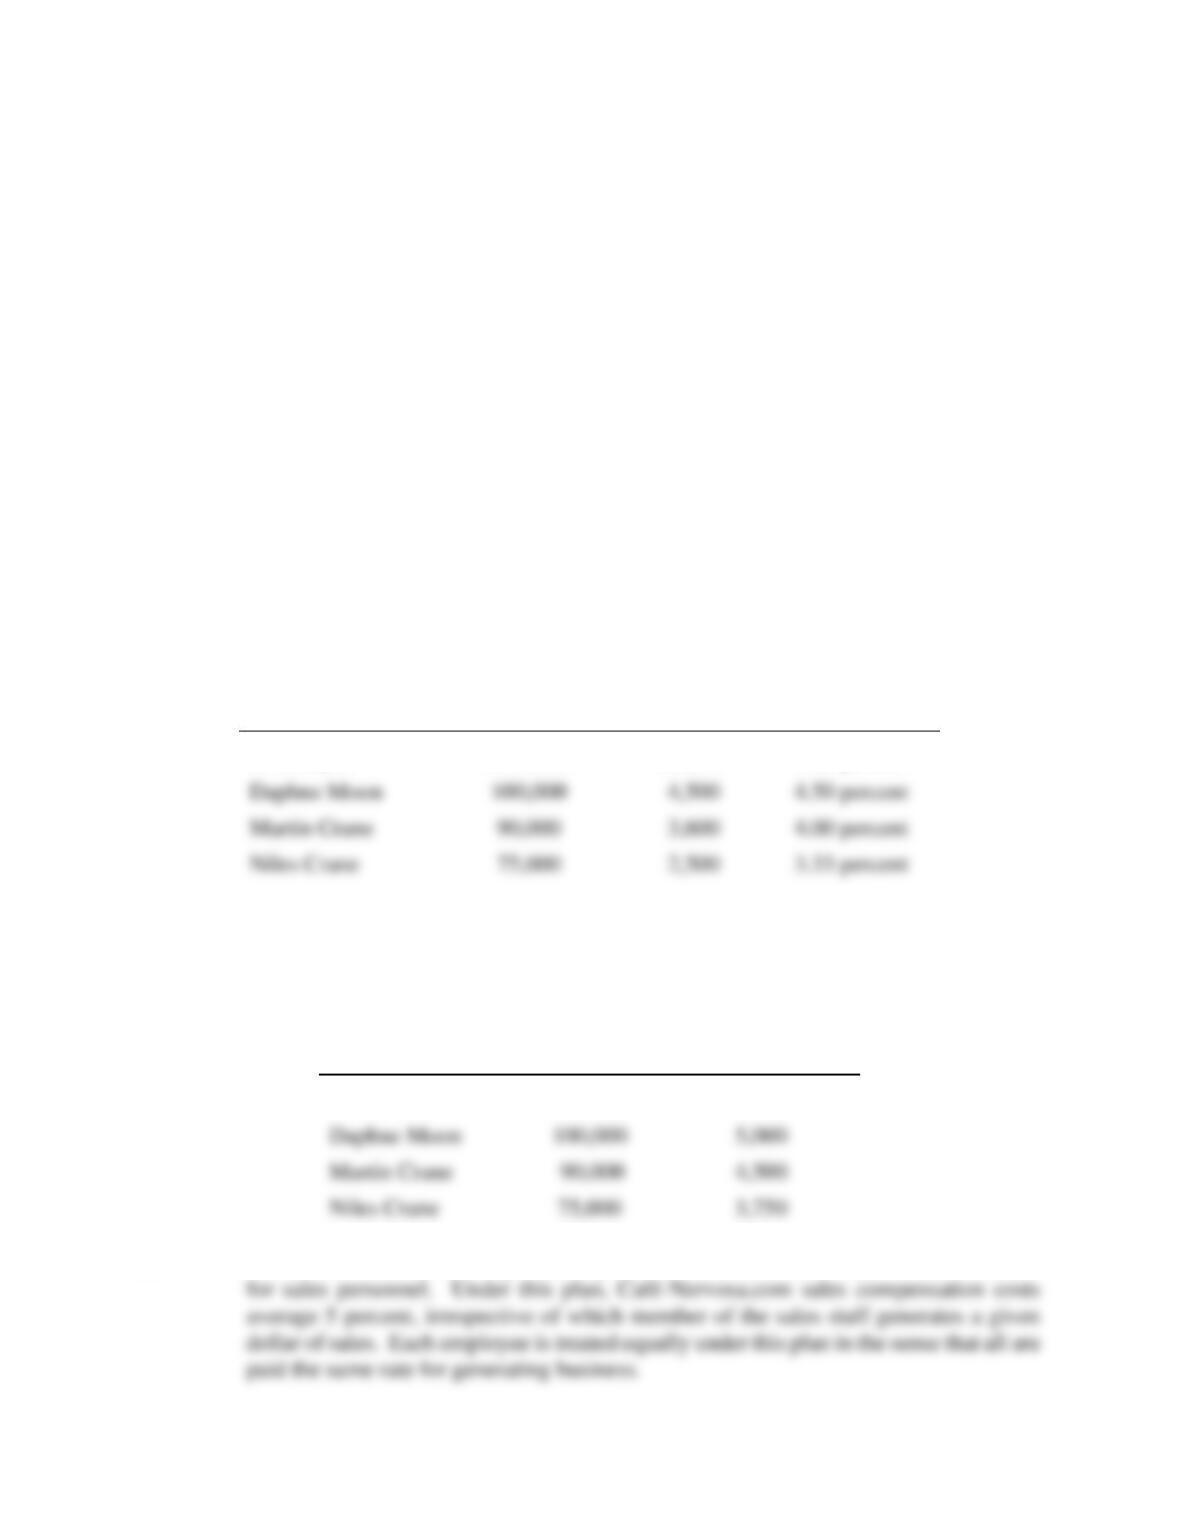
A. Calculate Café-Nervosa.com’s salary expense for each employee expressed as a
percentage of the monthly sales generated by that individual.
B. Calculate monthly income for each employee under a 5 percent of monthly sales
commission-based system.
C. Will a commission-based plan result in efficient relative salaries, efficient salary
levels, or both?
P7.5 SOLUTION
A.
Sales Staff
(1)
Average
Monthly Sales
(2)
Monthly
Salary
(3)
Commission
(4) = (3)/(2)
Roz Doyle
$160,000
$6,000
3.75 percent
B.
Average
Sales Staff
(1)
Monthly
Sales
(2)
Commission
(3) = (2) × 0.05
Roz Doyle
$160,000
$8,000
C. The commission-based compensation plan will result in more efficient relative salaries