Production Analysis and Compensation Policy 185
Although a commission-based plan will result in an efficient relative salary
P7.6 Optimal Input Mix. The First National Bank received 3,000 inquiries following the
latest advertisement describing its 30-month IRA accounts in the Boston World, a local
newspaper. The most recent ad in a similar advertising campaign in Massachusetts
Business, a regional business magazine, generated 1,000 inquiries. Each newspaper ad
costs $500, whereas each magazine ad costs $125.
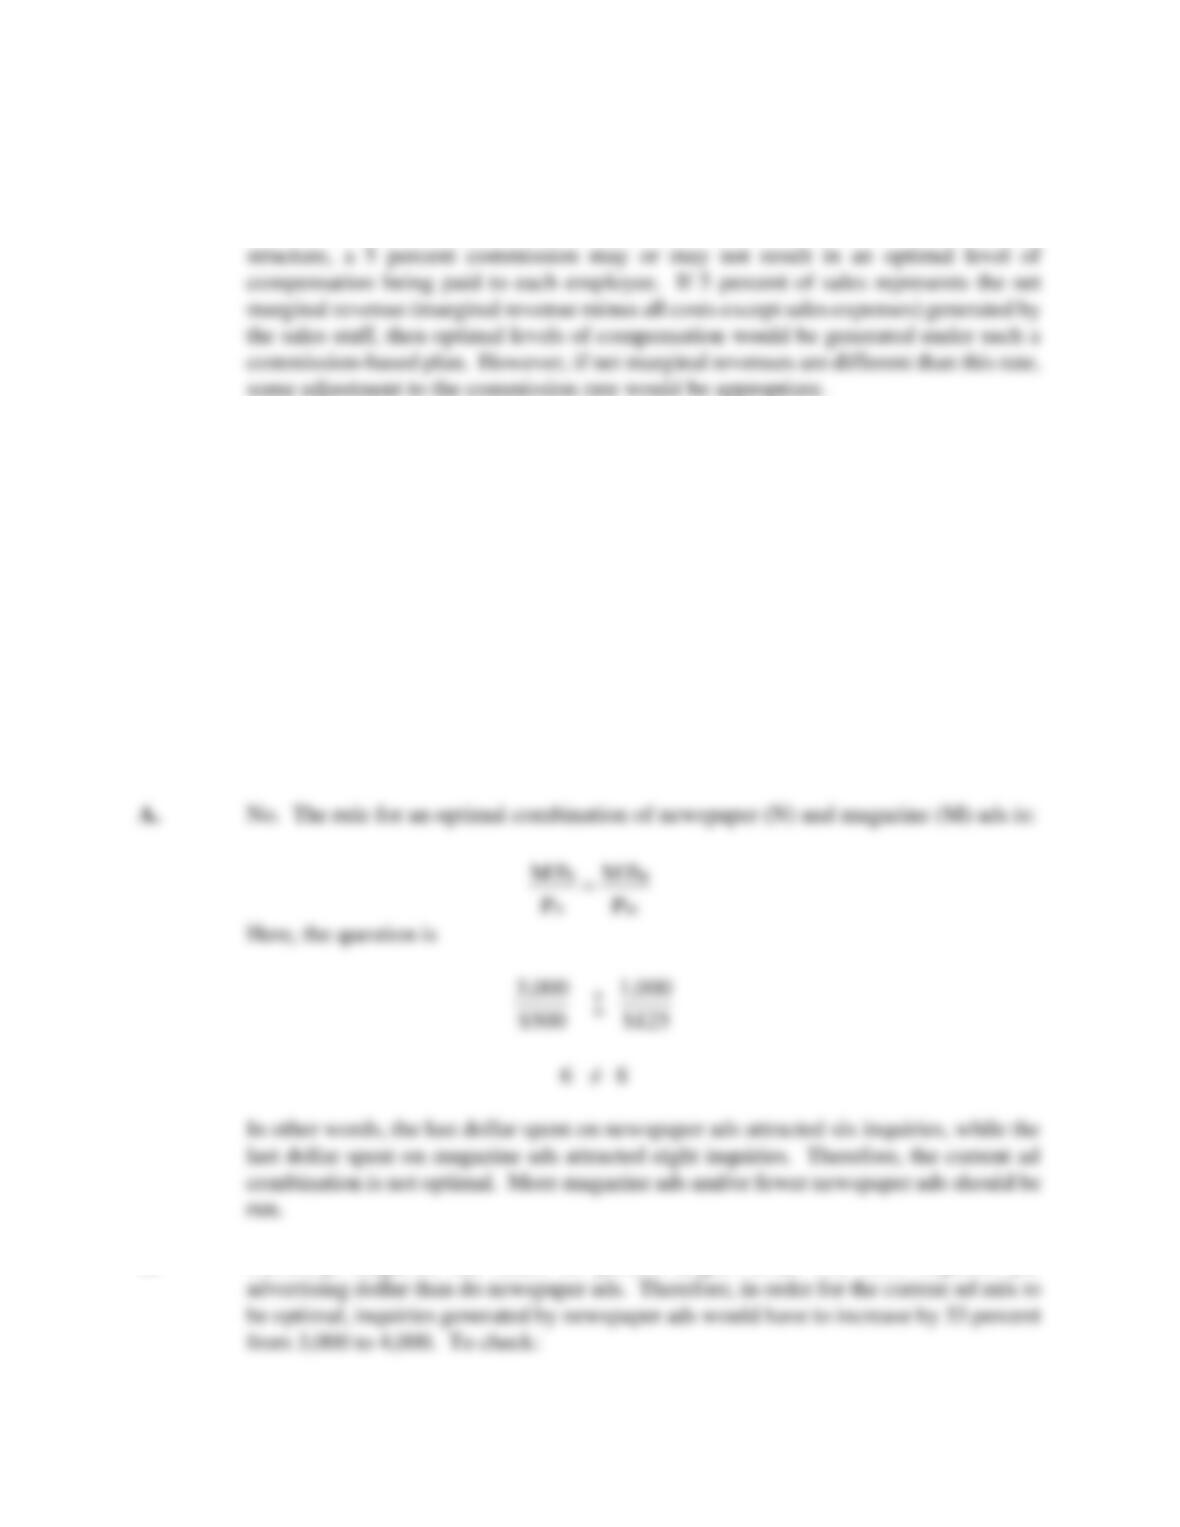
A. Assuming that additional ads would generate similar response rates, is the bank
running an optimal mix of newspaper and magazine ads? Why or why not?
B. Holding all else equal, how many inquiries must a newspaper ad attract for the
current advertising mix to be optimal?
P7.6 SOLUTION
B. Currently, magazine ads return 33 percent (eight versus six) more inquiries per
186 Chapter 7
P7.7 Marginal Revenue Product of Labor. To better serve customers interested in buying
cars over the Internet, Smart Motors, Inc., hired Nora Jones to respond to customer
inquiries, offer price quotes, and write orders for leads generated by the company’s
web site. During last year, Jones averaged 1.5 vehicle sales per week. On average,
these vehicles sold for a retail price of $25,000 and brought the dealership a profit
contribution of $1,000 each.
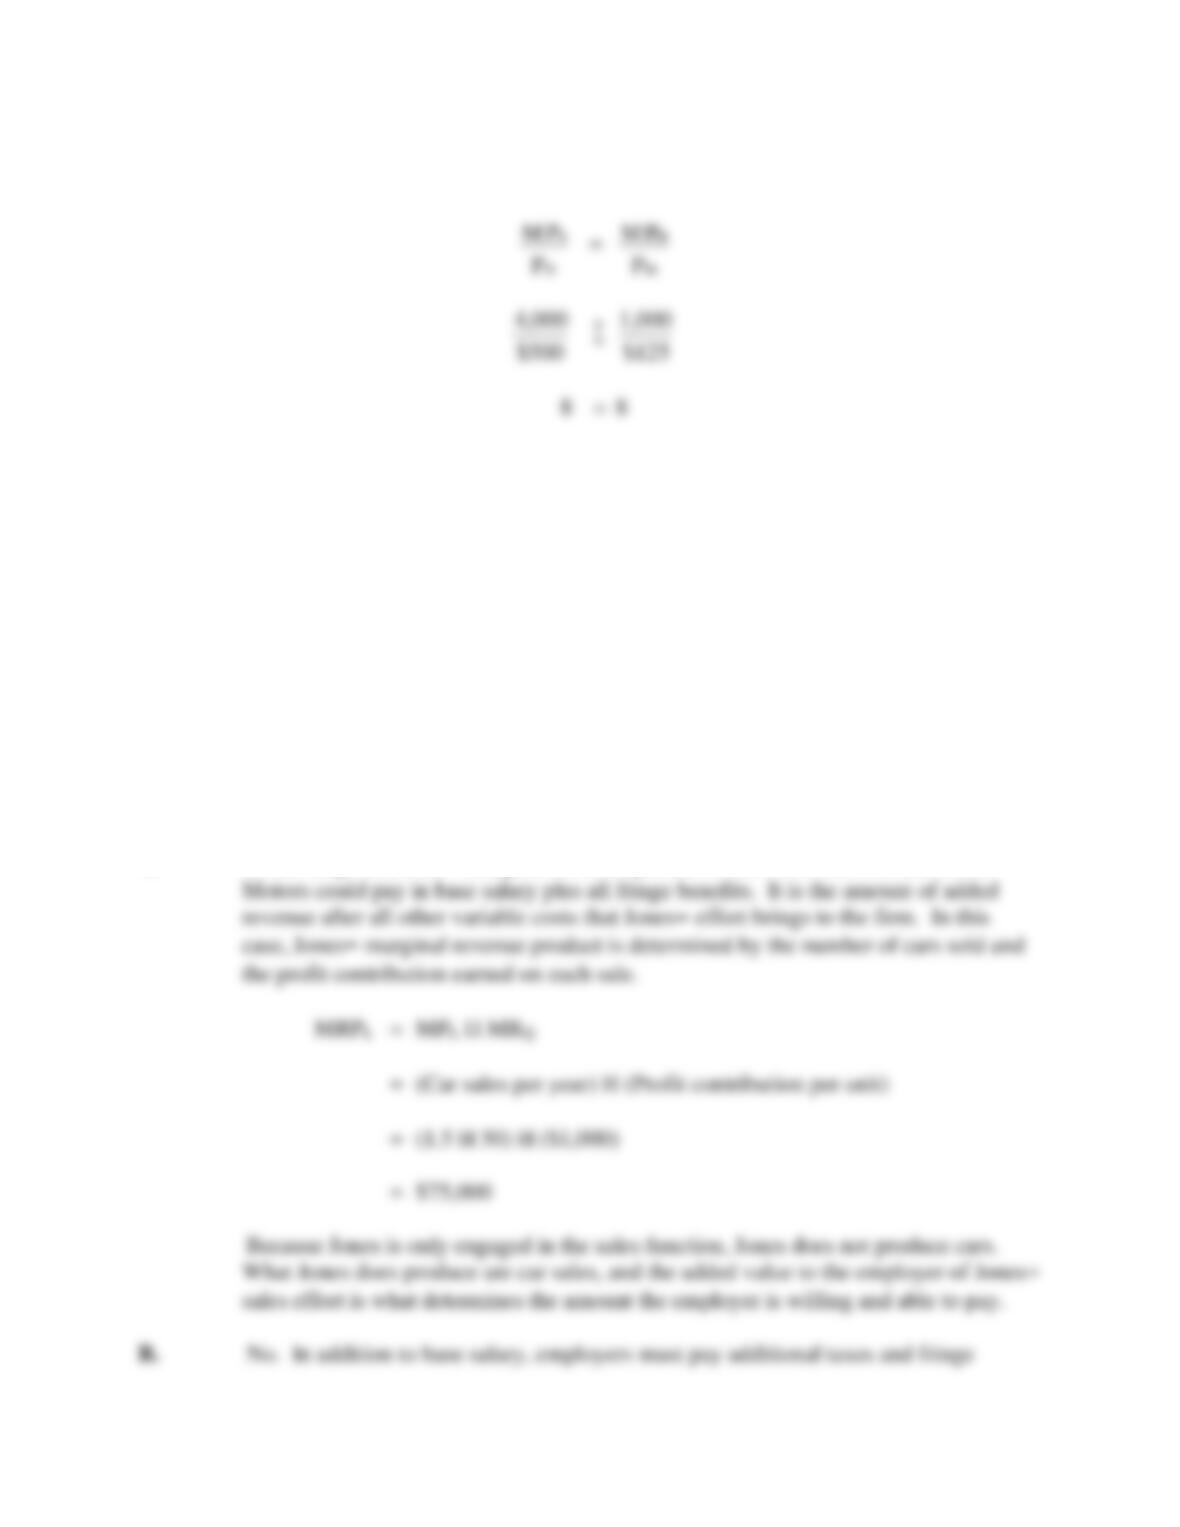
A. Estimate Jones= annual (50 workweek) marginal revenue product.
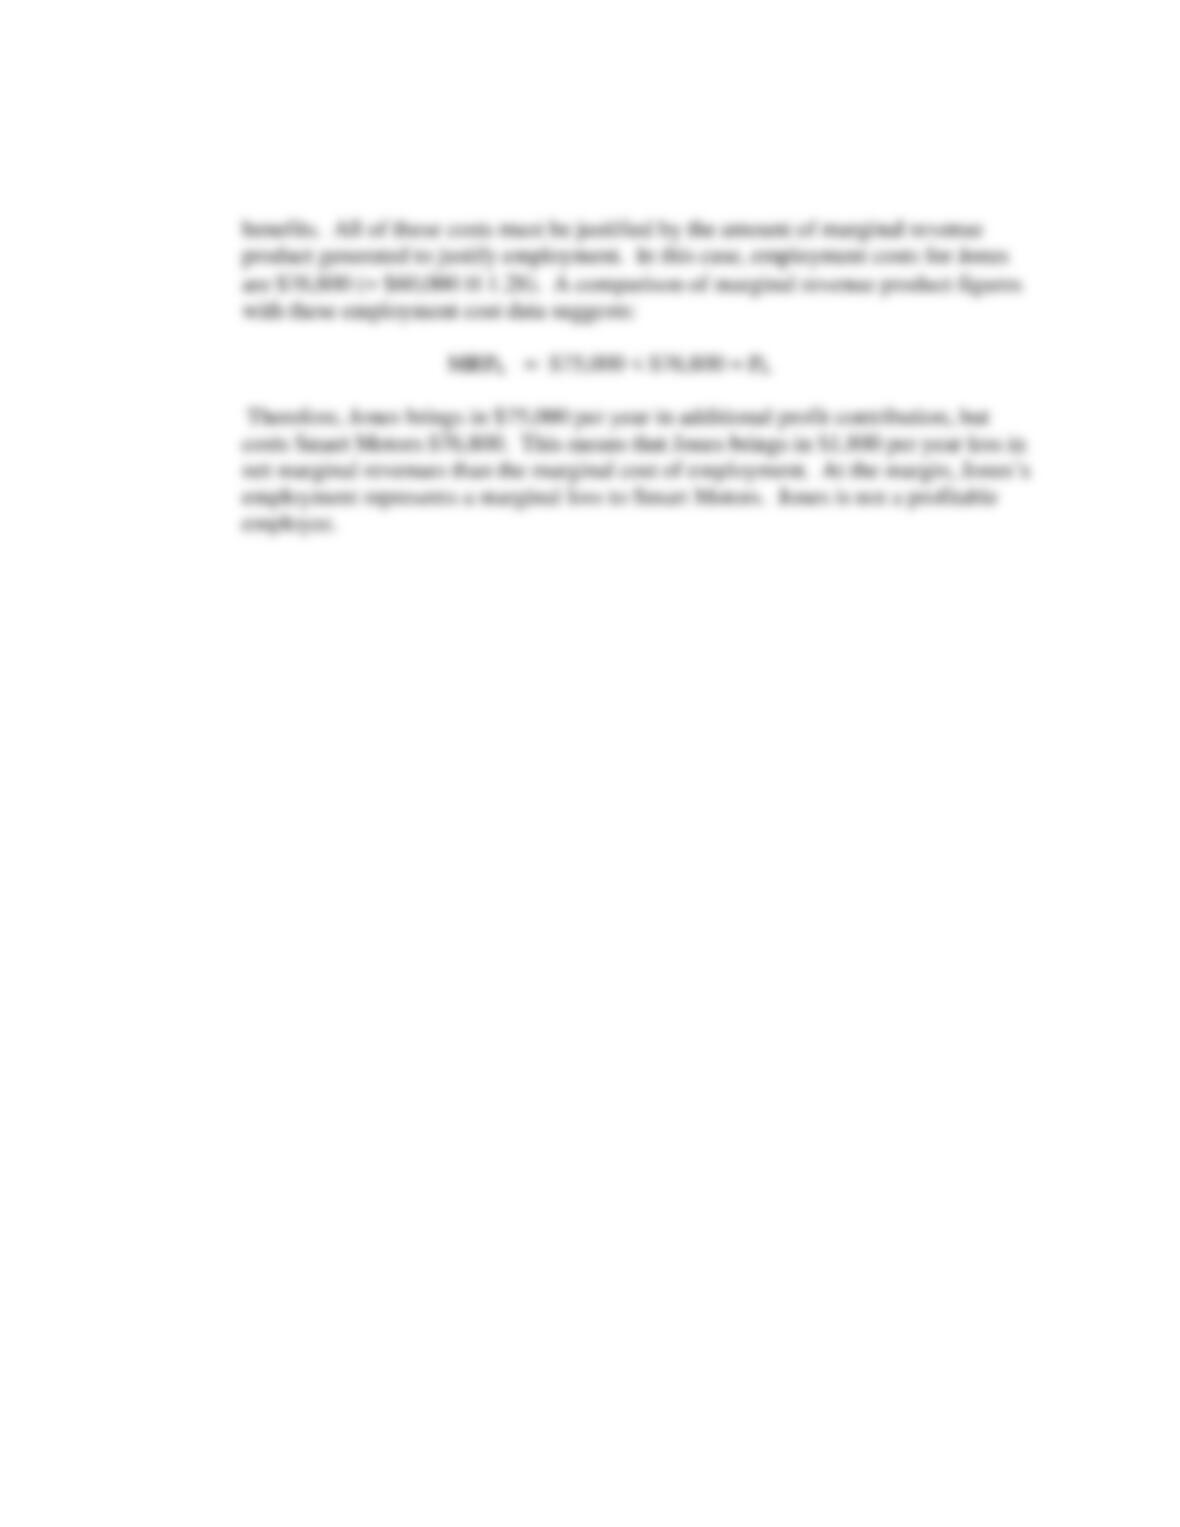
B. Jones earns a base salary of $60,000 per year, and Smart Motors pays an
additional 28% of this base salary in taxes and various fringe benefits. Is
Jones a profitable employee?
P7.7 SOLUTION
A. In the long run, Jones= marginal revenue product is the maximum amount Smart
Production Analysis and Compensation Policy 187
P7.8 Optimal Input Level. Ticket Services, Inc., offers ticket promotion and handling
services for concerts and sporting events. The Sherman Oaks, California, branch office
makes heavy use of spot radio advertising on WHAM-AM, with each 30-second ad
costing $100. During the past year, the following relation between advertising and
ticket sales per event has been observed:
Sales (units) = 5,000 + 100A – 0.5A2
∂Sales (units)/ ∂ Advertising = 100 – A
Here, A represents a 30-second radio spot ad, and sales are measured in numbers of
tickets.
Rachel Green, manager for the Sherman Oaks office, has been asked to
recommend an appropriate level of advertising. In thinking about this problem, Green
noted its resemblance to the optimal resource employment problem studied in a
managerial economics course. The advertising/sales relation could be thought of as a
production function, with advertising as an input and sales as the output. The problem
is to determine the profit-maximizing level of employment for the input, advertising, in
this “production” system. Green recognized that a measure of output value was needed
to solve the problem. After reflection, Green determined that the value of output is $2
per ticket, the net marginal revenue earned by Ticket Services (price minus all marginal
costs except advertising).
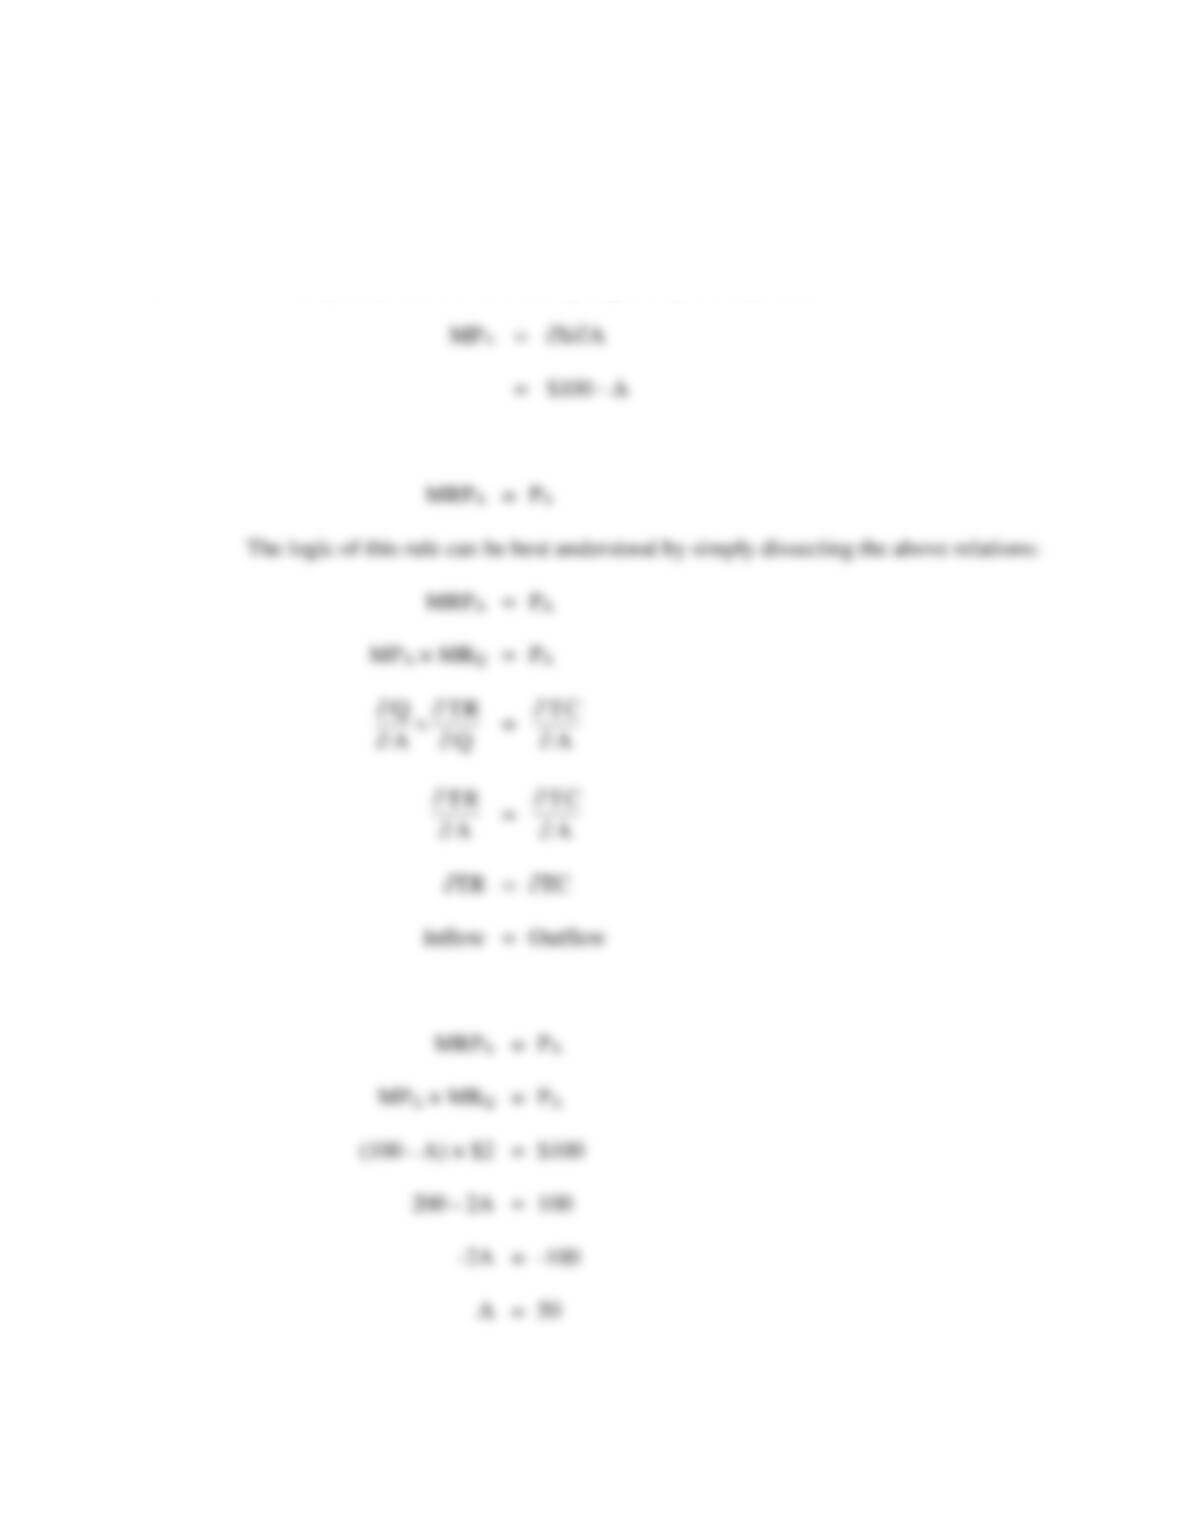
A. Continuing with Green’s production analogy, what is the marginal product of
advertising?
B. What is the rule for determining the optimal amount of a resource to employ in a
production system? Explain the logic underlying this rule.
C. Using the rule for optimal resource employment, determine the profit-maximizing
number of radio ads.
188 Chapter 7
P7.8 SOLUTION
A. The marginal product of advertising is given by the expression:
B. The rule for determining the optimal amount of a resource to employ is:
C. The optimal advertising level is found where:
Production Analysis and Compensation Policy 189
P7.9 Net Marginal Revenue. Crane, Poole & Schmidt, LLC is a successful Boston-based law
firm. Worker productivity at the firm is measured in billable hours, which vary between
partners and associates. Partner time is billed to clients at a rate of $250 per hour,
whereas associate time is billed at a rate of $125 per hour. On average, each partner
generates 25 billable hours per 40-hour workweek, with 15 hours spent on promotion,
administrative, and supervisory responsibilities. Associates generate an average of 35
billable hours per 40-hour workweek and spend 5 hours per week in administrative and
training meetings. Variable overhead costs average 50 percent of revenues generated
by partners and 60 percent of revenues generated by associates.
A. Calculate the annual (50 workweek) net marginal revenue product of partners and
associates.
B. If partners earn $175,000 and associates earn $70,000 per year, does the
company have an optimal combination of partners and associates? If not, why
not? Make your answer explicit and support any recommendations for change.
P7.9 SOLUTION
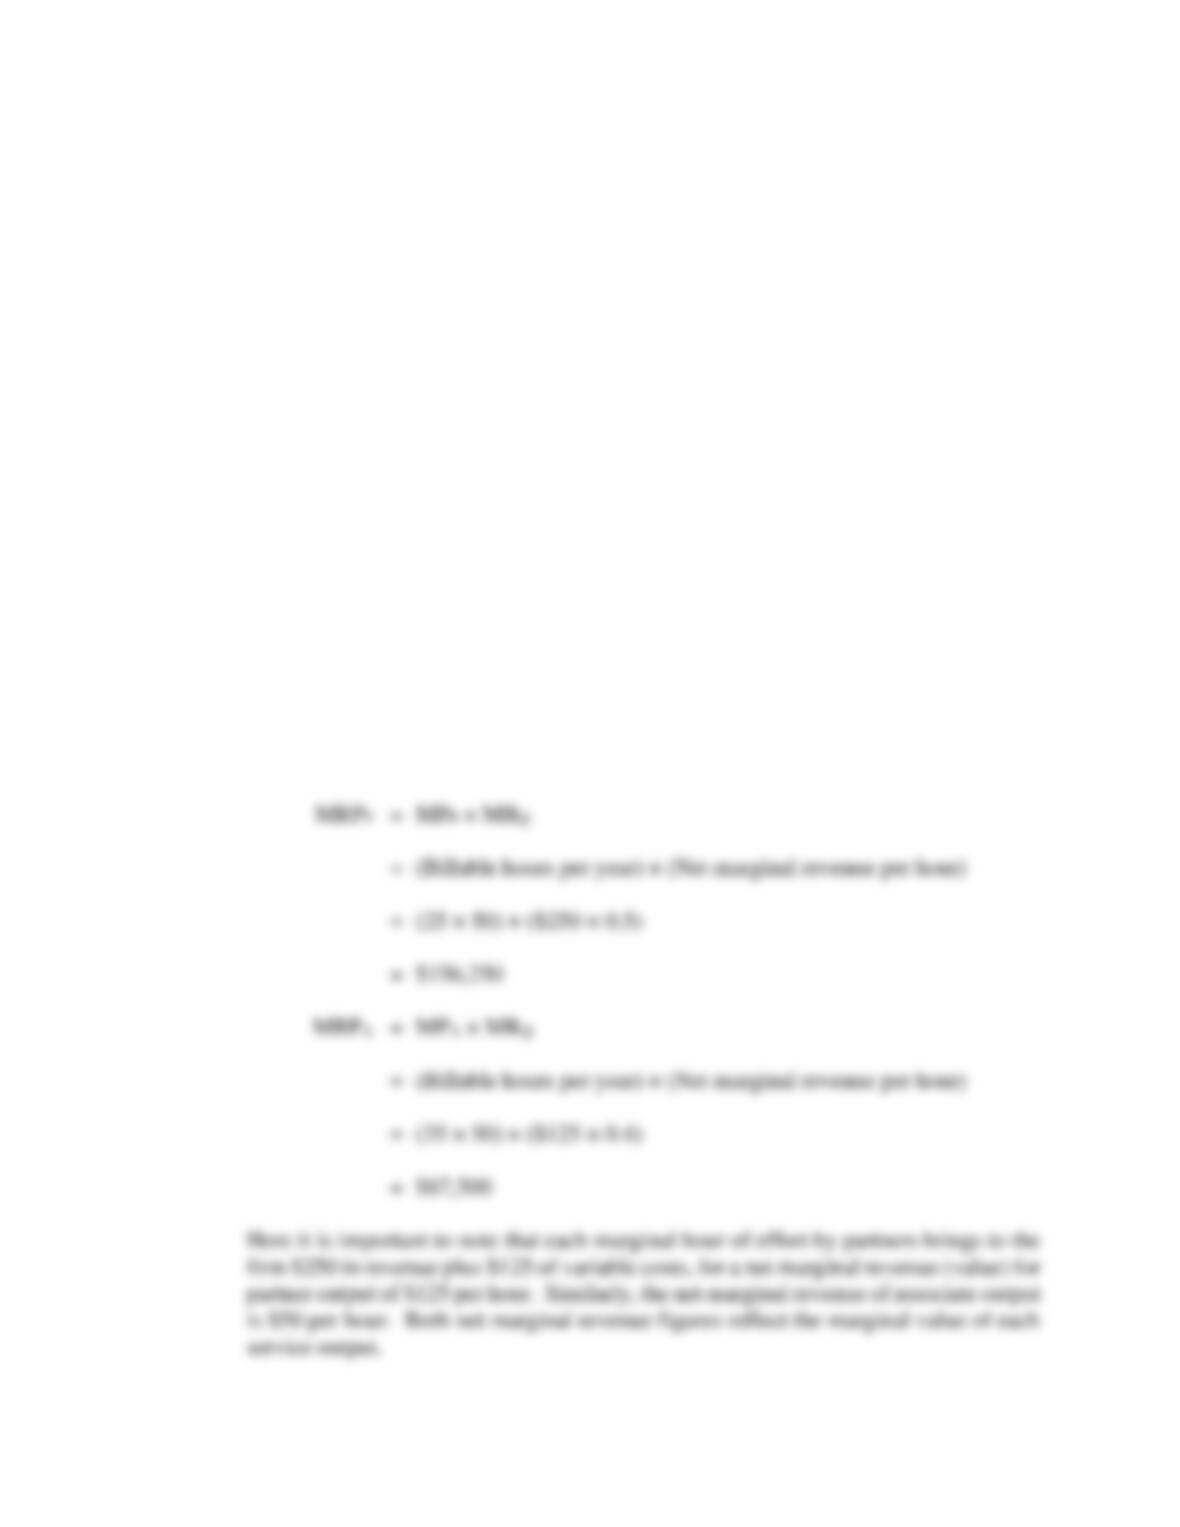
A. The annual marginal revenue product calculation for partners (P) and associates (A)
identifies the amount of net revenue generated per employee.
190 Chapter 7
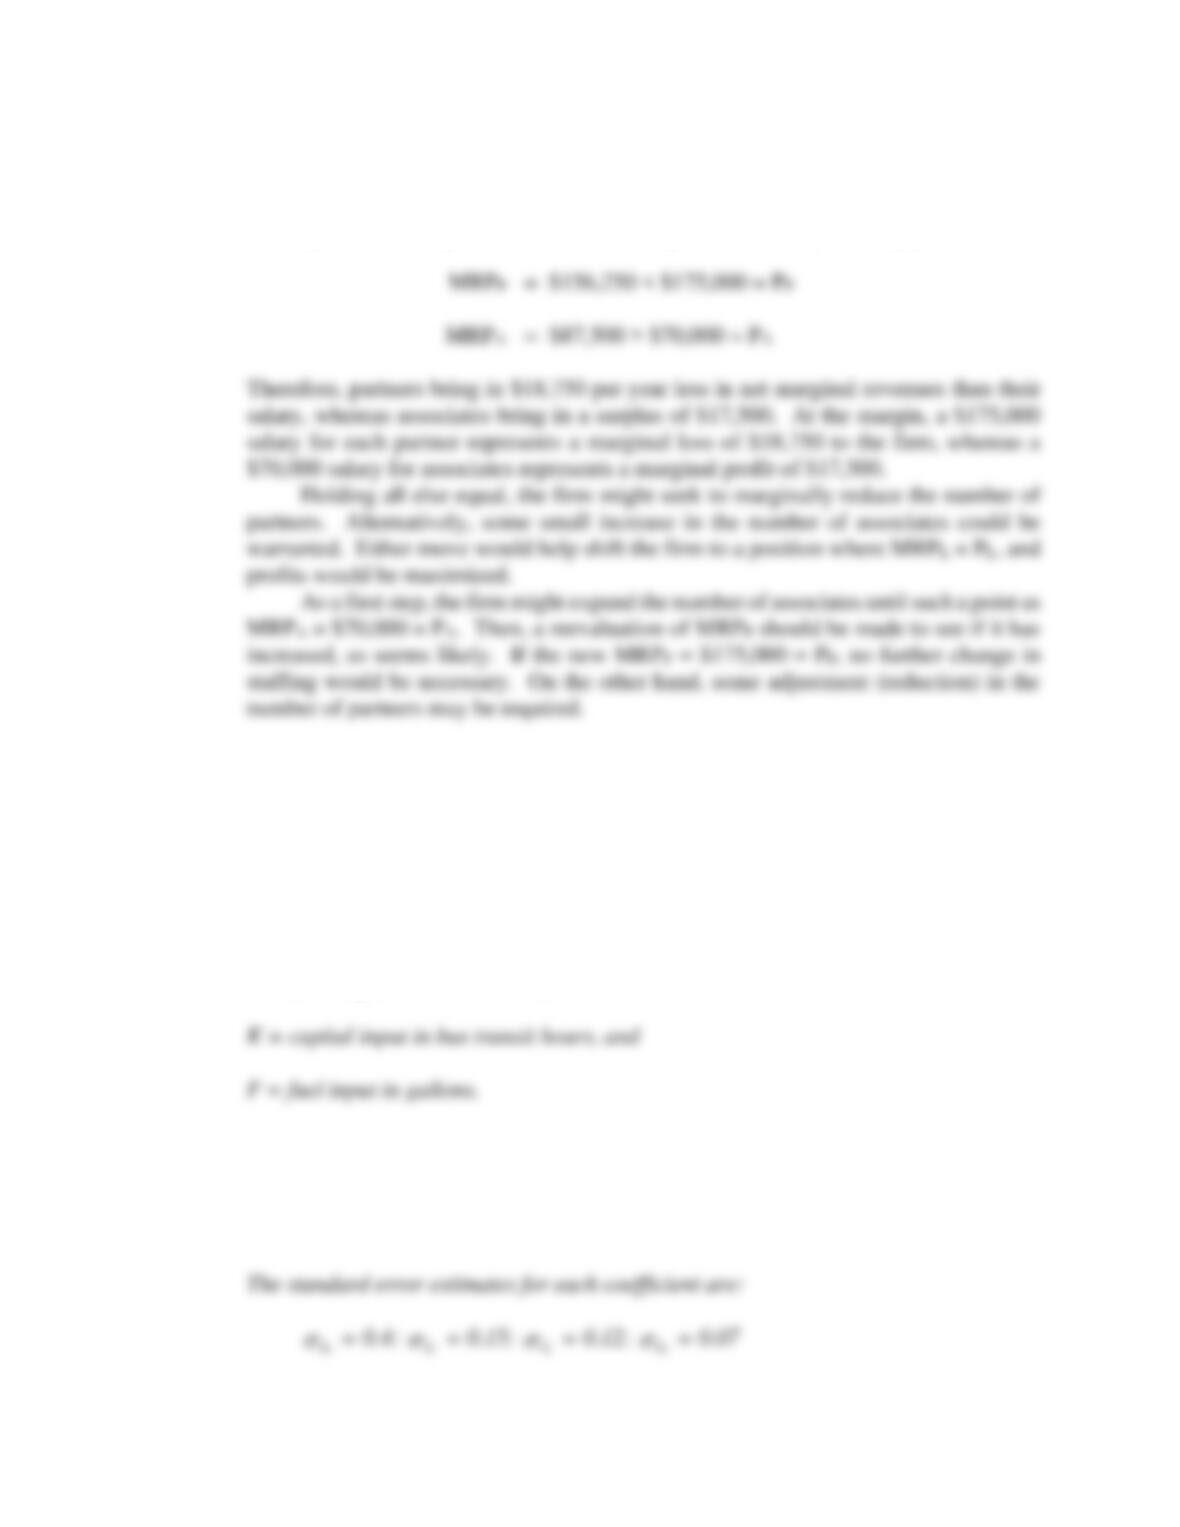
B. A comparison of marginal revenue product figures with salary data suggests:
P7.10 Production Function Estimation. Consider the following Cobb-Douglas production
function for bus service in a typical metropolitan area:
where
Q = output in millions of passenger miles,
L = labor input in worker hours,
Each of the parameters of this model was estimated by regression analysis using
monthly data over a recent three-year period. Results obtained were as follows:
b0
ˆ
= 1.2;
b1
ˆ
= 0.28;
b2
ˆ
= 0.63; and
b3
ˆ
= 0.12
,
FkL
b
= Q bbb
0321
Production Analysis and Compensation Policy 191
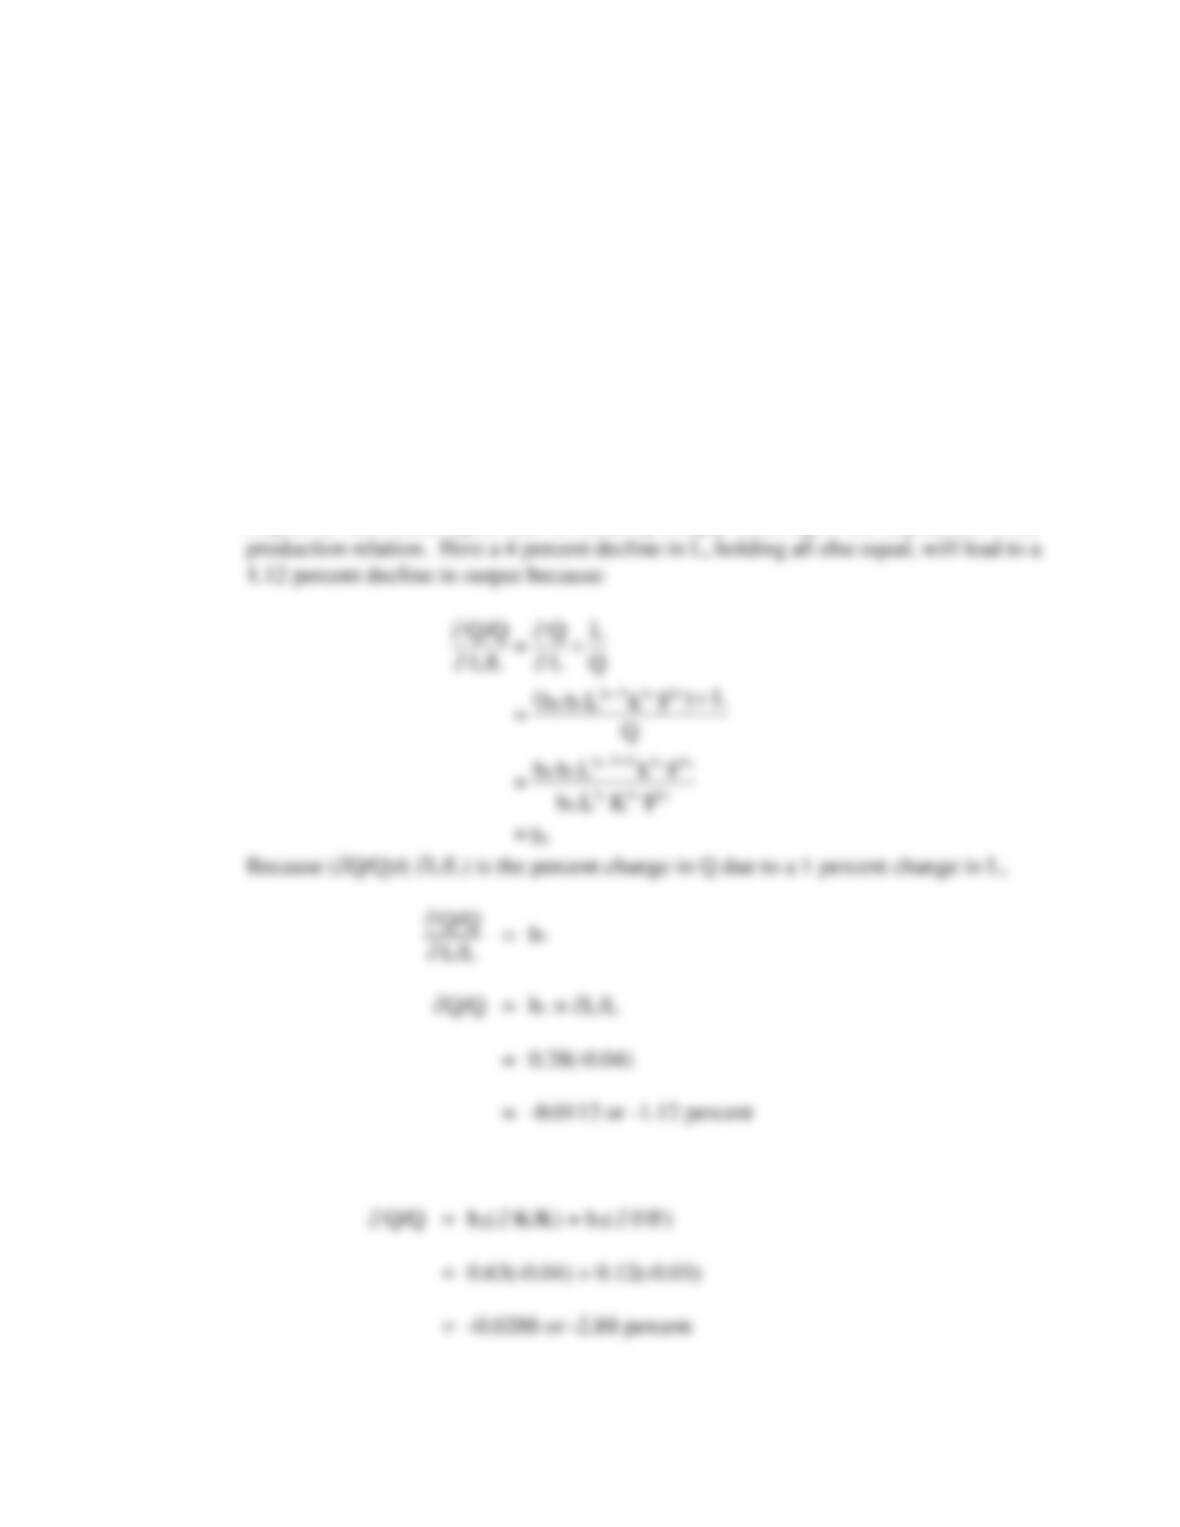
A. Estimate the effect on output of a 4 percent decline in worker hours (holding K
and F constant).
B. Estimate the effect on output of a 3 percent reduction in fuel availability
accompanied by a 4 percent decline in bus transit hours (holding L constant).
C. Estimate the returns to scale for this production system.
P7.10 SOLUTION
A. For Cobb-Douglas production functions, calculations of the elasticity of output with
respect to individual inputs can be made by simply referring to the exponents of the
B. From part A it is obvious that:
192 Chapter 7
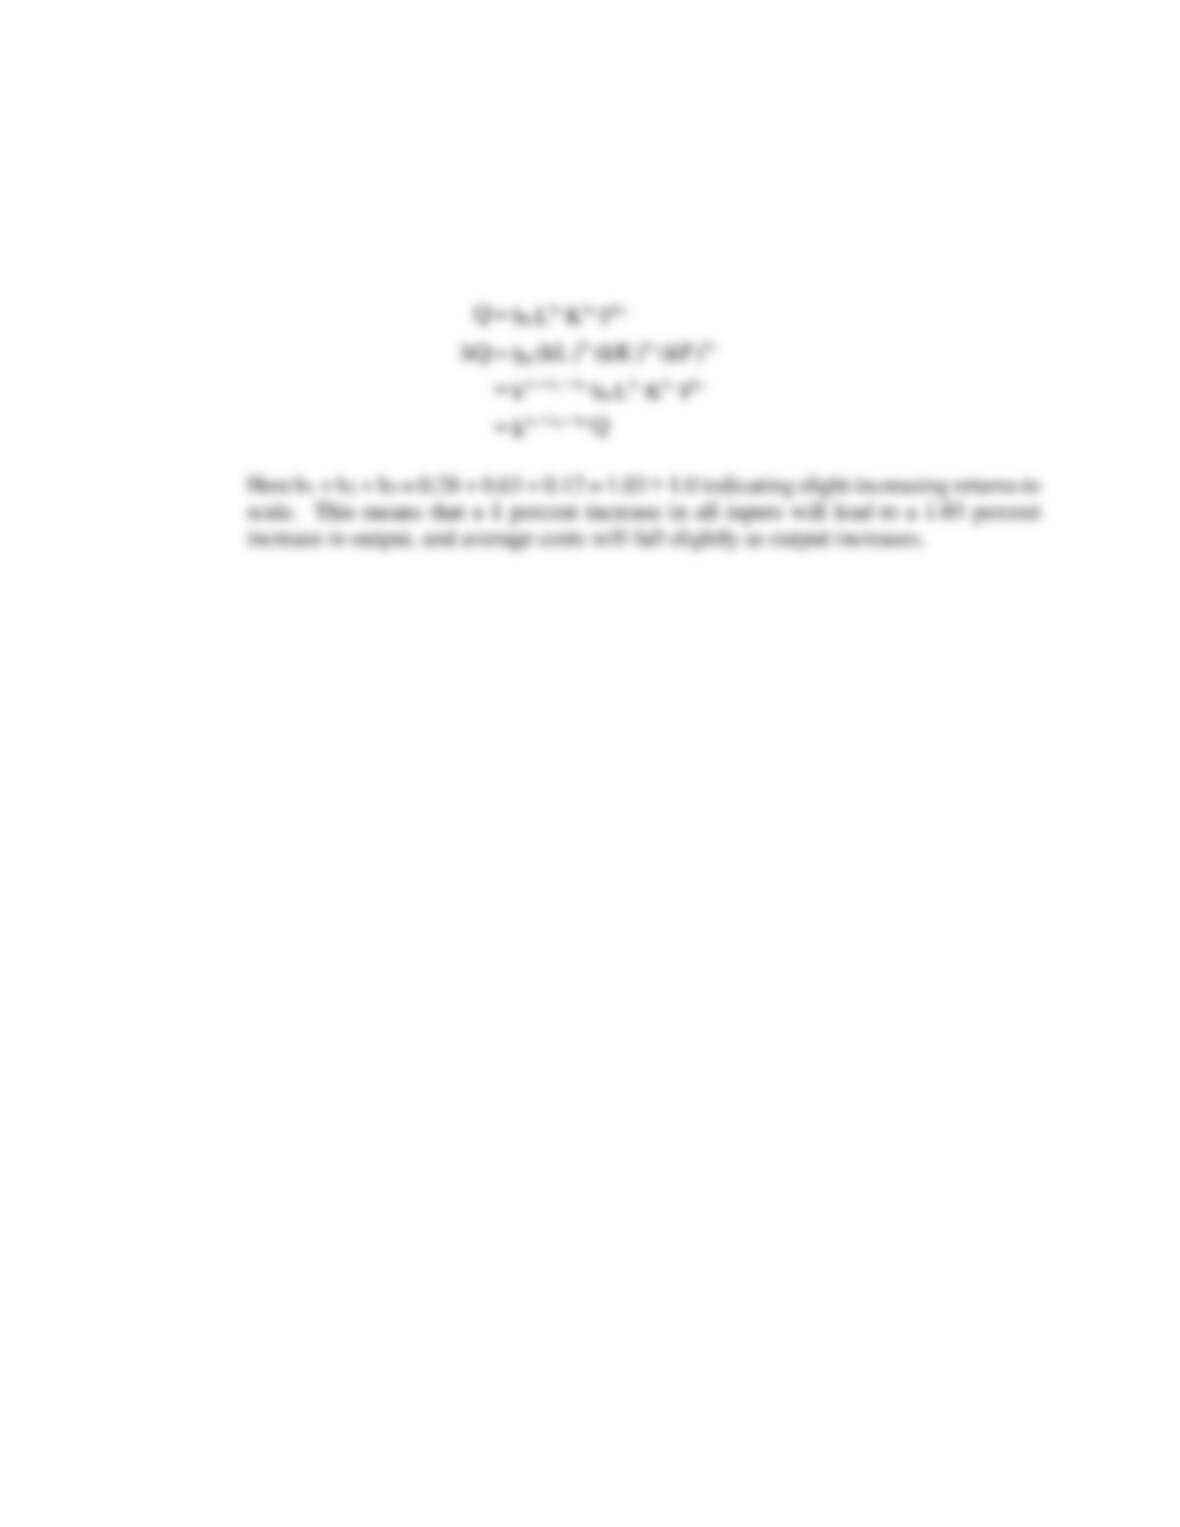
C. In the case of Cobb-Douglas production functions, returns to scale are determined by
simply summing exponents because:
Production Analysis and Compensation Policy 193
CASE STUDY FOR CHAPTER 7
Worker Productivity Among Giant U.S. Corporations
Traditional measures of firm productivity tend to focus on profit margins, the rate of return on
stockholder’s equity, or related measures like total asset turnover, inventory turnover, or receivables
turnover. Profit margin is net income divided by sales and is a useful measure of a company’s
ability to manufacture and distribute distinctive products. When profit margins are high, it’s a good
sign that customer purchase decisions are being driven by unique product characteristics or product
quality rather than by low prices. When profit margins are high, companies are also able to
withstand periods of fluctuating costs or weak product demand without devastating consequences for
net income. While high profit margins have the potential to attract new competitors, they also act as
credible evidence that a firm offers a hard-to-imitate combination of attractive goods and services.
Despite these obvious advantages, each of these traditional firm performance measures
suffers certain shortcomings. Profit margins are strongly influenced by industry-related factors that
might obscure superior firm productivity when firms from different industries are compared. For
example, the automobile industry is huge and net profit margins for mediocre performers are
commonly in the 2.5-3 percent range. Even standout performers, like Toyota, struggle to earn 6
percent on sales. Meanwhile, even mediocre banks commonly report profit margins in the 15-20
194 Chapter 7
them more efficient and more profitable employees. Employee training and education are two of the
most reliable tools that companies can use to keep an edge on the competition. However,
determining an efficient amount of worker training and education is more tricky than it might seem
at first.
In a competitive labor market, employees can expect to command a wage rate equal to the
Table 7.5 gives interesting perspective on employee productivity by showing revenue per
employee and profits per employee for the 30 giant corporations that together comprise the Dow
Jones Industrial Average.
A. What firm-specific and industry-specific factors might be used to explain differences
among giant corporations in the amount of revenue per employee and profit per
employee?
B. A multiple regression analysis based upon the data contained in Table 7.6 reveals the
following (t statistics in parentheses):
Interpret these results. Is profit per employee more sensitive to industry-specific or
firm-specific factors for this sample of giant corporations?
CASE STUDY SOLUTION
A. Firm-to-firm variation in the amount of profits per employee is sure to depend upon both
Production Analysis and Compensation Policy 195
B. Based upon this sample of giant corporations taken from the DJIA, profit per employee
appears to be sensitive to firm-specific factors and industry-specific factors.
196 Chapter 7
APPENDIX 7A: A CONSTRAINED OPTIMIZATION APPROACH TO DEVELOPING
THE OPTIMAL INPUT COMBINATION RELATIONSHIPS
PROBLEM
7A.1 Assume that a firm produces its product in a system described in the following
production function and price data:
Here, X and Y are two variable input factors employed in the production of Q.
A. What are the optimal input proportions for X and Y in this production system? Is
this combination rate constant regardless of the output level?
B. It is possible to express the cost function associated with the use of X and Y in the
produce that level of output meet the optimality conditions derived in Part A.
C. What is the additional output that could be obtained from a marginal increase in
the budget?
D. Assume that the firm is interested in minimizing the cost of producing 14,777 units
7A.1 SOLUTION
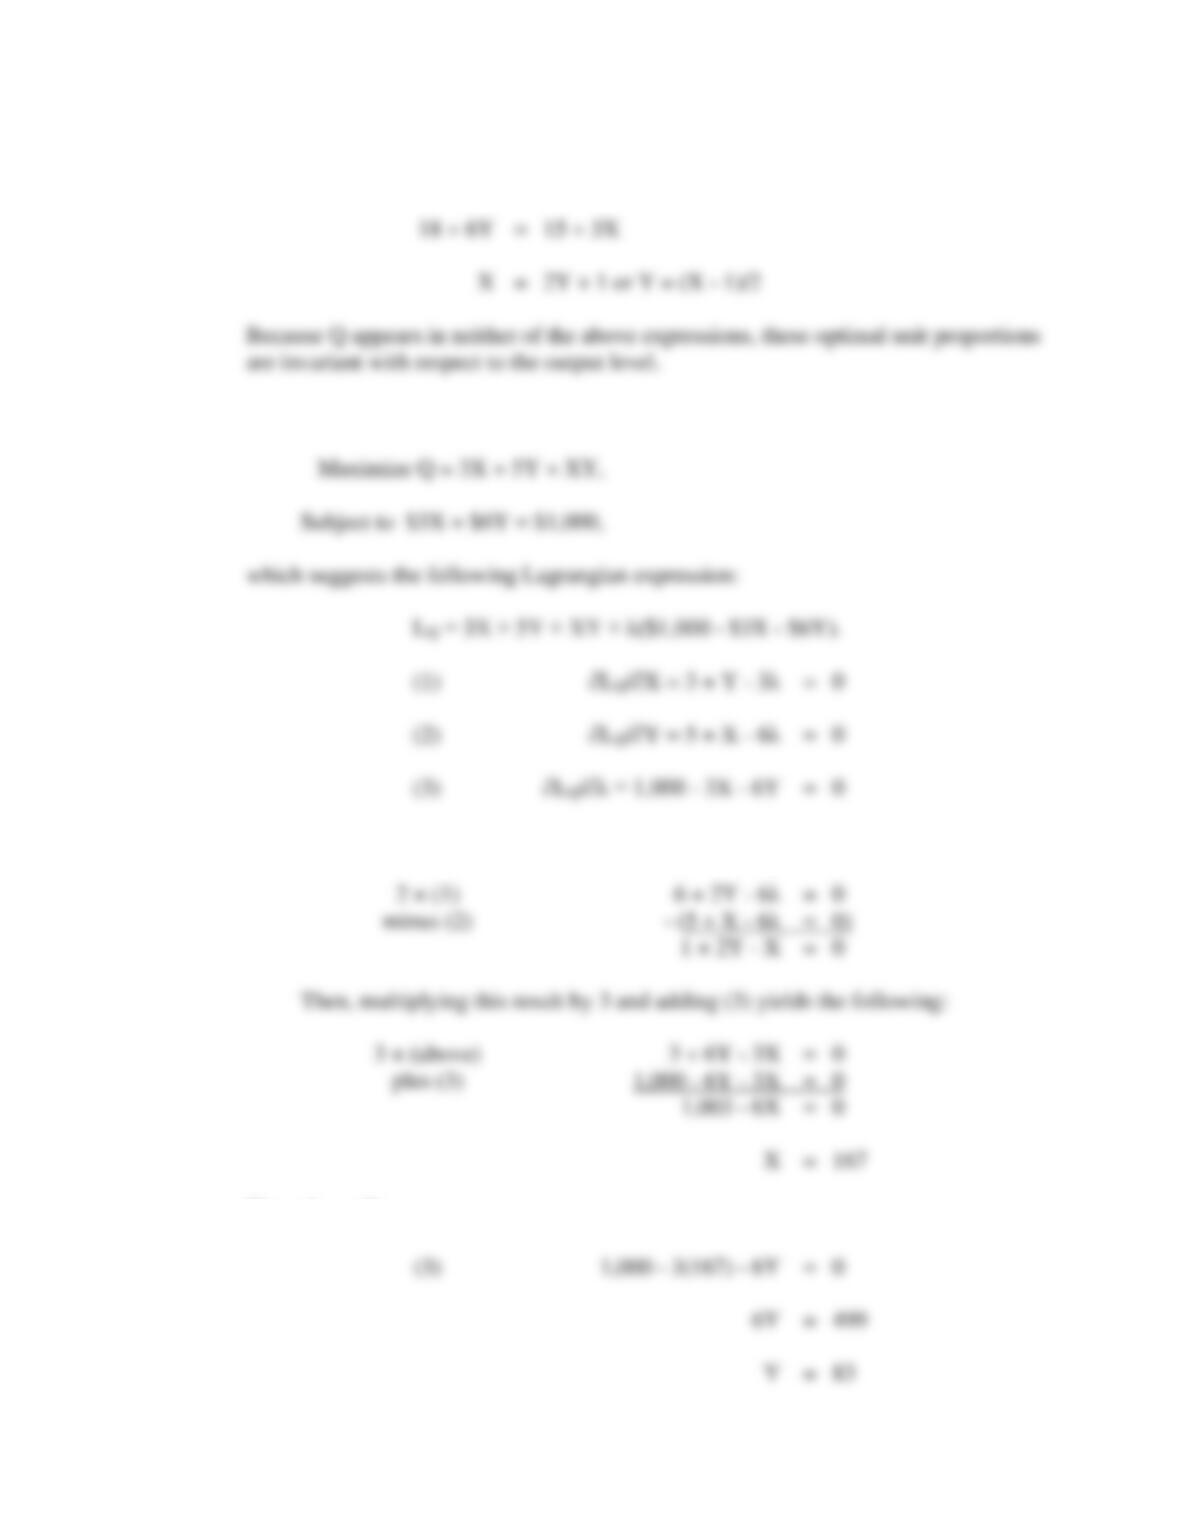
A. Optimal input proportions are found by solving the following relation:
Production Analysis and Compensation Policy 197
B. The optimization problem faced by the firm can be written
To solve, take 2 times (1) minus (2):
Then, from (3):
198 Chapter 7
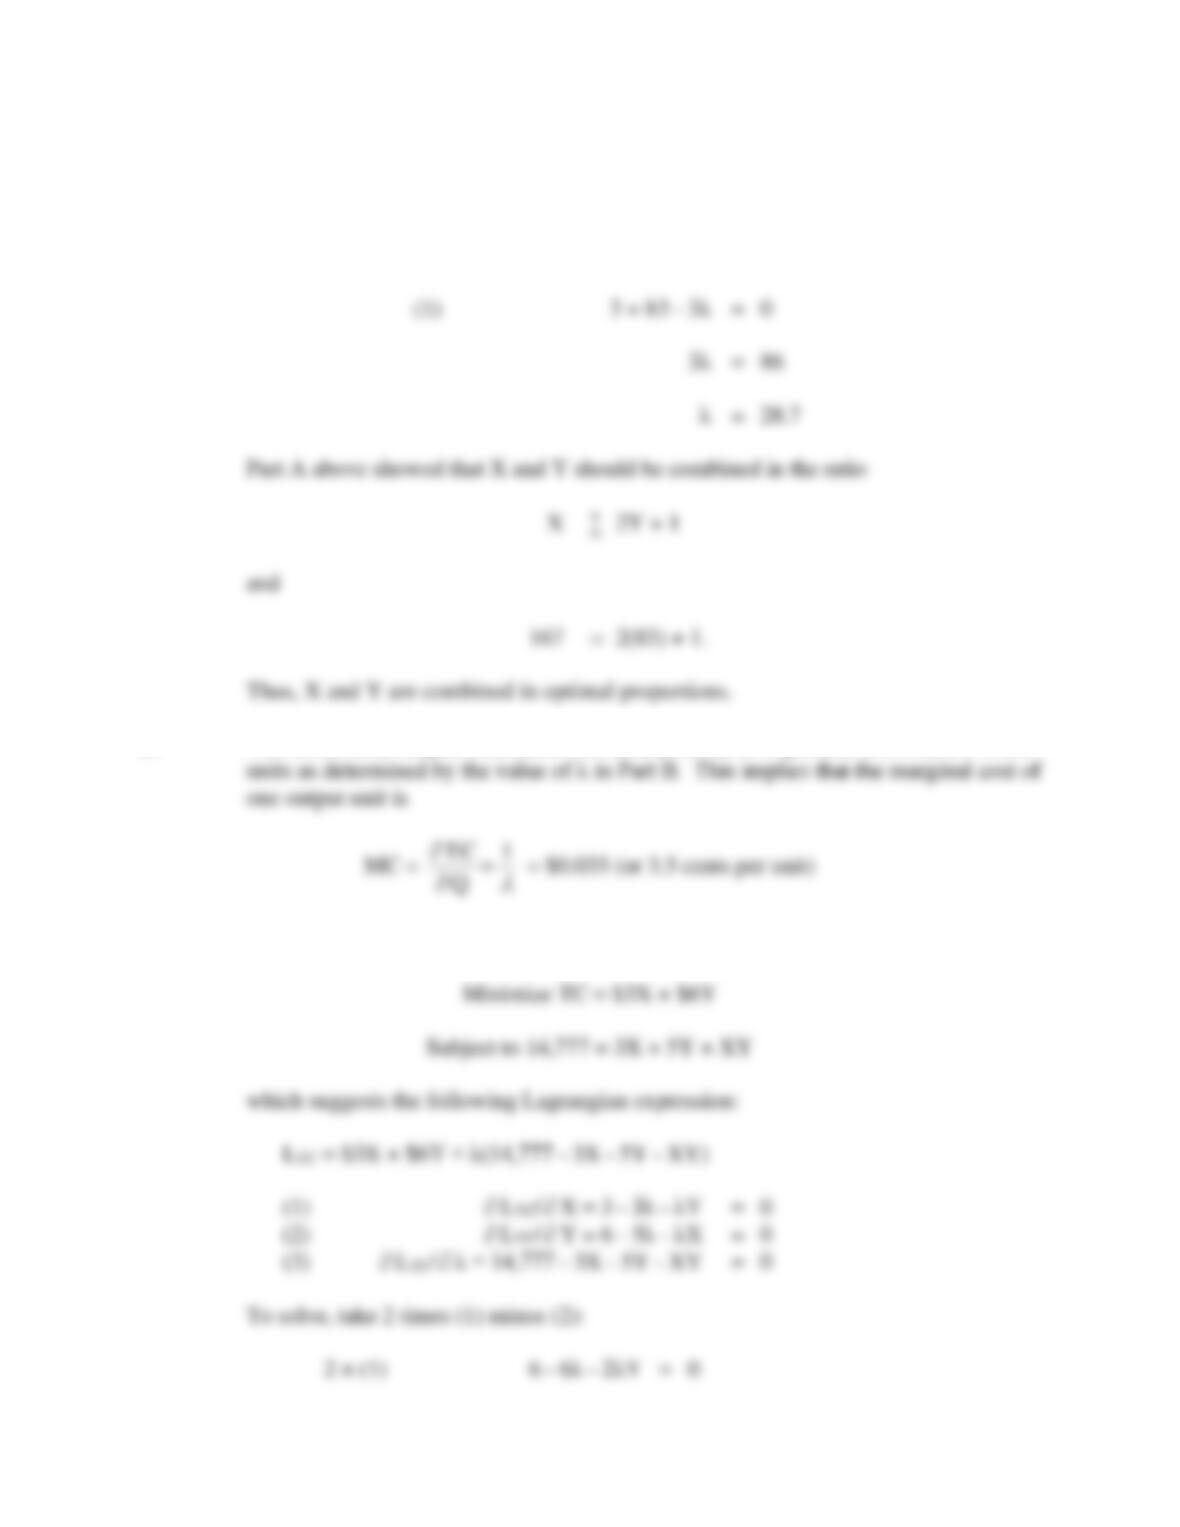
And, solving for λ using (1):
C. The incremental output obtainable from an additional $1 expenditure on X and Y is 28.7
D. The alternative optimization problem for the firm can be written as
Production Analysis and Compensation Policy 199
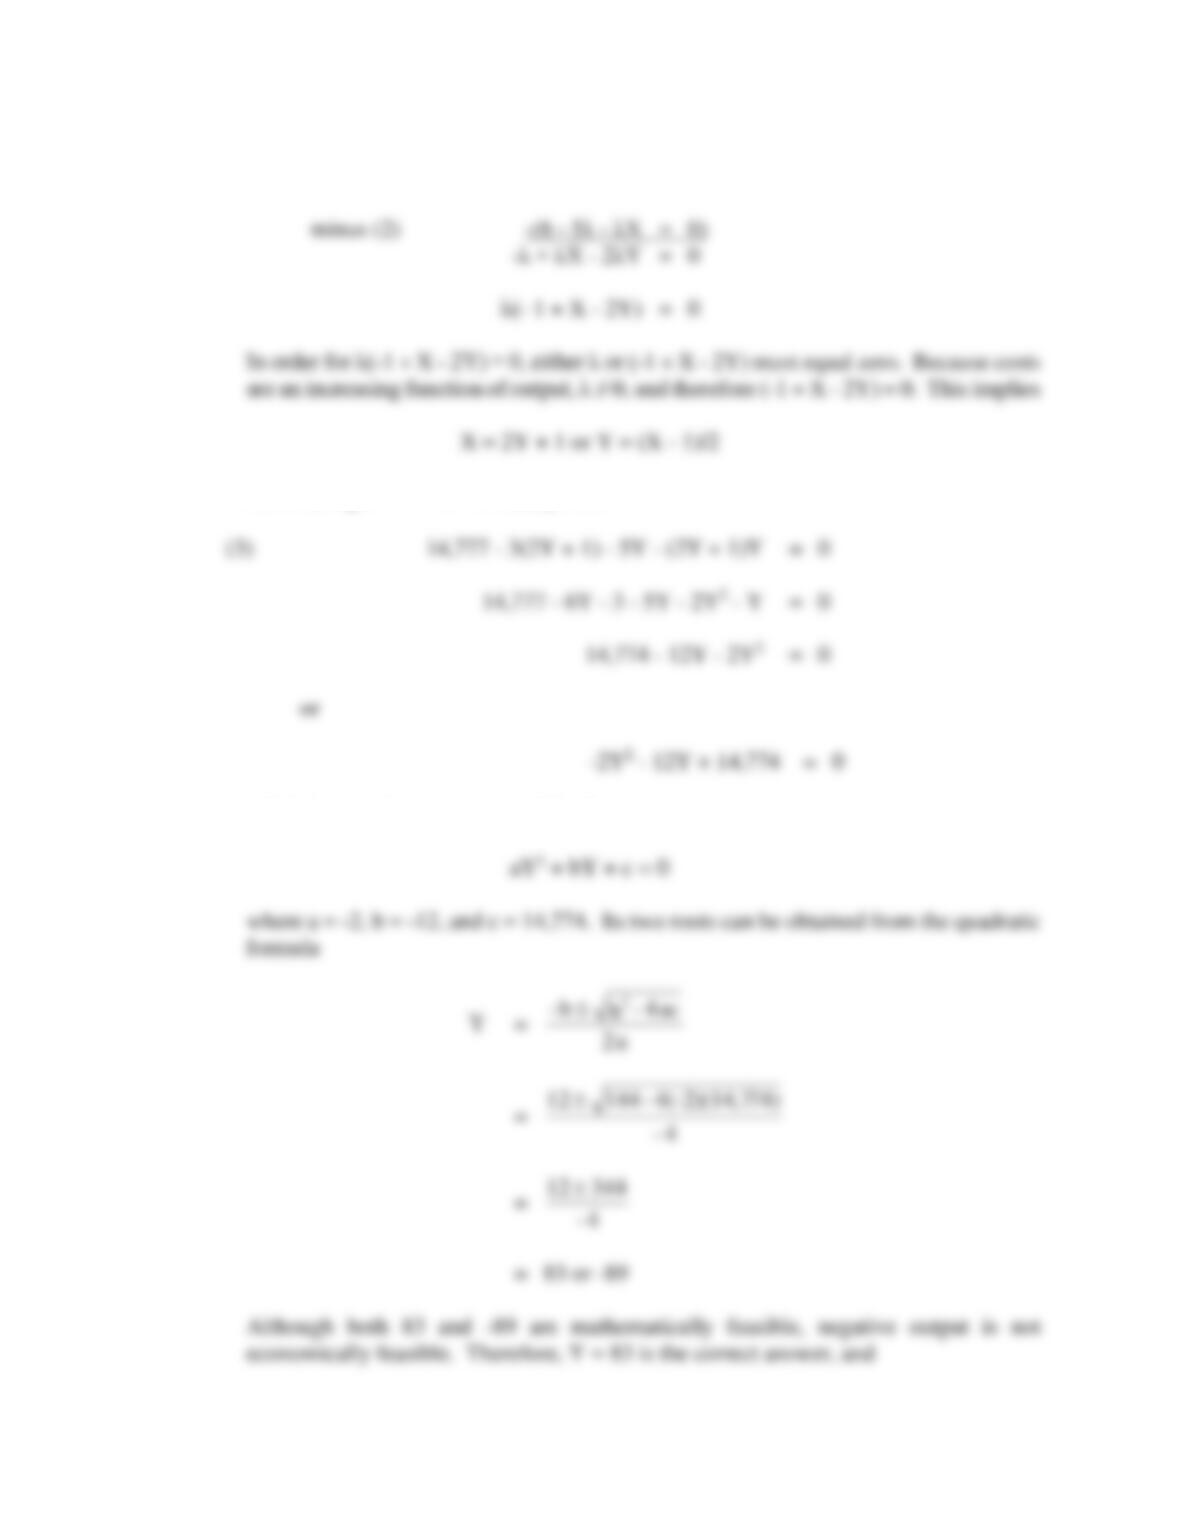
Substituting 2Y + 1 for X in (3) yields:
which is a quadratic equation of the form
200 Chapter 7
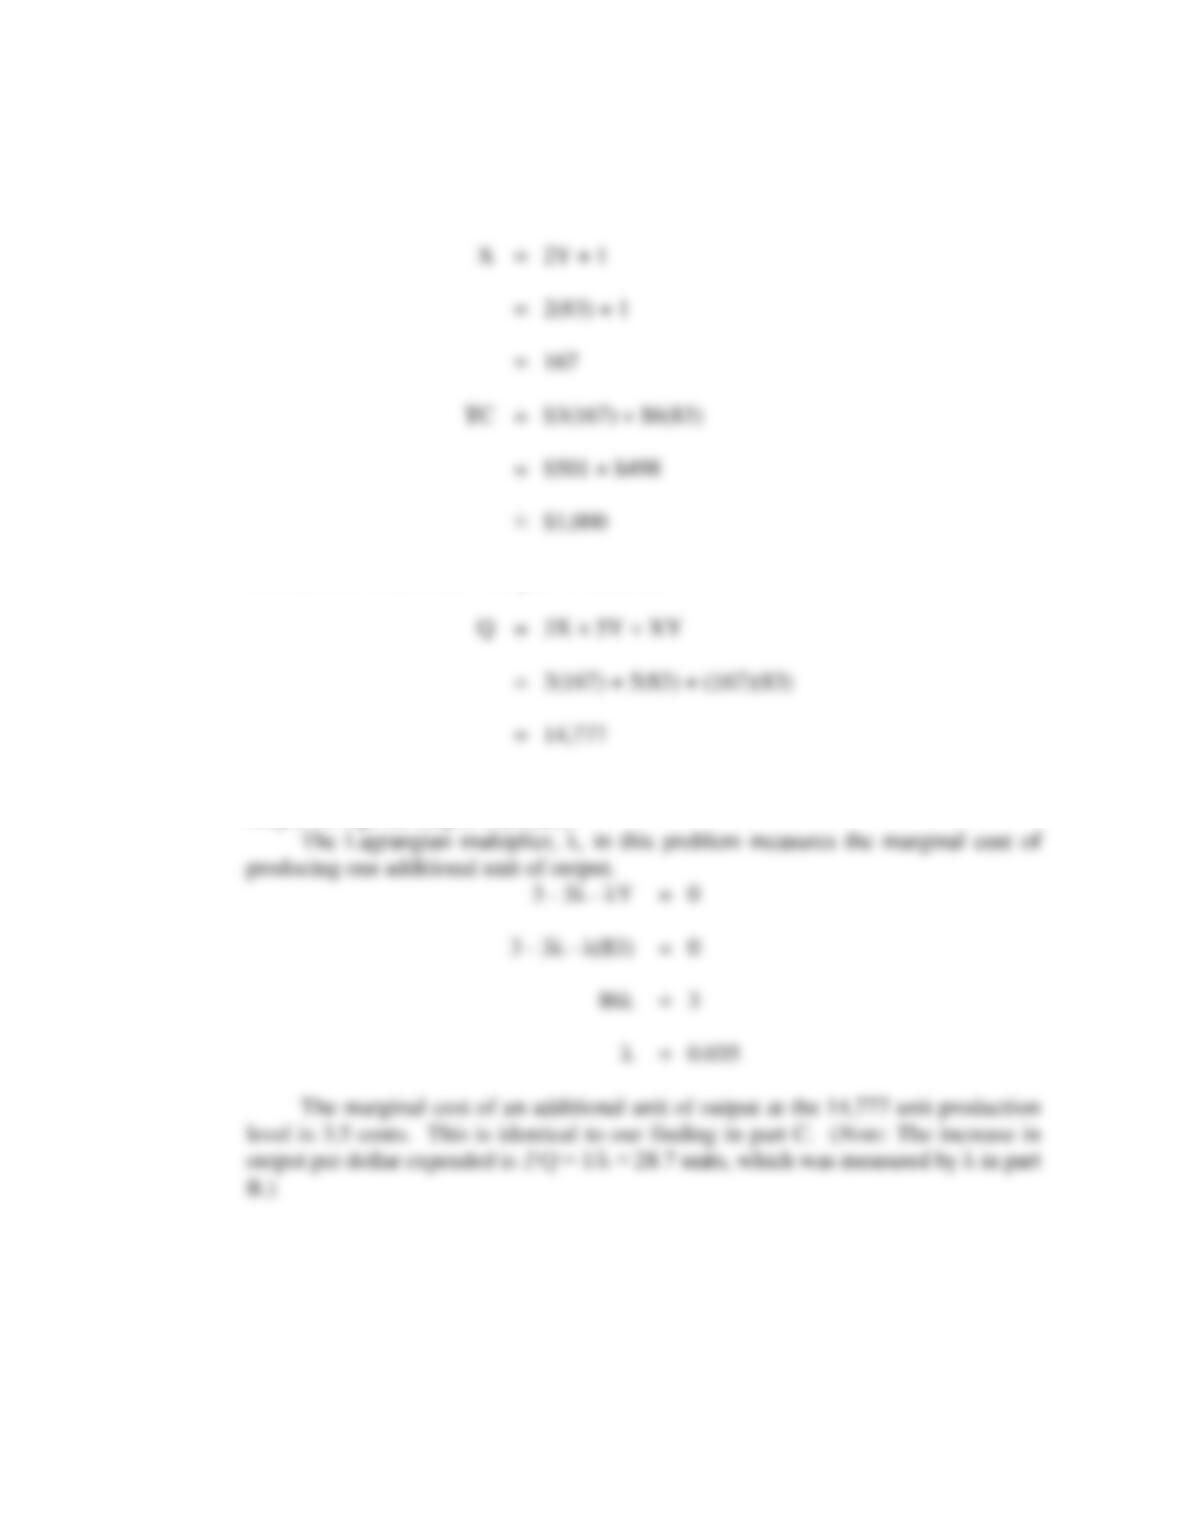
This answer is identical with part A because,
Maximizing output subject to a given budget constraint is equivalent to minimizing cost
subject to a given output constraint.