CHAPTER 7
PRODUCTION AND COST IN THE FIRM
In this chapter, you will find:
Learning Outcomes
Chapter Outline with PowerPoint Script
Chapter Summary
Teaching Points (as on Prep Card)
Solutions to Problems Appendix
Experiential Assignments
INTRODUCTION
This chapter describes key characteristics governing how firms operate in the short run and the long run.
Perhaps the most important concepts in the chapter are the shapes and the logic of the short-run and long-run
cost curves. These cost curves will be utilized throughout the microeconomics section to explain the firm’s
supply behavior.
LEARNING OUTCOMES
7-1 Distinguish the three types of profit and explain what each reflects.
Firms try to earn a profit by transforming resources into salable products. These resources, whether
7-2 Describe the most important feature of production in the short run and what causes it.
Output can be changed in the short run by adjusting variable resources, such as labor, but the size, or
7-3 Explain why average cost is at a minimum when marginal cost equals average cost.
As long as marginal cost is below average cost, marginal cost pulls down average cost as output expands.
7-4 Explain the sources of economies of scale and diseconomies of scale.
For any given firm, the long-run average cost curve is formed by connecting the points on the various
short-run average cost curves that represent the lowest per-unit cost for each rate of output. Each of the
short-run average cost curves is tangent to the long-run average cost curve, or planning curve. These
points of tangency represent the least-cost way of producing each particular rate of output. If a firm
Chapter 7 Production and Cost in the Firm 98
CHAPTER OUTLINE WITH POWERPOINT SCRIPT
USE POWERPOINT SLIDES 2-3 FOR THE FOLLOWING SECTION
Cost and Profit: We assume that producers try to maximize profit.
USE POWERPOINT SLIDES 4-5 FOR THE FOLLOWING SECTION
Alternative Measures of Profit
• Accounting Profit: Total revenue minus explicit costs.
USE POWERPOINT SLIDE 6 FOR THE FOLLOWING SECTION
Production in the Short Run
Fixed and Variable Resources
• Variable resources: Can be varied quickly to change the output rate.
USE POWERPOINT SLIDES 7-9 FOR THE FOLLOWING SECTION
The Law of Diminishing Marginal Returns
• Production function: The relationship between the amount of resources employed and total product or
output.
• Marginal product: The change in total product resulting from an additional unit of labor.
USE POWERPOINT SLIDE 10 FOR THE FOLLOWING SECTION
The Total and Marginal Product Curves: When marginal product
• Rises, total product increases at an increasing rate.
USE POWERPOINT SLIDES 11-15 FOR THE FOLLOWING SECTION
Costs in the Short Run:
• Fixed cost: Costs that are independent of output and must be paid even if no output is produced.
• Variable cost: Cost of variable resources
Total Cost and Marginal Cost in the Short Run
Chapter 7 Production and Cost in the Firm
99
USE POWERPOINT SLIDE 16 FOR THE FOLLOWING SECTION
Average Cost in the Short Run
• Average Variable Cost: Variable cost divided by output or VC/q
USE POWERPOINT SLIDES 17-19 FOR THE FOLLOWING SECTION
The Relationship Between Marginal Cost and Average Cost: Marginal cost pulls down average cost where
marginal cost is below average cost and pulls up average cost where marginal cost is above average cost.
Summary of Short-Run Cost Curves: The law of diminishing marginal returns determines the shape of
short-run cost curves:
• When the marginal product of labor increases, the marginal cost of output falls.
USE POWERPOINT SLIDES 20-24 FOR THE FOLLOWING SECTION
Costs in the Long Run: Long run is best thought of as a planning horizon.
The Long-Run Average Cost Curve: The curve indicating the lowest average cost of production at each rate
USE POWERPOINT SLIDES 25-26 FOR THE FOLLOWING SECTION
• Long-run average cost curves are U-shaped because of economies and diseconomies of scale.
Economies of Scale
USE POWERPOINT SLIDE 27 FOR THE FOLLOWING SECTION
Economies and Diseconomies of Scale at the Firm Level
CHAPTER SUMMARY
Explicit costs are opportunity costs of resources employed by a firm that take the form of cash payments.
Implicit costs are the opportunity costs of using resources owned by the firm. A firm earns a normal profit
when total revenue covers all implicit and explicit costs. Economic profit equals total revenue minus both
Chapter 7 Production and Cost in the Firm 100
The law of diminishing marginal returns from the variable resource is the most important feature of production
in the short run and explains why marginal cost and average cost eventually increase as output expands.
In the long run, all inputs under the firm’s control are variable, so there is no fixed cost. The firm’s long-run
average cost curve, also called its planning curve, is an envelope formed by a series of short-run average total
cost curves. The long run is best thought of as a planning horizon.
TEACHING POINTS
1. This chapter presents the construction of cost curves for the individual firm. Students who master this
material should have no problem understanding the sections of the text dealing with market structure. The
cost curves discussed in this chapter are inherently quantitative, and those students with weaker math
backgrounds need exercises that force them to derive average cost and marginal cost from the basics.
2. The chapter begins with a discussion of the meaning of the total and marginal products of labor, which
is the only variable resource considered in the short run. Exhibit 2 shows the relationship between labor
3. It should not be hard to explain the concept of diminishing marginal returns. It is important to empha-
4. Exhibit 4 is particularly useful for class discussion. Some students find the numerical examples particu-
larly illuminating. An interesting way to approach this material is to leave certain parts of the table blank
and ask students to use the filled-in parts to guide them in completing the table. You need delete only one
table entry per line to make this an interesting exercise.
5. Exhibit 5 shows the relationship between the total cost curve and the marginal cost curve. Since mar-
6. Exhibits 6 and 7 are crucial to understanding cost in the short run and must be covered with great care.
Because the marginal cost curve ultimately drives the variable and total cost curves, understanding why
Chapter 7 Production and Cost in the Firm
101
average total cost curves. A clear way to depict the relationship between marginal and average is to use
the impact on the average class height when a tall or short student joins the class.
7. The long-run average cost curve should be presented as an envelope curve based on selection of the
SOLUTIONS TO PROBLEMS APPENDIX
1. (Explicit and Implicit Costs) Amos McCoy is currently raising corn on his 100-acre farm and earning an
accounting profit of $100 per acre. However, if he raised soybeans, he could earn $200 per acre. Is he
currently earning an economic profit? Why or why not?
Amos McCoy is not currently making an economic profit, despite the fact that he is making an
2. (Explicit and Implicit Costs) Determine whether each of the following is an explicit cost or an implicit
cost:
a) Payments for labor purchased in the labor market
b) A firm’s use of a warehouse that it owns and could rent to another firm
c) Rent paid for the use of a warehouse not owned by the firm
d) The wages that owners could earn if they did not work for themselves
3. (Alternative Measures of Profit) Calculate the accounting profit or loss as well as the economic profit or
loss in each of the following situations:
a. A firm with total revenues of $150 million, explicit cost of $90 million, and implicit costs of $40
million
b. A firm with total revenues of $125 million, explicit cost of $100 million, and implicit costs of $30
million
c. A firm with total revenues of $100 million, explicit cost of $90 million, and implicit costs of $20
million
d. A firm with total revenues of $250,000, explicit cost of $275,000, and implicit costs of $50,000
a. Accounting profit = $60 million; economic profit = $20 million
Chapter 7 Production and Cost in the Firm 102
4. (Alternative Measures of Profit) Why is it reasonable to think of normal profit as a type of cost to the
firm?
Recall that firms produce output using four kinds of resources—natural resources, labor, capital, and
5. (Production in the Short Run) Complete the following table. At what point does diminishing marginal
returns set in?
Units of the
Variable Resource Total Product Marginal Product
0 0 —
1 10 —
2 22 —
3 — 9
4 — 4
5 34 —
Units of the
Variable Resource Total Product Marginal Product
0 0 —
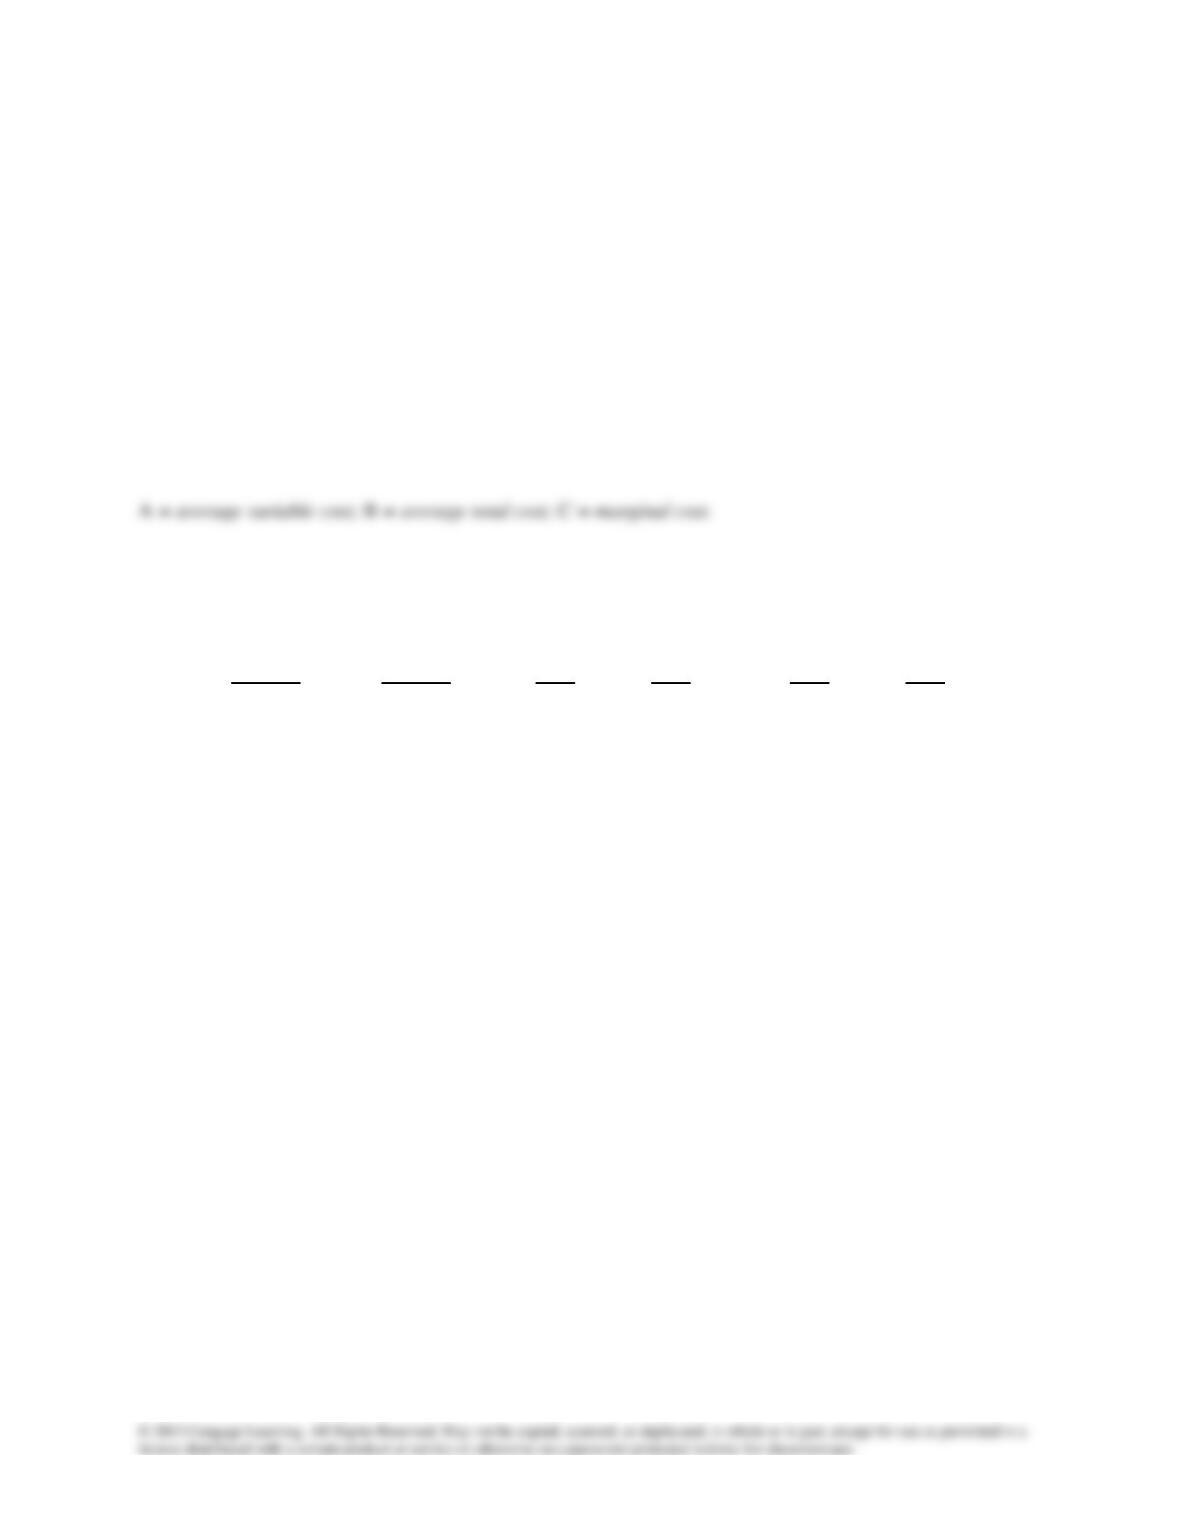
6. (Costs in the Short Run) Identify each of the
curves in the following graph:
C
Chapter 7 Production and Cost in the Firm
103
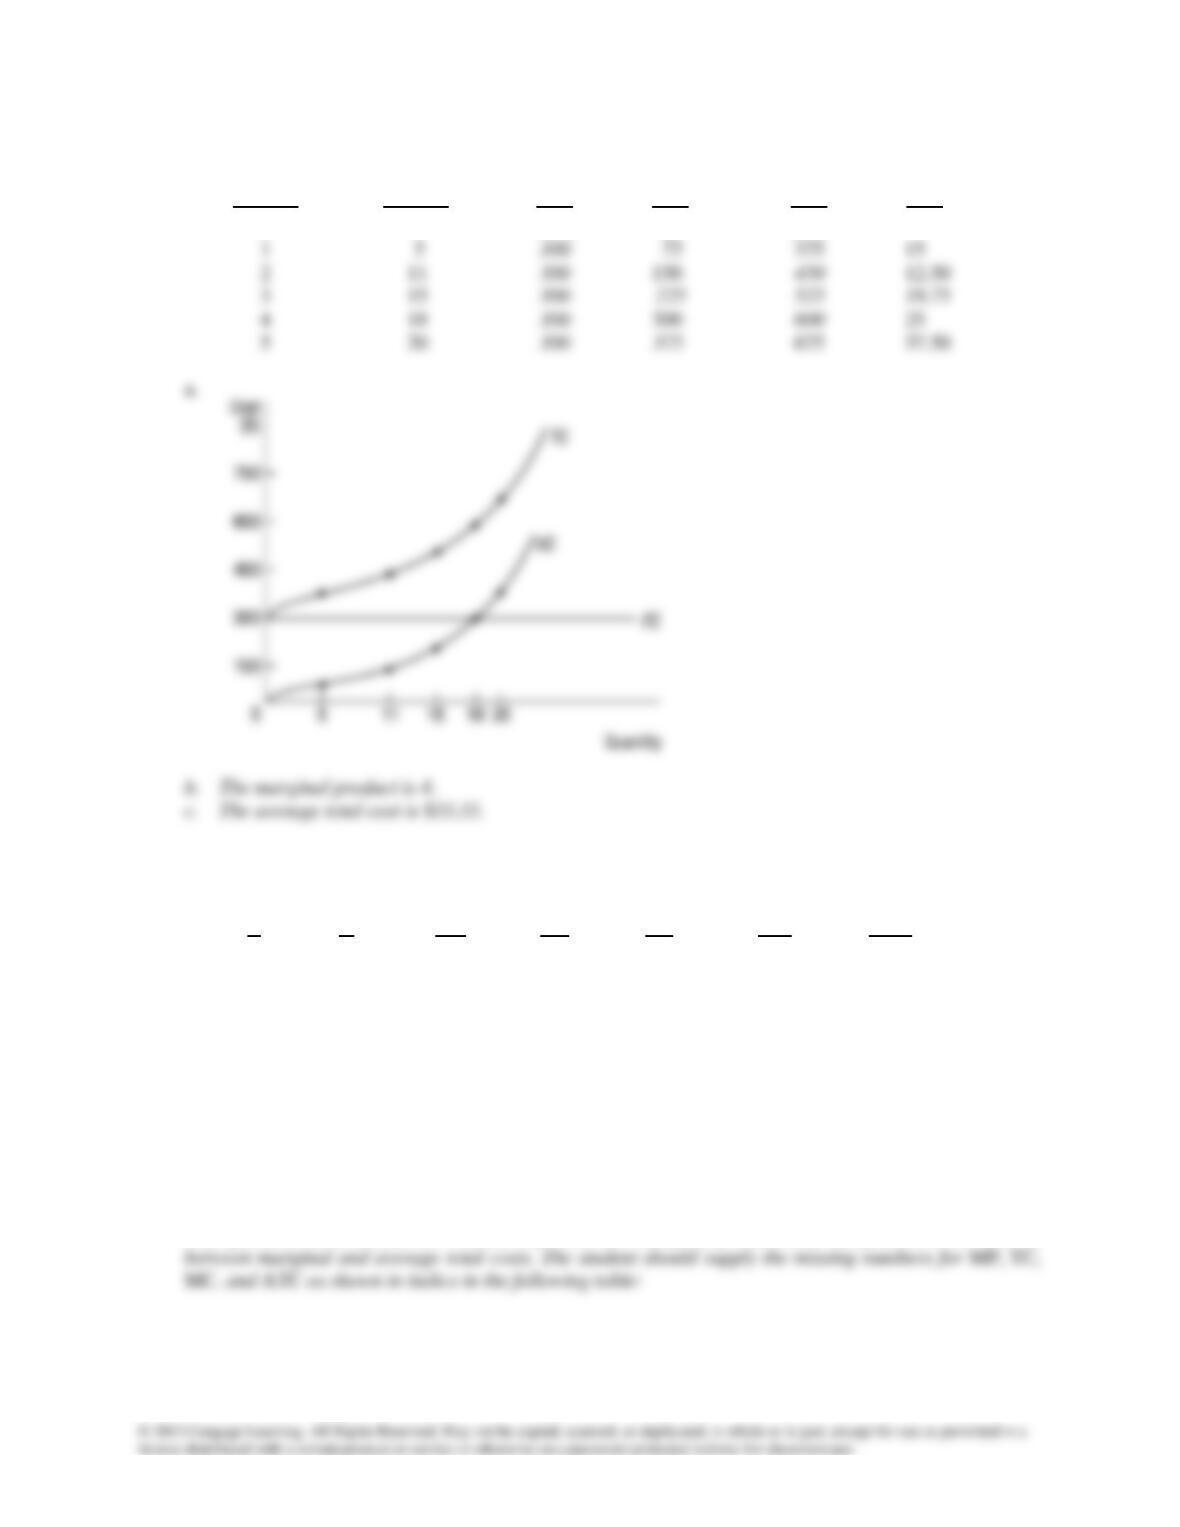
7. (Total Cost and Marginal Cost) Complete the following table, assuming that each unit of labor costs $75
per day.
Quantity
of Labor Output Fixed Variable Total Marginal
per Day per Day Cost Cost Cost Cost
0 $___ $300 $____ $____ $___
1 5 ___ 75 ___ 15
2 11 ___ 150 450 12.50
3 15 ___ ___ 525 ___
4 18 ___ 300 600 25
5 20 ___ ___ ___ 37.50
a. Graph the fixed cost, variable cost, and total cost curves for these data.
b. What is the marginal product of the third unit of labor?
c. What is average total cost when output is 18 units per day?
A
Chapter 7 Production and Cost in the Firm 104
Quantity
of Labor Output Fixed Variable Total Marginal
per Day per Day Cost Cost Cost Cost
0 0 $300 $0 $300 —
8. (Total Cost and Marginal Cost) Complete the following table, where L is units of labor, Q is units of
output, and MP is the marginal product of labor.
L Q MP VC TC MC ATC
0 0 ____ $ 0 $12 $__ $__
1 6 ____ 3 15 ___ ___
2 15 ____ 6 ___ ___ ___
3 21 ____ 9 ___ ___ ___
4 24 ____ 12 ___ ___ ___
5 26 ____ 15 ___ ___ ___
a. At what level of labor input do the marginal returns to labor begin to diminish?
b. What is the average variable cost when Q = 24?
c. What is this firm’s fixed cost?
d. What is the wage rate per day?
This question demonstrates the relationships between marginal product and marginal costs as well as
Chapter 7 Production and Cost in the Firm
105
L Q MP VC TC MC ATC
0 0 — $ 0 $12 — —
9. (Relationship Between Marginal Cost and Average Cost) Assume that labor and capital are the only
inputs used by a firm. Capital is fixed at 5 units, which cost $100 each. Workers can be hired for $200
each. Complete the following table to show average variable cost (AVC), average total cost (ATC), and
marginal cost (MC).
Quantity of
Labor Total Output AVC ATC MC
0 0 $___ $___ $___
1 100 ____ ____ ____
2 250 ____ ____ ____
3 350 ____ ____ ____
4 400 ____ ____ ____
5 425 ____ ____ ____
Quantity of
Labor Total Output AVC (VC/Q) ATC(TC/Q) MC(∆TC/∆Q)
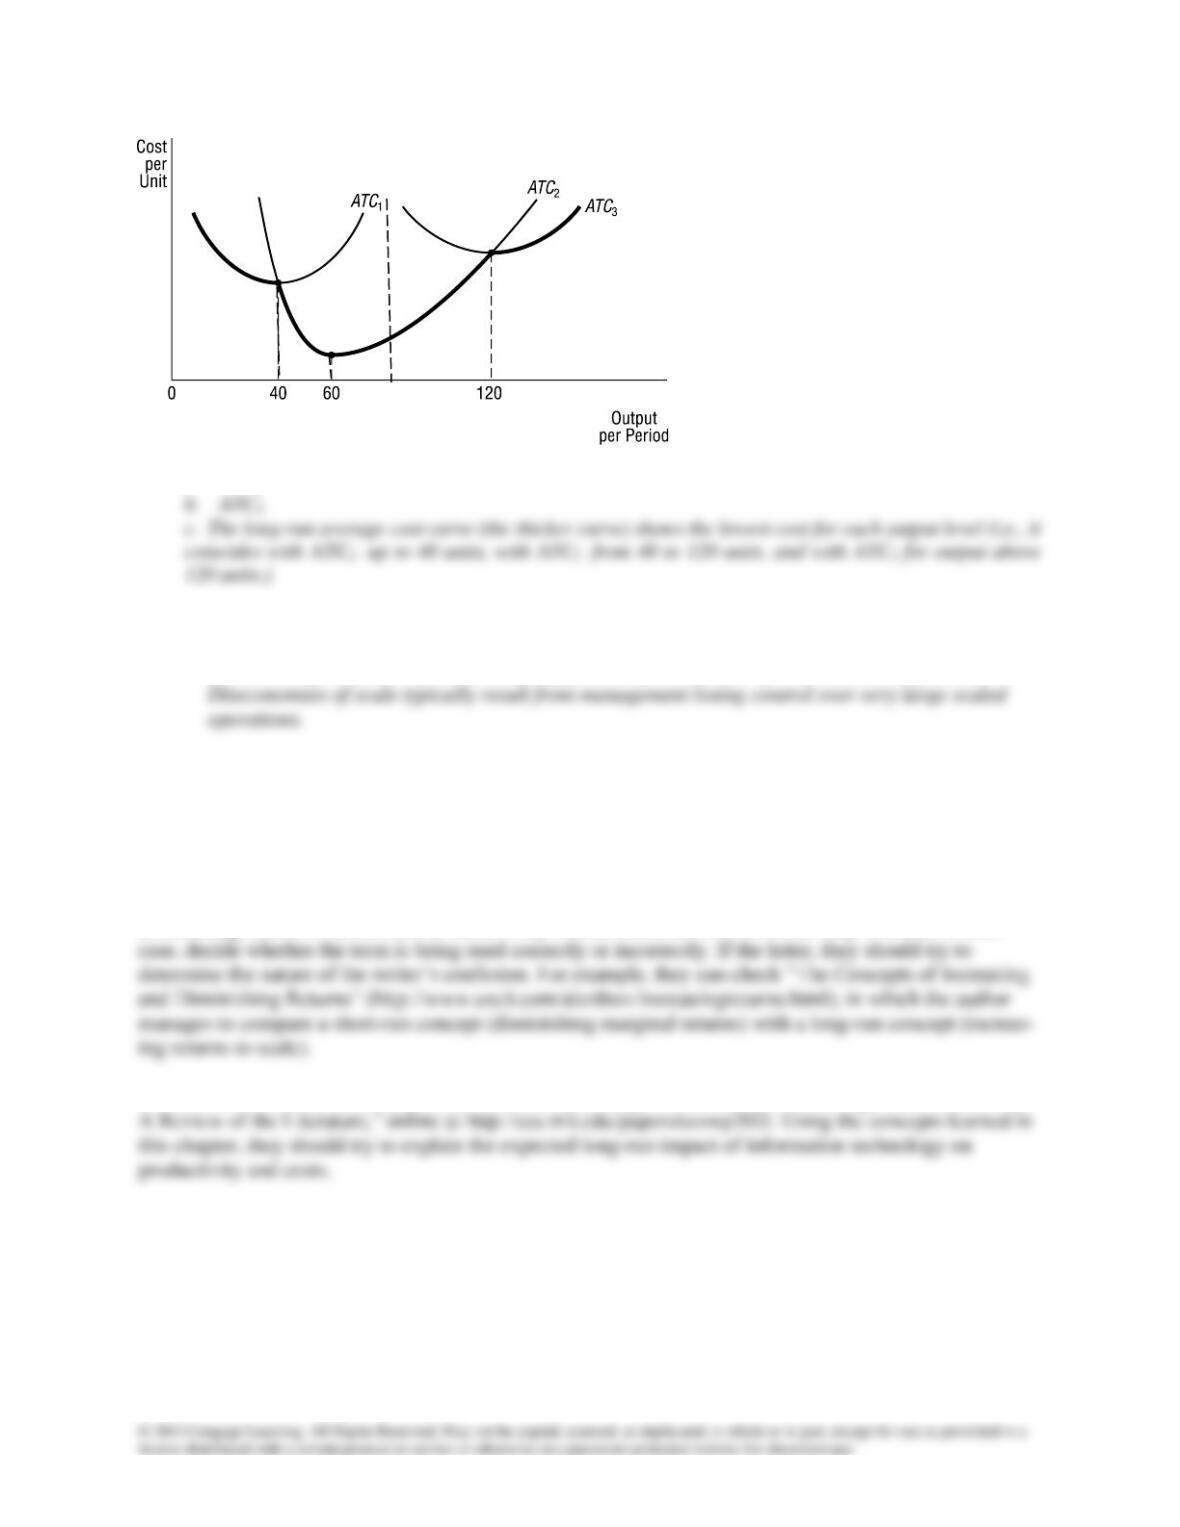
10. (Long-Run Costs) Suppose the firm has only three possible scales of production as shown below:
a. Which scale of production is most efficient when Q = 65?
b. Which scale of production is most efficient when Q = 75?
c. Trace out the long-run average cost curve on the diagram.
Chapter 7 Production and Cost in the Firm 106
75
a. ATC2
11. (Scale Economies) Identify sources of economies of scale and diseconomies of scale.
Economies of scale are often the result of greater specialization of labor and management.
Experiential Assignments
1. The terms “diminishing returns” and “economies of scale” are often referred to in everyday
discussions and in the popular press. Have students use an Internet search engine to search for
diminishing returns or economies of scale. They should check the first five sites they find and, in each
2. Have students read Erik Brynjolfsson and Shinkyu Yang’s “Information Technology and Productivity: