Forecasting 153
P6.4 Cost Forecasting. Dorothy Gale, a quality-control supervisor for Wizard Products, Inc.,
is concerned about unit labor cost increases for the assembly of electrical snap-action
switches. Costs have increased from $80 to $100 per unit over the previous three years.
Gale thinks that importing switches from foreign suppliers at a cost of $115.90 per unit
may soon be desirable.
A. Calculate the company’s unit labor cost growth rate using the constant rate of
change model with continuous compounding.
B. Forecast when unit labor costs will equal the current cost of importing.
P6.4 SOLUTION
154 Chapter 6
P6.5 Unit Sales Forecasting. Claire Littleton has discovered that the change in Product A
demand in any given week is inversely proportional to the change in sales of Product B in
the previous week. That is, if sales of B rose by X% last week, sales of A can be expected
to fall by X% this week.
A. Write the equation for next week’s sales of A, using the variables A = sales of
Product A, B = sales of Product B, and t = time. Assume that there will be no
shortages of either product.
B. Last week, 100 units of A and 90 units of B were sold. Two weeks ago, 75 units of
B were sold. What would you predict the sales of A to be this week?
P6.5 SOLUTION
P6.6 Revenue Forecasting. Kate Austen must generate a sales forecast to convince the loan
officer at a local bank of the viability of Marina Del Rey, a trendy west-coast restaurant.
Austen assumes that next-period sales are a function of current income, advertising, and
advertising by a competing restaurant.
A. Write an equation for predicting sales if Austen assumes that the percentage change
in sales is twice as large as the percentage changes in income and advertising but
that it is only one-half as large as, and the opposite sign of, the percentage change
in competitor advertising. Use the variables S = sales, Y = income, A = advertising,
and CA = competitor advertising.
Forecasting 155
B. During the current period, sales total $500,000, median income per capita in the
local market is $71,400, advertising is $20,000, and competitor advertising is
$66,000. Previous period levels were $70,000 (income), $25,000 (advertising), and
$60,000 (competitor advertising). Forecast next-period sales.
P6.6 SOLUTION
A.
St+1 = St +
S
1 –
A
A
2 +
S
1 –
Y
Y
2 t
1t-
t
t
1t-
t
B.
P6.7 Cost Forecasting. Dr. Izobel Stevens is supervising physician at the Westbury HMO, a
New York City-based medical facility serving the poor and indigent. Stevens is evaluating
the cost effectiveness of a preventive maintenance program, and believes that monthly
156 Chapter 6
downtime on the packaging line caused by equipment breakdown is related to the hours
spent each month on preventive maintenance.
A. Write an equation to predict next month’s downtime using the variables D =
B. If 40 hours were spent last month on preventive maintenance and this month’s
downtime was 500 hours, what should downtime be next month if preventive
maintenance this month is 50 hours? Use the equation developed in part A.
P6.7 SOLUTION
P6.8 Sales Forecast Modeling. Toys Unlimited Ltd., must forecast sales for a popular adult
computer game to avoid stockouts or excessive inventory charges during the upcoming
Christmas season. In percentage terms, the company estimates that game sales fall at
double the rate of price increases and that they grow at triple the rate of customer traffic
increases. Furthermore, these effects seem to be independent.
Forecasting 157
B. Forecast this season‘s sales if Toys Unlimited sold 10,000 games last season at
$15 each, this season’s price is anticipated to be $16.50, and customer traffic is
expected to rise by 15% over previous levels.
P6.8 SOLUTION
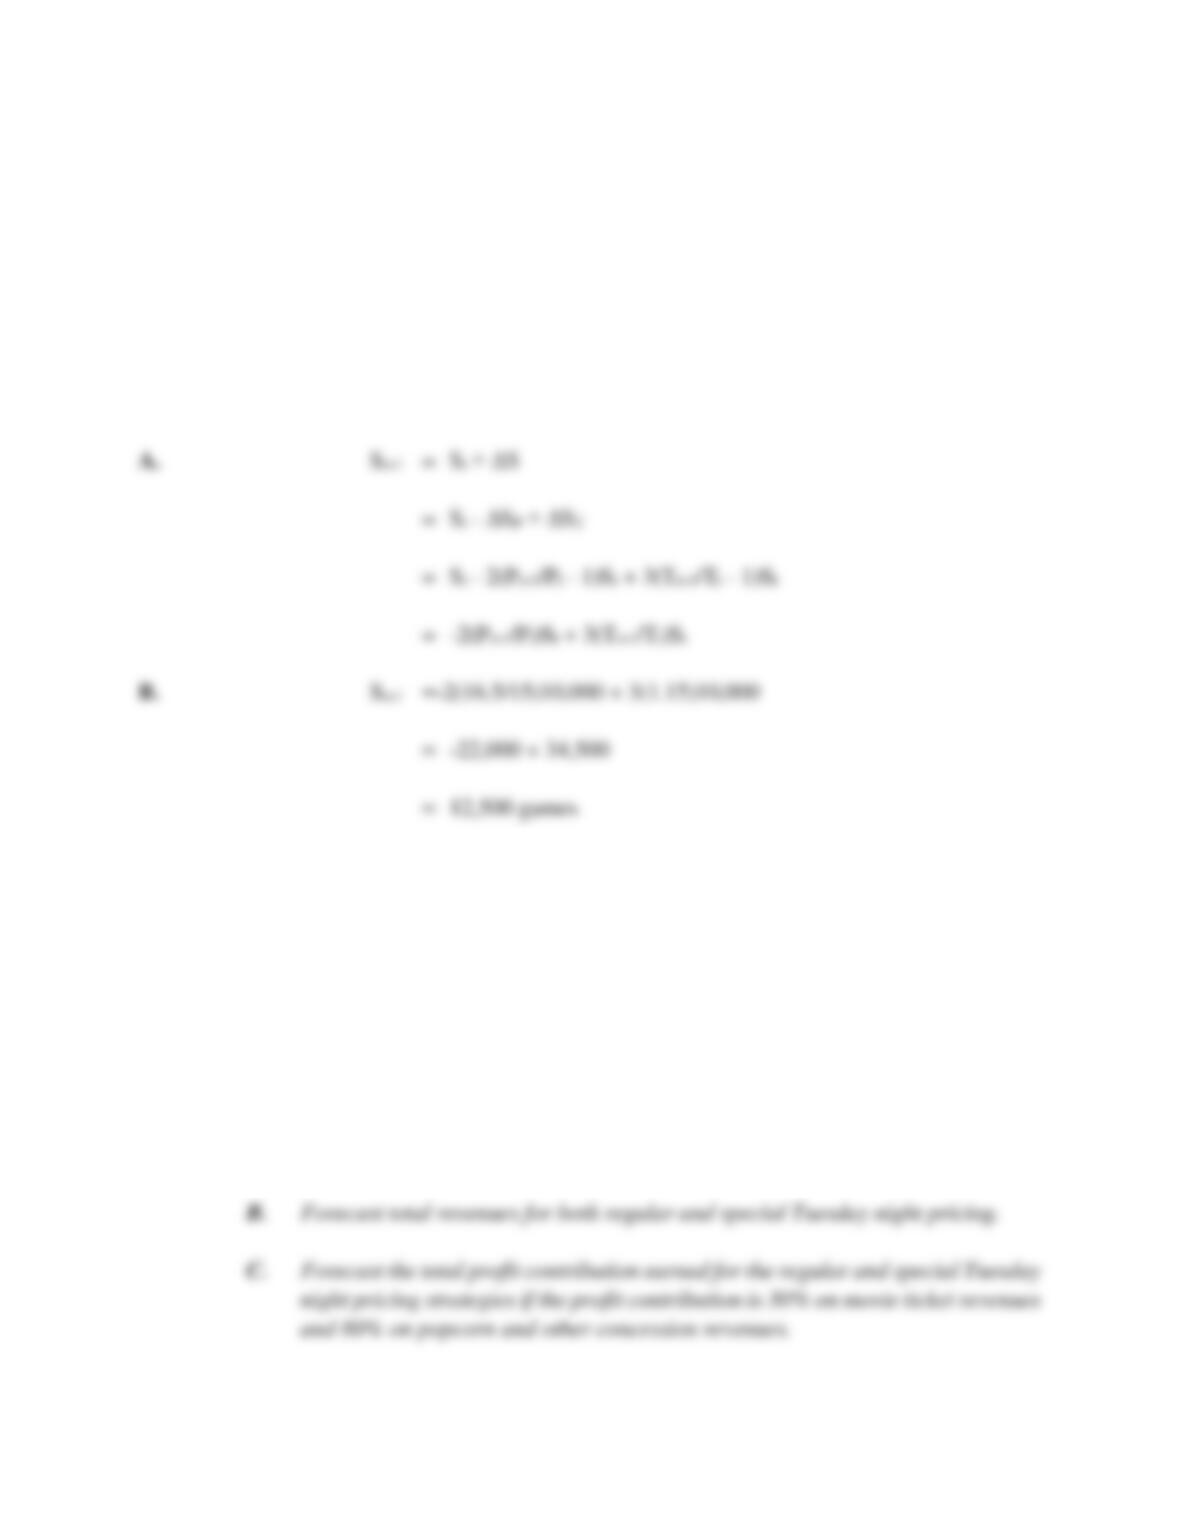
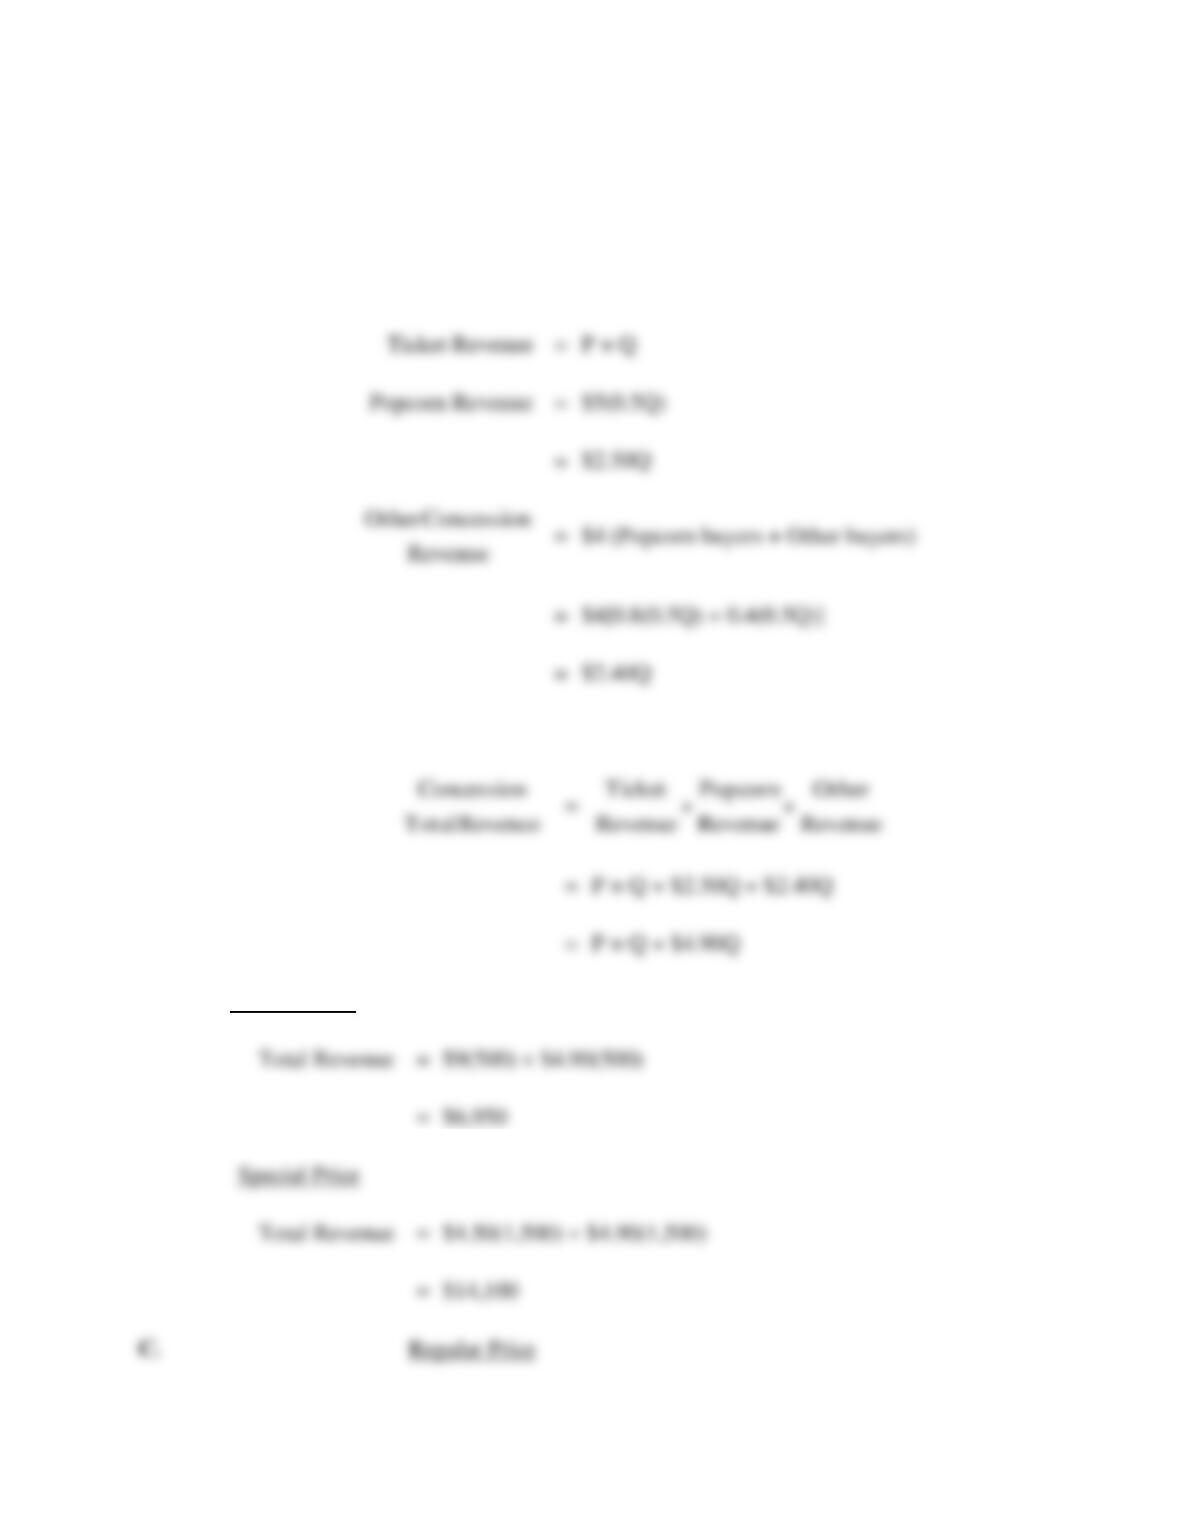
P6.9 Simultaneous Equations. Mid-Atlantic Cinema, Inc., runs a chain of movie theaters in
the east-central states and has enjoyed great success with a Tuesday Night at the Movies
promotion. By offering half off its regular $9 admission price, average nightly
attendance has risen from 500 to 1,500 persons. Popcorn and other concession
revenues tied to attendance have also risen dramatically. Historically, Mid-Atlantic has
found that 50% of all moviegoers buy a $5 cup of buttered popcorn. Eighty percent of
these popcorn buyers, plus 40% of the moviegoers that do not buy popcorn, each spend
an average of $4 on soda and other concessions.
A. Write an expression describing total revenue from tickets plus popcorn plus other
concessions.
158 Chapter 6
P6.9 SOLUTION
A. If Q is the number of moviegoers, then:
Therefore,
B. Regular Price
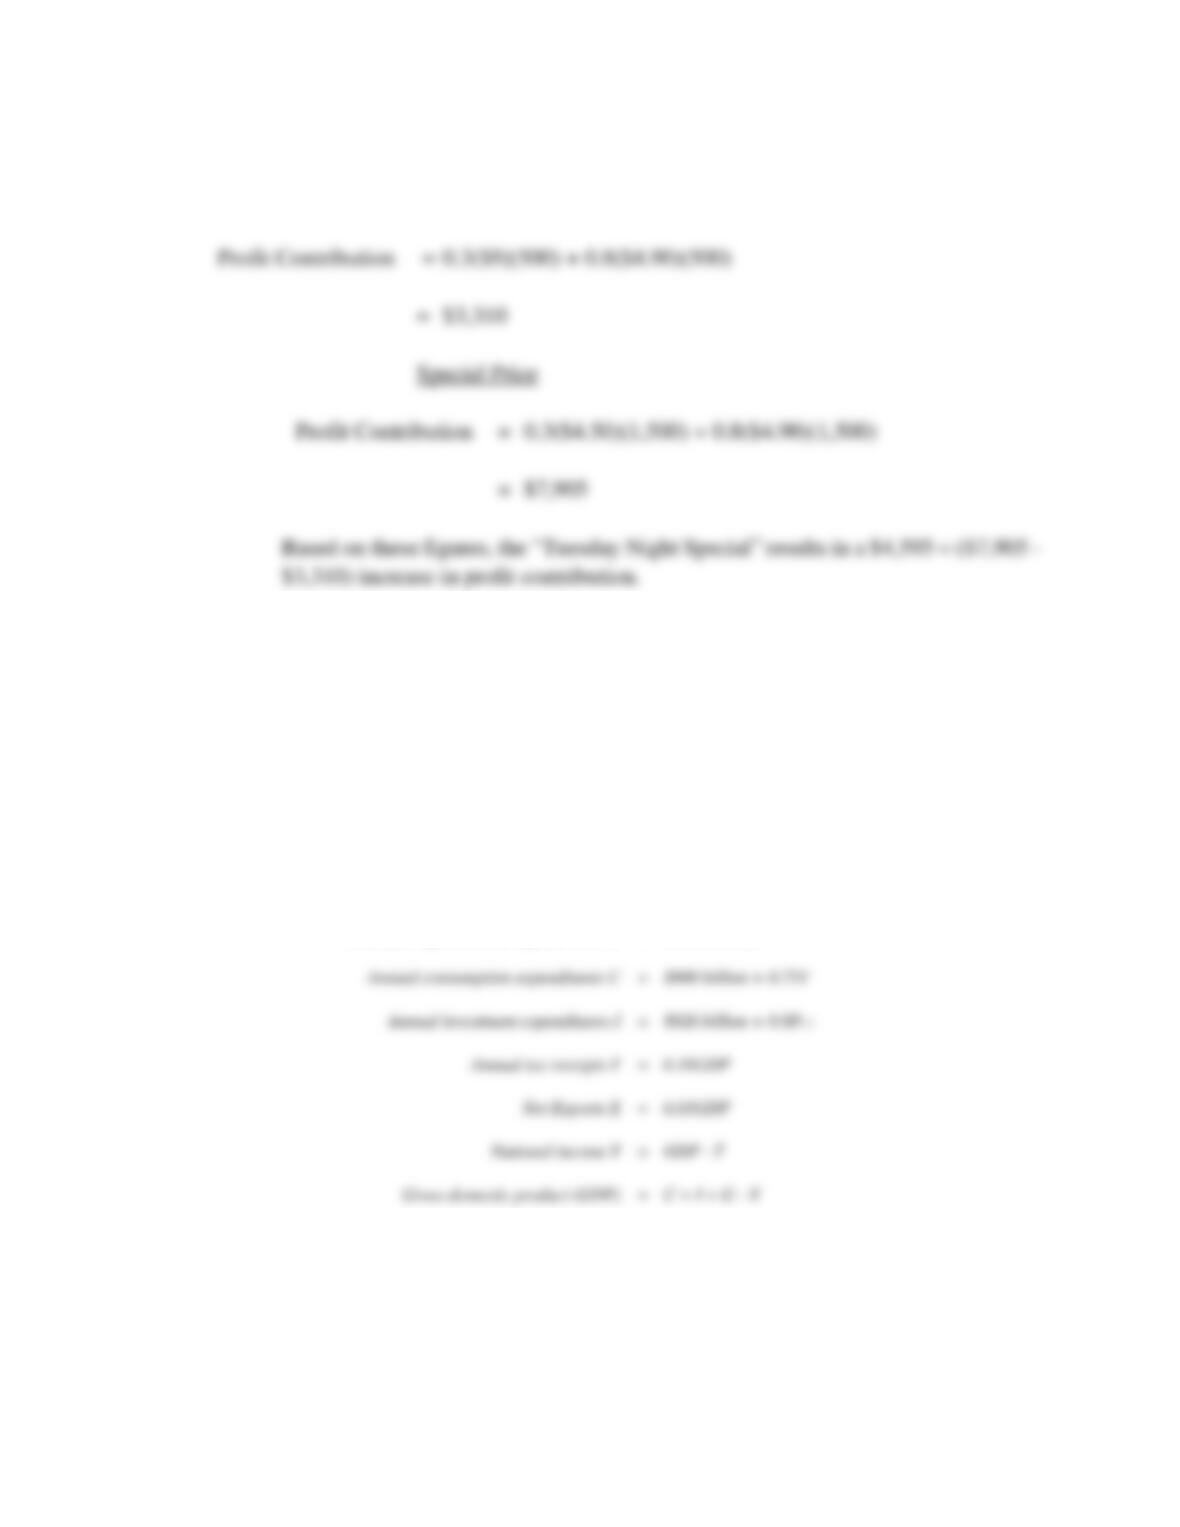
Forecasting 159
P6.10 Simultaneous Equations. Supersonic Industries, based in Seattle, Washington,
manufactures a wide range of parts for aircraft manufacturers. The company is currently
evaluating the merits of building a new plant to fulfill a new contract with the federal
government. The alternatives to expansion are to use additional overtime, to reduce other
production, or both. The company will add new capacity only if the economy appears to
be expanding. Therefore, forecasting the general pace of economic activity for the United
States is an important input to the decision-making process. The firm has collected data
and estimated the following relations for the U.S. economy:
Last year’s total profits (all corporations) Pt-1 = $1,200 billion
This year’s government expenditures G = $2,500 billion
Forecast each of the preceding variables through the simultaneous relations expressed in
the multiple equation system. Assume that all random disturbances average out to zero.
P6.10 SOLUTION
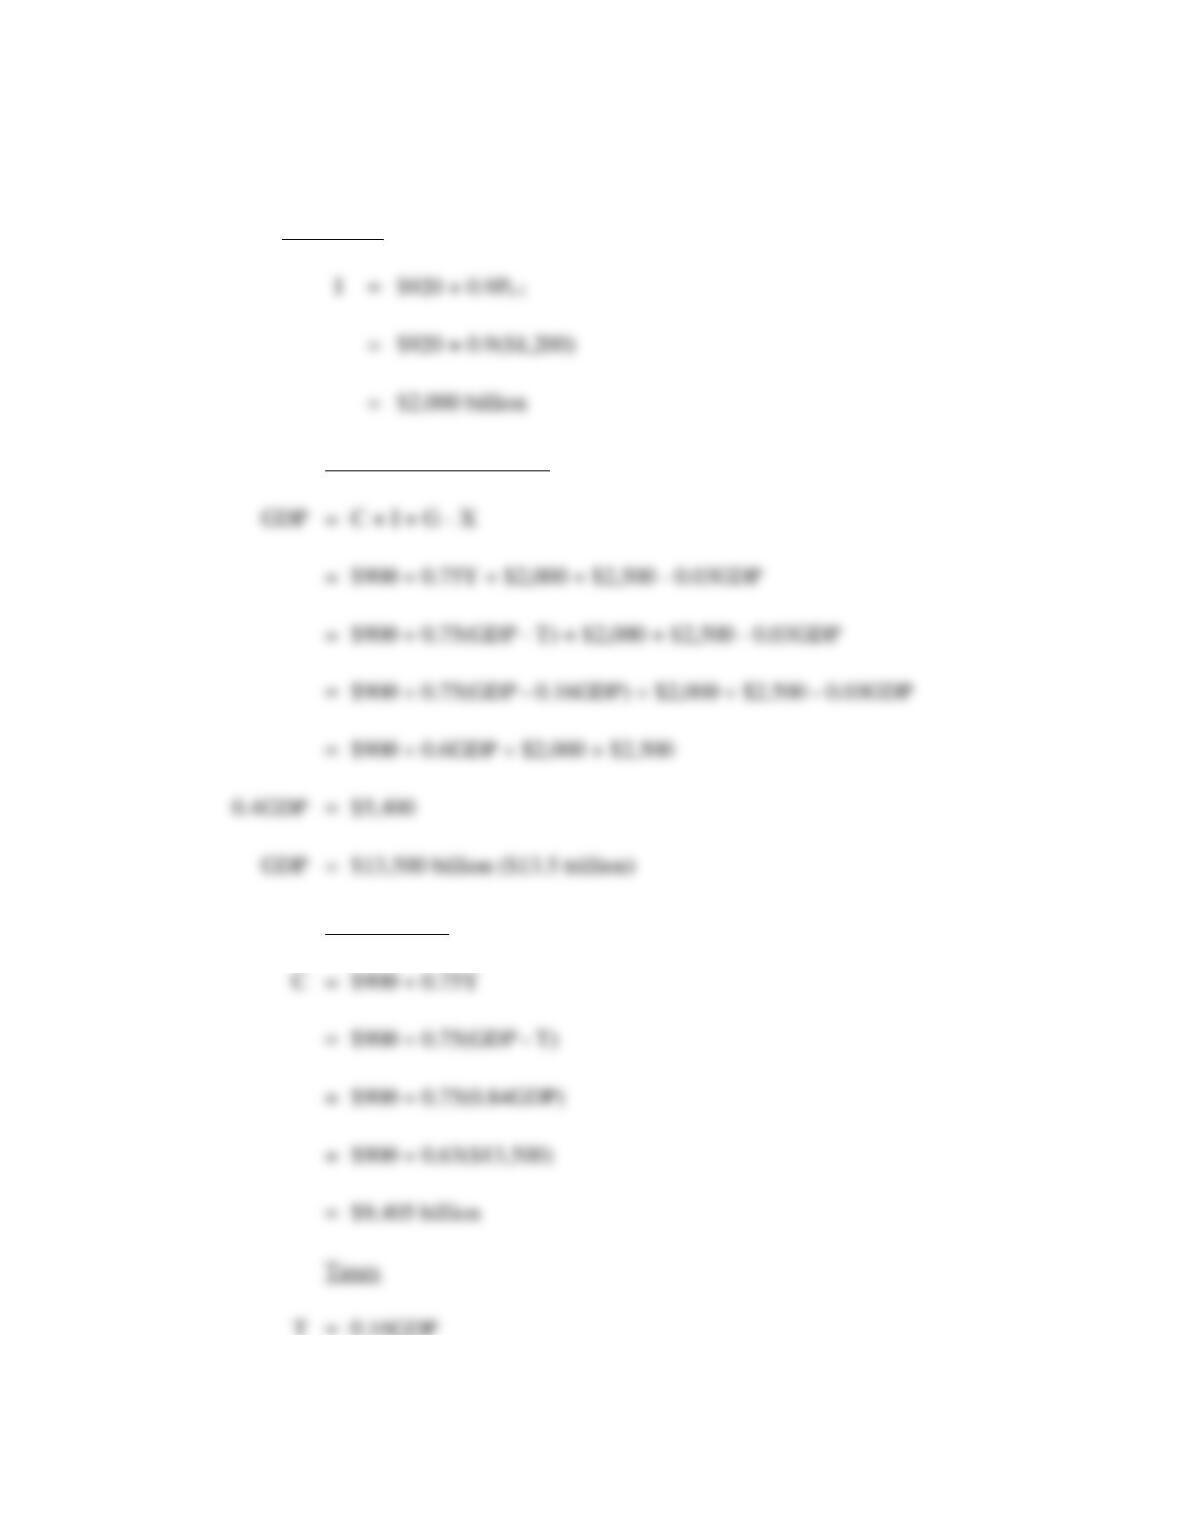
160 Chapter 6
Investment
Gross Domestic Product
Consumption
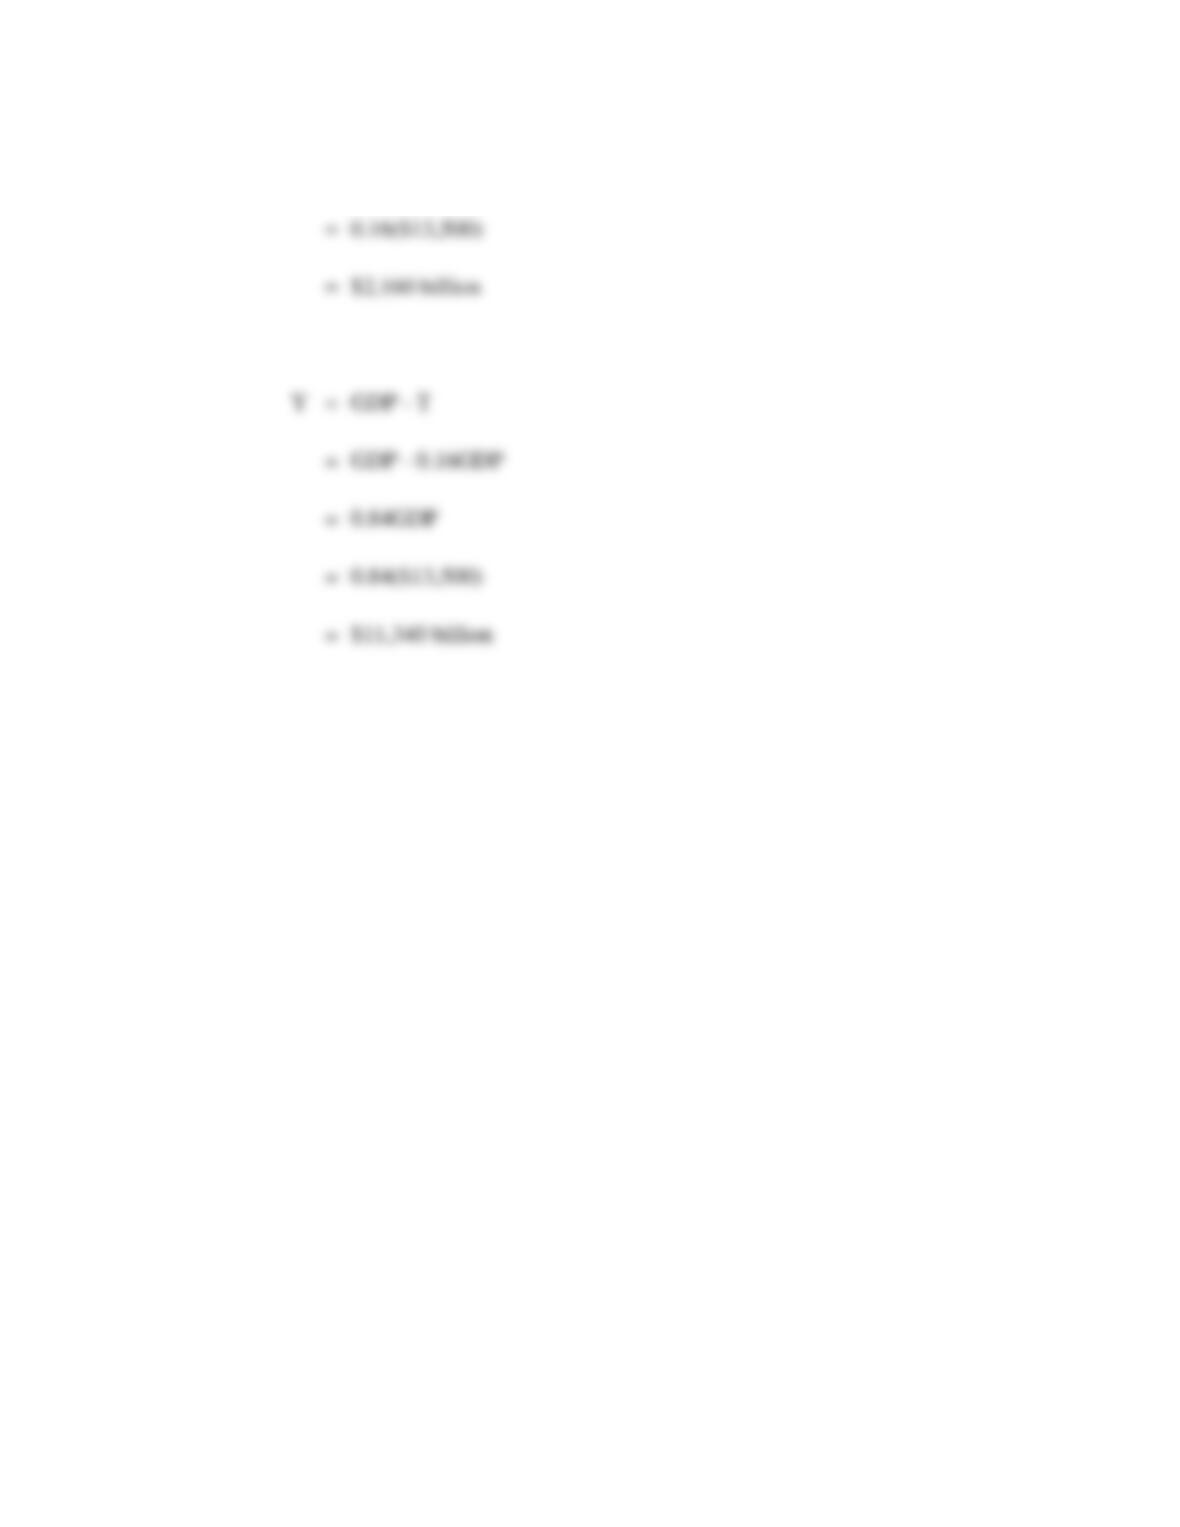
Forecasting 161
National Income
162 Chapter 6
CASE STUDY FOR CHAPTER 6
Forecasting Global Performance for a Mickey Mouse Organization
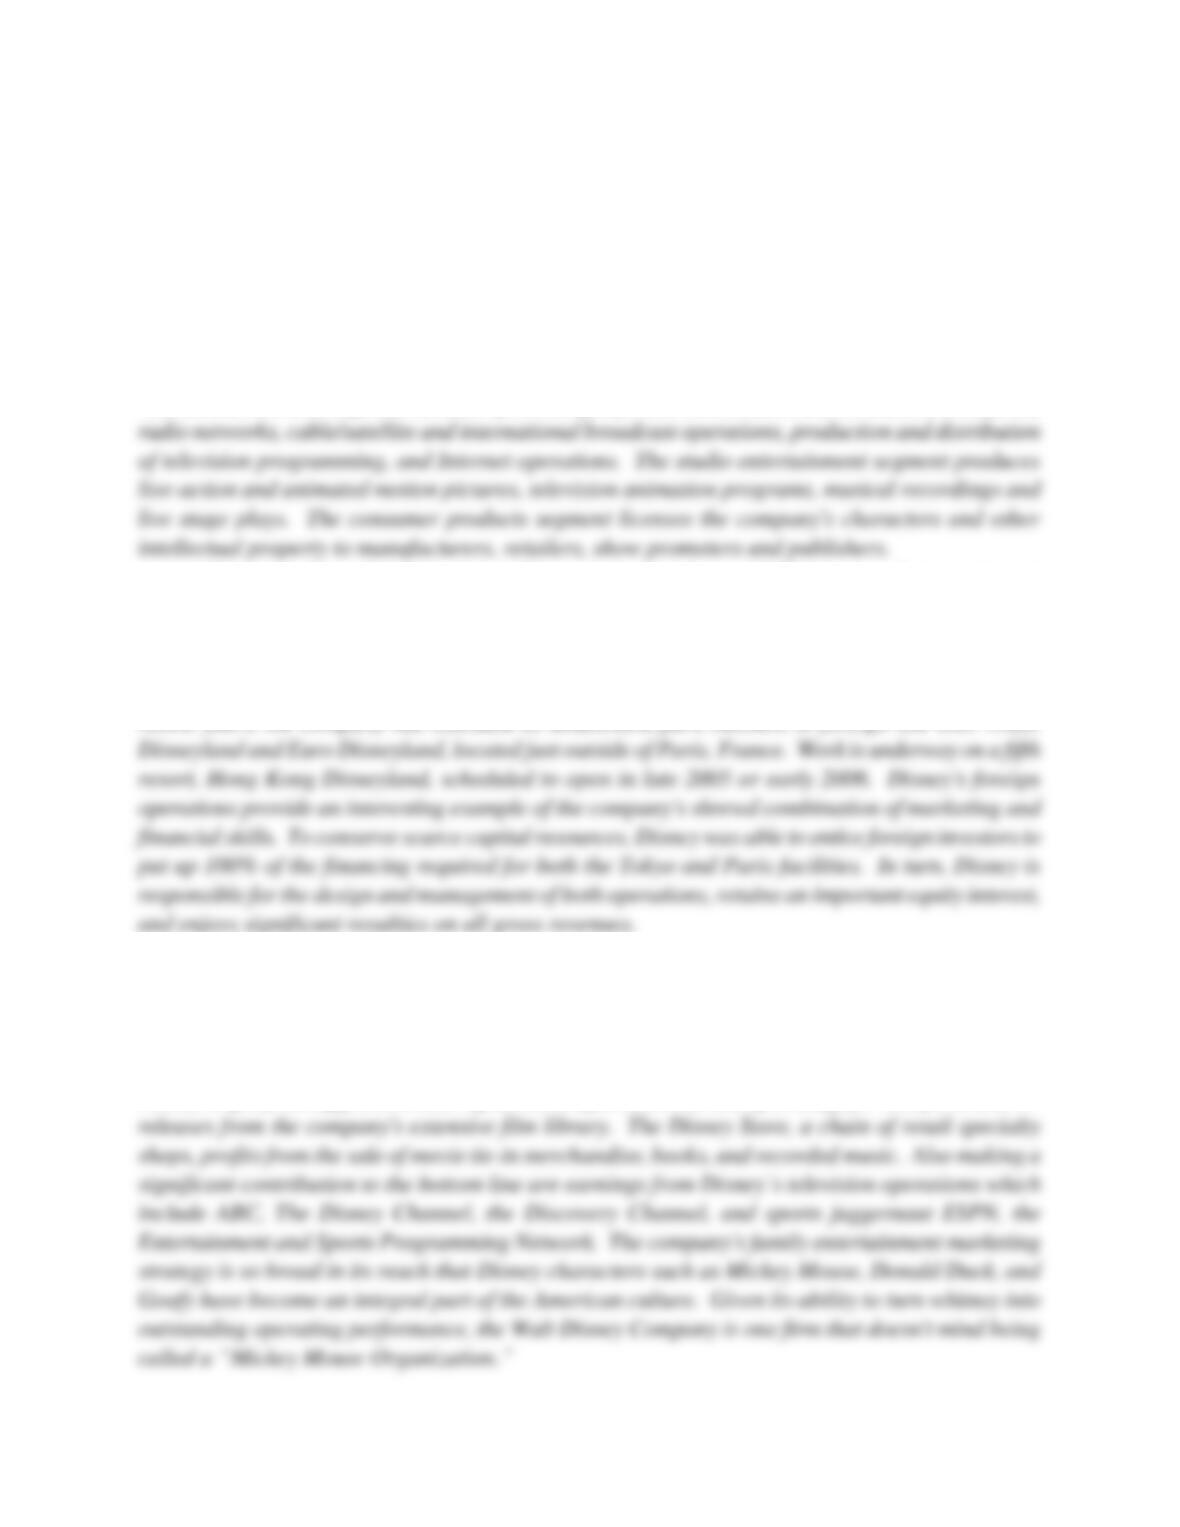
The Walt Disney Company is a diversified worldwide entertainment company with operations in four
business segments: media networks, parks and resorts, studio entertainment and consumer products.
The media networks segment consists of the company’s television (ABC, ESPN, and Discovery) and
Disney parks and resorts are at the cornerstone of a carefully integrated entertainment
marketing strategy. Through the parks and resorts segment, Walt Disney owns and operates four
destination resorts in the United States, Japan and France. In the United States, kids flock to
Disneyland, California, and Walt Disney World, Florida—an immense entertainment center that
includes the Animal Kingdom, Magic Kingdom, Epcot Center, and Disney-MGM Studios. During
recent years, the company has extended its amusement park business to foreign soil with Tokyo
Disney is also a major force in the movie picture production business with Buena Vista,
Touchstone, and Hollywood Pictures, in addition to the renowned Walt Disney Studios. The
company is famous for recent hit movies such as Finding Nemo, The Lion King, Pirates of the
Caribbean: The Curse of the Black Pearl, and The Sixth Sense, in addition to a film library
including hundreds of movie classics like Fantasia, Snow White, and Mary Poppins, among others.
Disney employs an aggressive and highly successful video marketing strategy for new films and re–
Forecasting 163
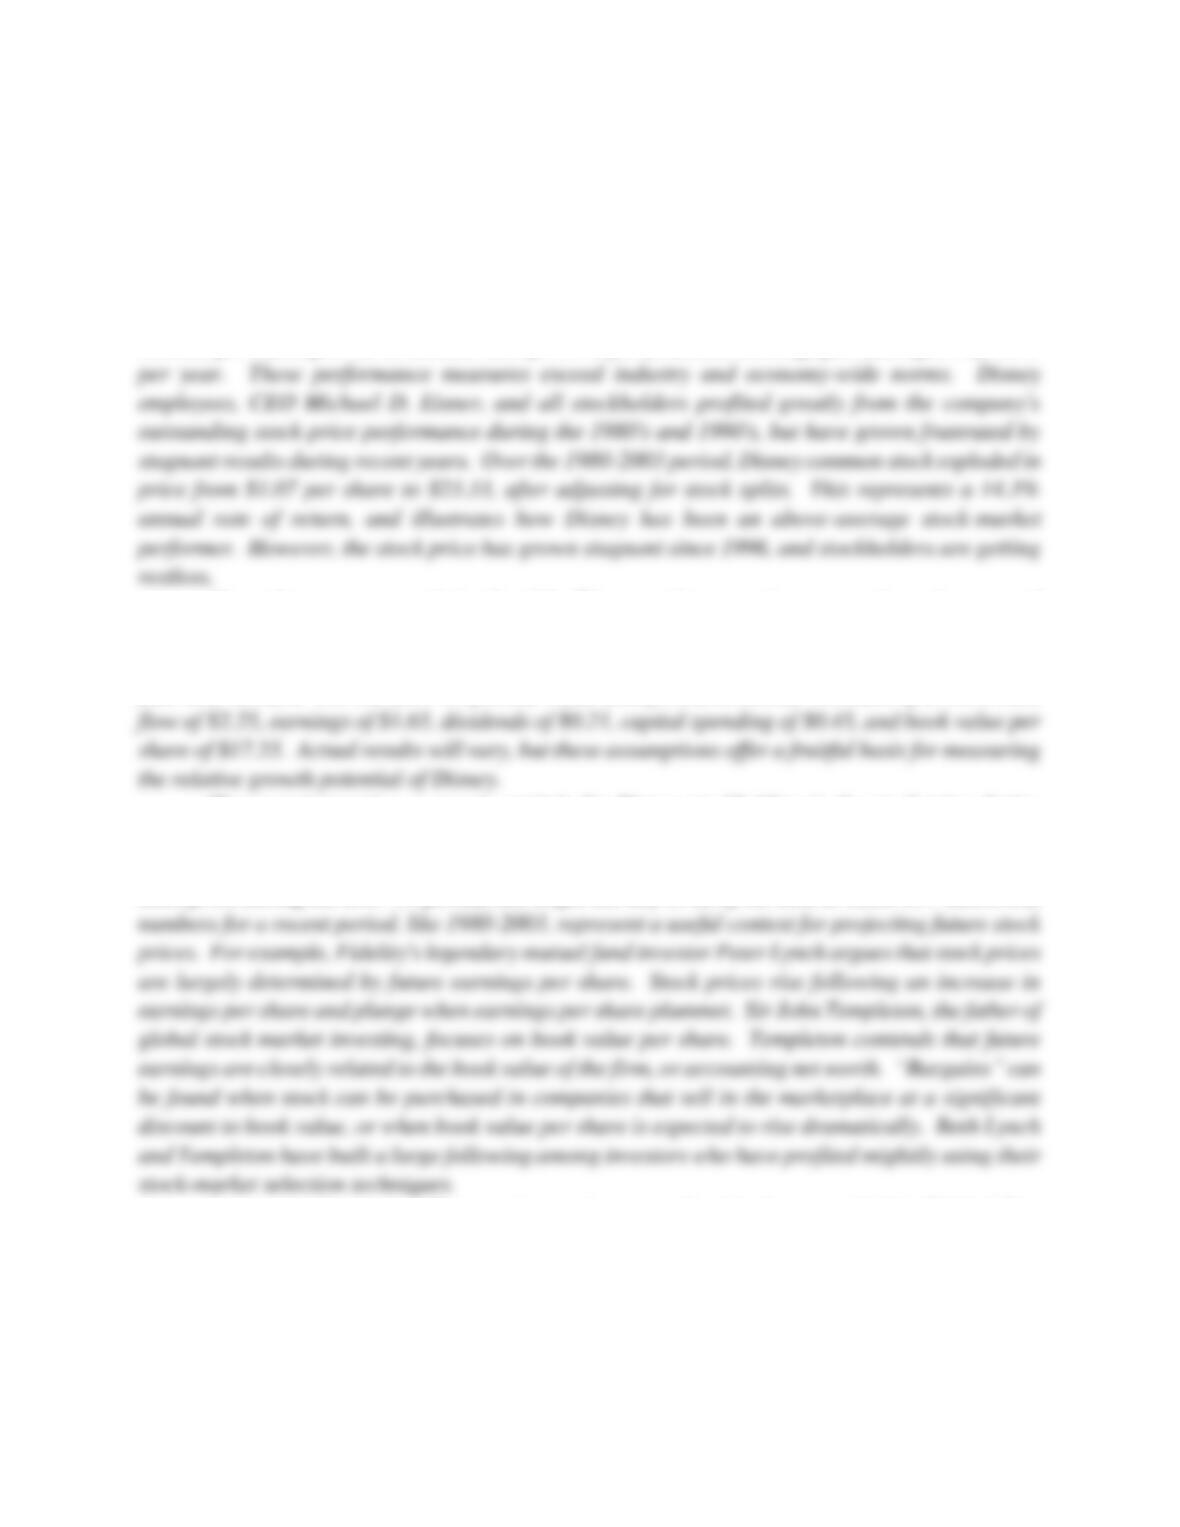
Table 6.7 shows a variety of accounting operating statistics, including revenues, cash flow,
capital spending, dividends, earnings, book value, and year-end share prices for the Walt Disney
Company during the 1980-2003 period. All data are expressed in dollars per share to illustrate how
individual shareholders have benefitted from the company’s growth. During this time frame,
revenue per share grew at an annual rate of 14.5% per year, and earnings per share grew by 9.0%
Given the many uncertainties faced by Disney and most major corporations, forecasts of
operating performance are usually restricted to a fairly short time perspective. The Value Line
Investment Survey, one of the most widely respected forecast services, focuses on a three– to five-
year time horizon. For the 2007-09 period, Value Line forecasts Disney revenues of $18.10, cash
The most interesting economic statistic for Disney stockholders is the stock price during
some future period, say 2007-09. In economic terms, stock prices represent the net present value of
future cash flows, discounted at an appropriate risk-adjusted rate of return. To forecast Disney’s
stock price during the 2007-09 period, one might use any or all of the data in Table 6.7. Historical
As an experiment, it will prove interesting to employ the data provided in Table 6.7 to
estimate regression models that can be used to forecast the average common stock price for The
Walt Disney Company over the 2007-09 period.
164 Chapter 6
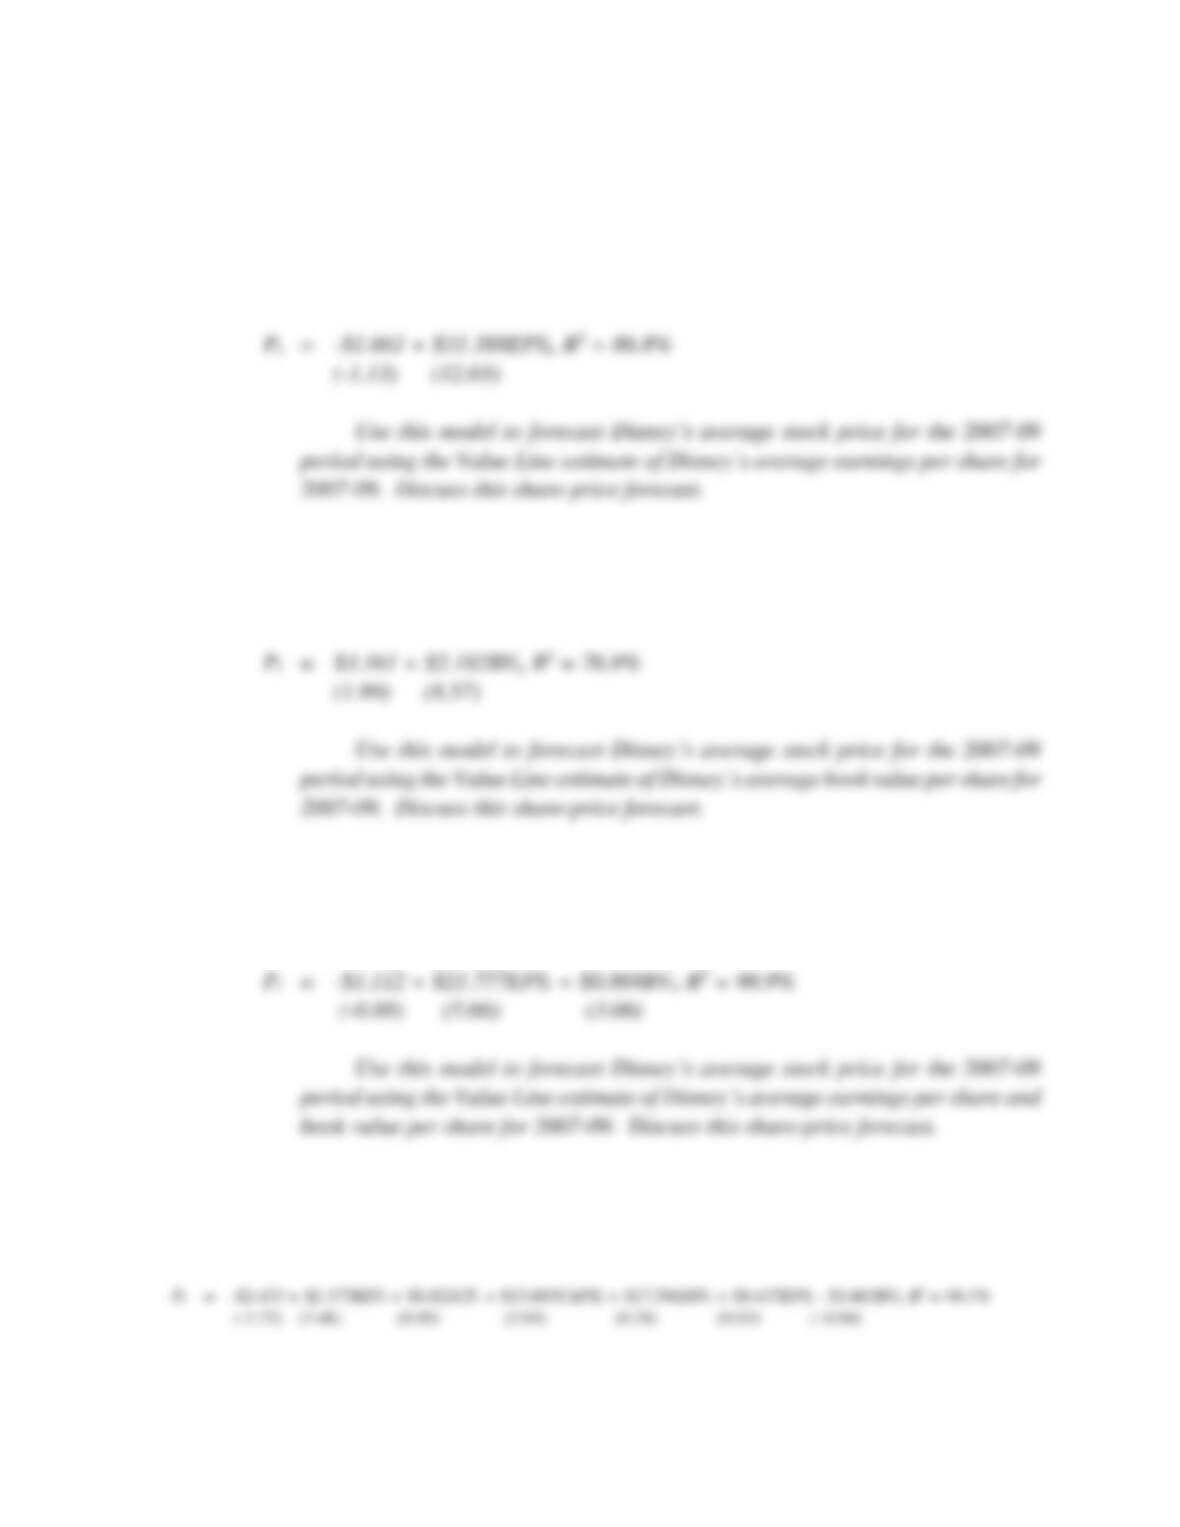
A. A simple regression model over the 1980-2003 period where the Y-variable is the
Disney year-end stock price and the X-variable is Disney’s earnings per share
reads as follows (t-statistics in parentheses):
B. A simple regression model over the 1980-2003 period where the Y-variable is the
Disney year-end stock price and the X-variable is Disney’s book value per share
reads as follows (t-statistics in parentheses):
C. A multiple regression model over the 1980-2003 period where the Y-variable is
the Disney year-end stock price and the X-variables are Disney’s earnings per
share and book value per share reads as follows (t-statistics in parentheses):
D. A multiple regression model over the 1980-2003 period where the y-variable is the
Disney year-end stock price and x-variables include the accounting operating
statistics shown in Table 6.7 reads as follows (t-statistics in parentheses):
Forecasting 165
Use this model and Value Line estimates to forecast Disney’s average stock
CASE STUDY SOLUTION
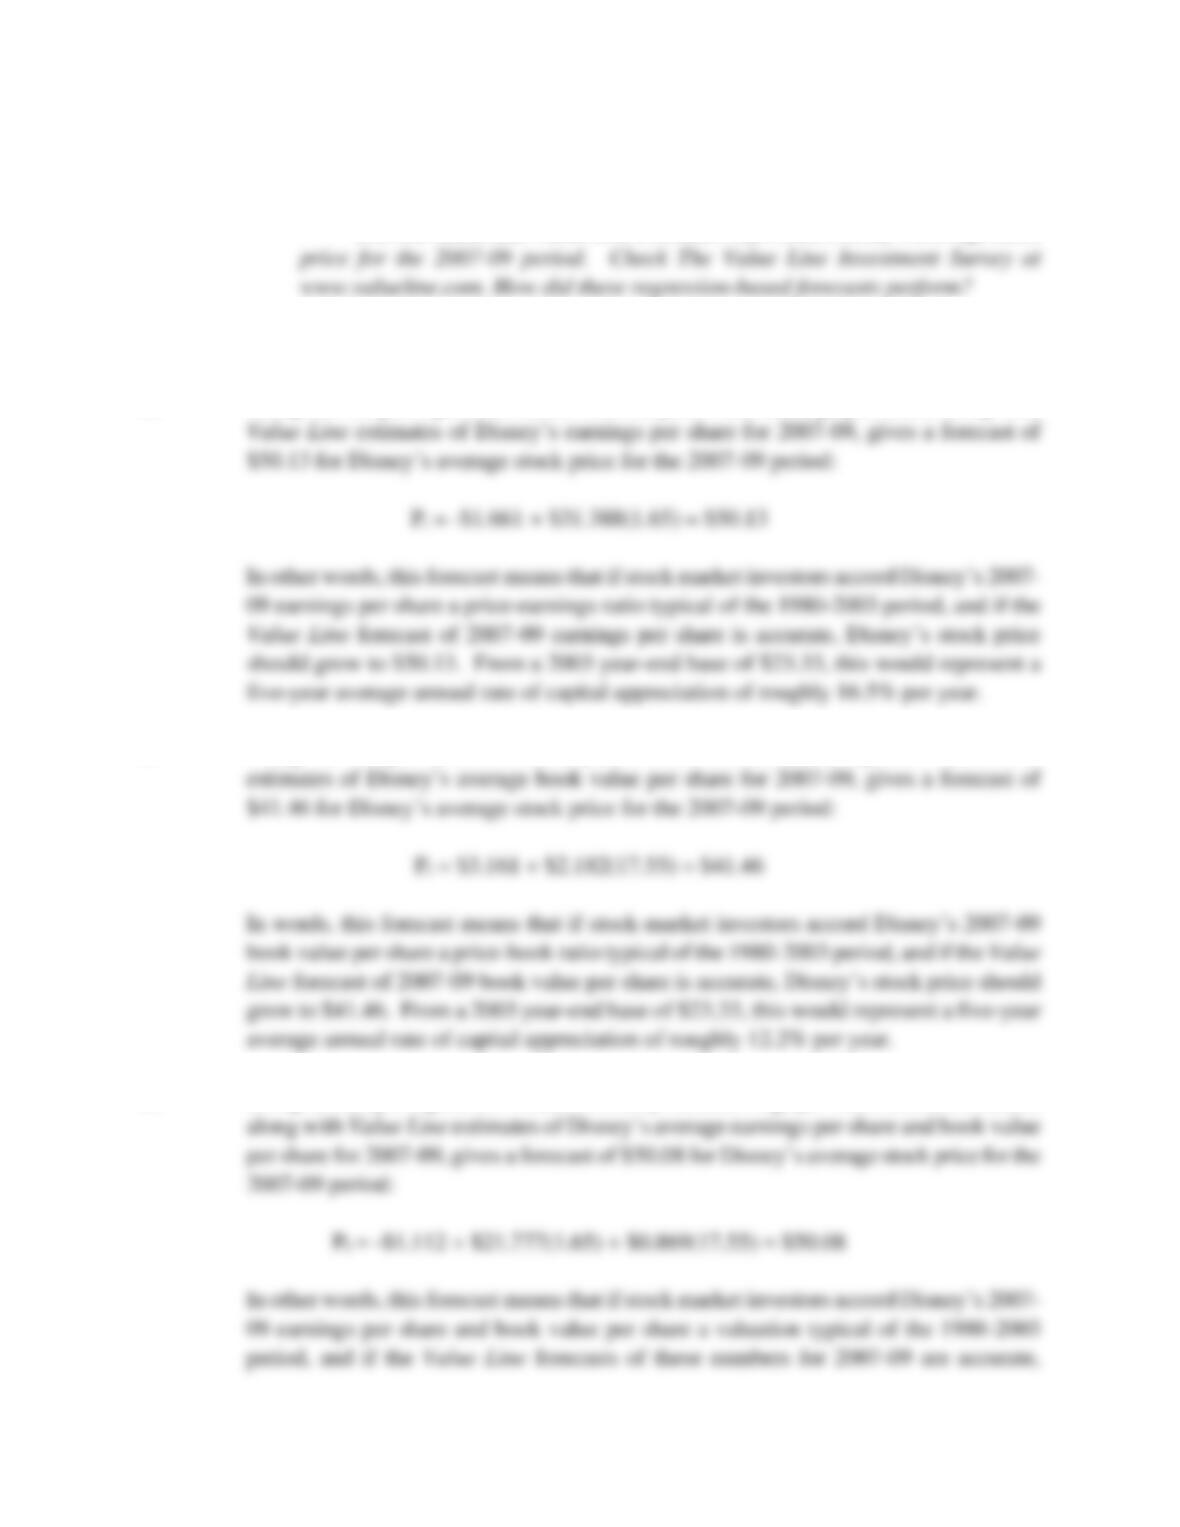
A. Using this simple regression model of stock prices and earnings per share, along with
B. Using this simple model of stock prices and book values, along with Value Line
C. Using a multiple regression model of stock prices, earnings per share and book values,
166 Chapter 6
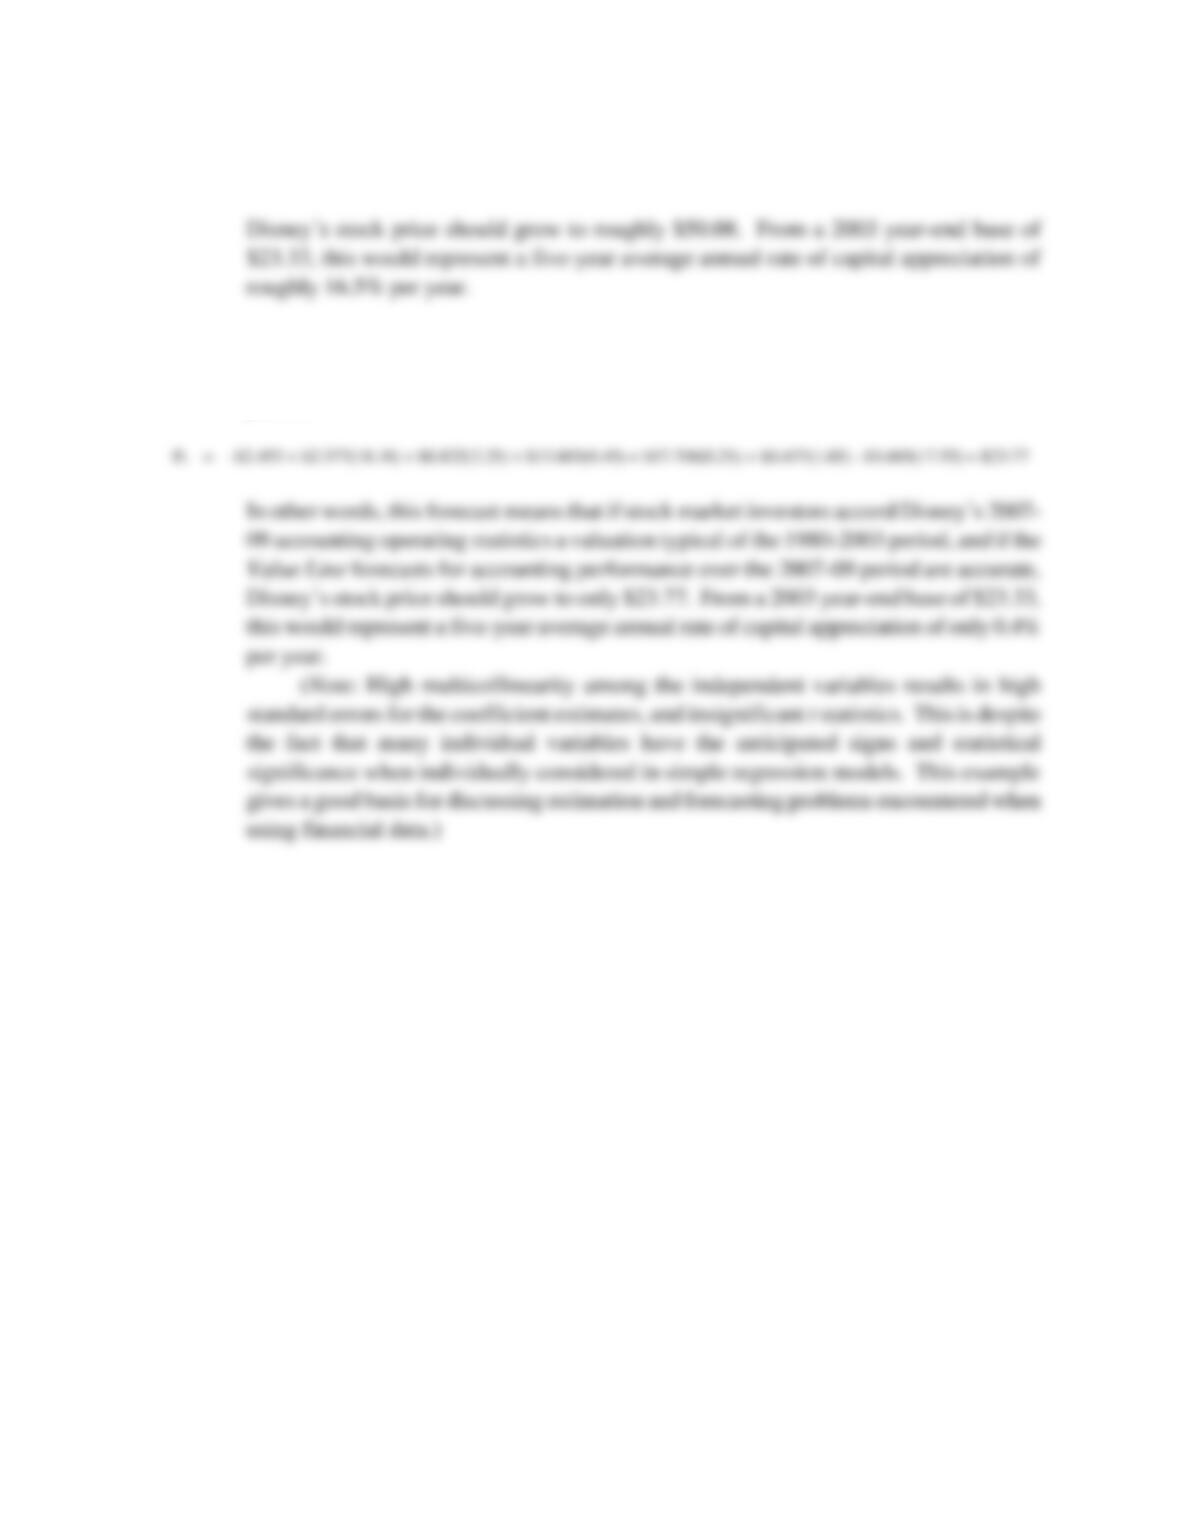
D. Using an extended multiple regression model, along with Value Line estimates for 2007-
09, gives a forecast of only $23.77 for Disney’s average stock price over the 2007-09
period: