Chapter 6
The Sources of Growth and the Solow Model
◼ Chapter Outline, Overview, and Teaching Tips
Chapter Outline
Economic Growth Around the World
The Solow Growth Model
Building Blocks of the Solow Growth Model
Application: Evidence on Convergence, 1960–2012
Saving Rate Changes in the Solow Model
Population Growth in the Solow Model
Population Growth and the Steady State
Policy and Practice: China’s One-Child Policy and Other Policies to Limit Population Growth
Productivity Growth in the Solow Model
Technology Growth and the Steady State
Summing Up the Solow Model
Solow Model: The Results
Application: U.S. Growth Rates in the Postwar Period
Cross-Country Differences in Growth Accounting Rates
Chapter 6 Appendix: The Algebra of the Solow Growth Model
Chapter 6 Web Appendix: The Golden Rule Level of the Capitol-Labor Ratio
Chapter Overview and Teaching Tips
Part Three of the book introduces students to the fascinating study of economic growth. I like to start teaching
58 Mishkin • Macroeconomics: Policy and Practice, Second Edition
© 2015 Pearson Education, Inc.
how important it is to understand what drives economic growth. Putting Lucas’s quote, “The consequences
for human welfare involved in questions like these [about economic growth] are simply staggering” on the
blackboard is a good way to motivate the material.
The Solow growth model developed in the chapter is very standard in most macroeconomic textbooks.
One innovation here is the bathtub model of the steady state, which provides a lot of intuition about how
the Solow growth model works. One key implication of the Solow model is convergence of economic
growth, and the application on the evidence on convergence illustrates when the Solow model helps
explain convergence and when it does not. A particularly graphic example of when the Solow model helps
explain convergence is in the box, “War, Destruction, and Growth Miracles,” which shows that economic
devastation often does not have long-run effects on per capita income because of convergence.
The chapter ends with growth accounting and develops the growth accounting Equation 11, which is
derived from the aggregate production function in Chapter 3. Although accounting is usually a dry topic,
this is not the case for growth accounting. Talking about the sources of economic growth is inherently
fascinating, and growth accounting helps lay out the key issues that we have to think about to understand
economic growth. Applications, such as the one in the chapter on U.S. growth rates since World War II,
drive home that the growth accounting equation is a useful tool for understanding variations in economic
growth. This can be driven home even further by discussing international comparisons along the lines in
the chapter. The most important conclusion to get across to students from growth accounting is that
productivity growth is a more important source of variations in economic growth across countries than is
factor accumulation, and this naturally leads to the study of the role of technology and institutions in
economic growth in Chapter 7.
Chapter 6 The Sources of Growth and the Solow Model 59
◼ Answers to End of Chapter Review Questions and Problems
Answers to Review Questions
The Solow Growth Model
1. According to the per-worker production function, derived from the aggregate production function,
2. The per-worker production function slopes upward because an increase in capital per worker increases
output per worker. However, as capital per worker rises, the additional output per worker that can be
3. The amount of investment per worker is based on the equality of saving and investment in the long
run. The Solow model assumes workers save a given proportion s of their output per worker yt so syt
4. Given the per-worker production function and fixed productivity and population, the steady-state
level of capital per worker depends on the proportion of income per worker that is saved and the
depreciation rate. The steady state is achieved when the level of capital per worker does not change.
Saving Rate Changes in the Solow Model
5. If the saving rate increases, a larger portion of the present output per worker will be invested in new
capital. Capital accumulation and capital per worker will rise, and capital per worker will continue
growing until a new steady state is reached. As capital per worker rises, output per worker and
Population Growth in the Solow Model
6. Population growth results in capital dilution, as a given amount of capital must be used by a larger
number of workers. The decline in capital per worker reduces output per worker. (This occurs despite
60 Mishkin • Macroeconomics: Policy and Practice, Second Edition
7. The exogenous variables include total factor productivity, the saving rate, the depreciation rate, and
Productivity Growth in the Solow Model
8. An increase in total factor productivity works in two ways to increase output per worker. First, output
per worker rises because the available capital and labor inputs are more productive and total output
Summing Up the Solow Model
9. The Solow model provides these insights into economic growth: (1) if different economies have the
same aggregate production function they will converge to similar levels of output per worker and per
capita income; (2) a higher saving rate increases the levels of capital and output per worker but does
Sources of Economic Growth: Growth Accounting
10. According to the growth accounting equation, which is derived from the aggregate production
function, the three sources of economic growth are productivity growth, capital growth, and labor
Answers to Problems
The Solow Growth Model
1. a. The steady-state condition is given by
0.5 0.5
2 0.2 2 0.04 .
t t t t
s k k k k
= → =
Solving for kt yields:
Chapter 6 The Sources of Growth and the Solow Model 61
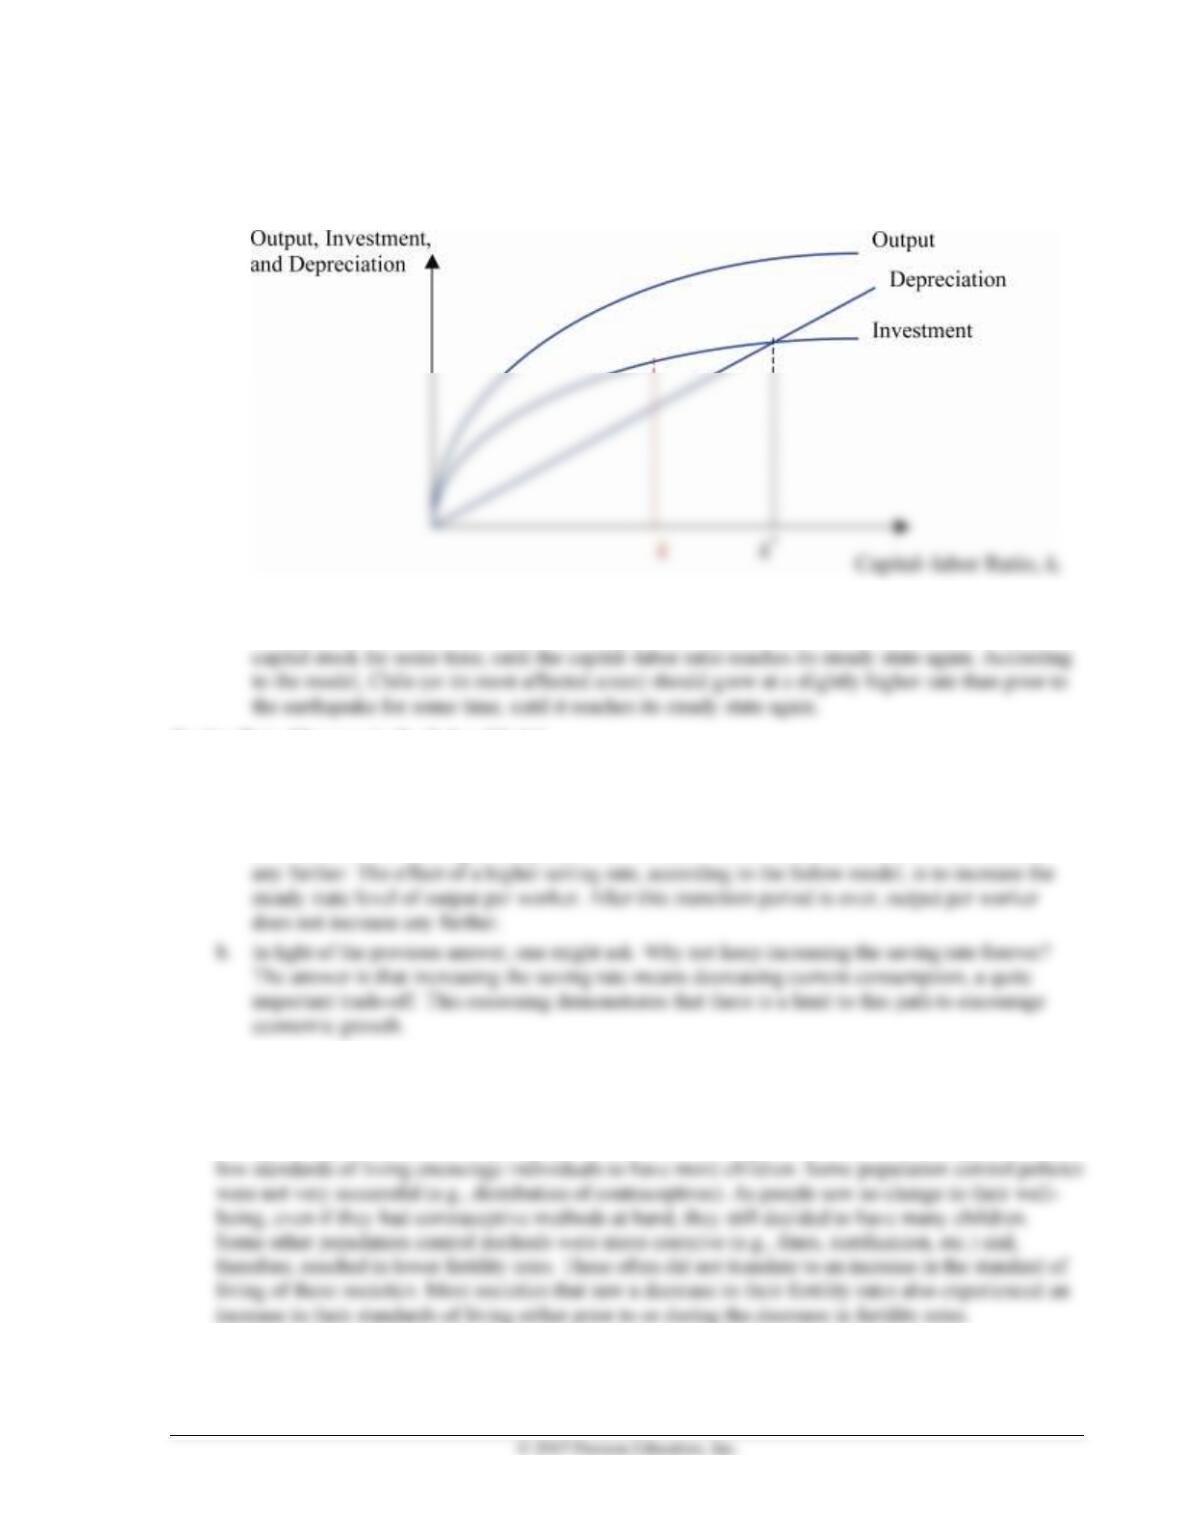
2. a. Then new capital–labor ratio will be lower than the original one because this earthquake
decreased Chile’s capital stock (including ports, roads, schools, etc.). The new capital–labor ratio
is noted in the graph in red.
b. In the aftermath of the earthquake, Chile’s capital–labor ratio will be at a lower level than at its
steady state. At this point, investment is higher than depreciation, and Chile will be adding to its
Saving Rate Changes in the Solow Model
3. a. According to the Solow model, an increase in the saving rate will increase the capital–labor ratio
in the United States. There will be a transition during which the U.S. economy will move toward
a new steady state. At the new steady state, U.S. residents will enjoy a higher capital–labor ratio
level and, therefore, a higher output-per-worker ratio. These ratios, however, will not increase
Population Growth in the Solow Model
4. If low standards of living are the reason individuals decide to have many children, then encouraging
couples to have fewer children will not have a significant effect on economic growth. Although the
concept of capital dilution is very important, there are many arguments in favor of the hypothesis that
5. There are many consequences that arise from a coercive population control method as the one
implemented by China. First, the drop in fertility rates has been so big that the Chinese labor force
62 Mishkin • Macroeconomics: Policy and Practice, Second Edition
6. a. According to the Solow model, immigration will result in an increase in the aggregate output
level. An increase in the labor input increases the economy’s ability to produce goods and
services. This can be seen by increasing “L” in the original production function and holding the
Productivity Growth in the Solow Model
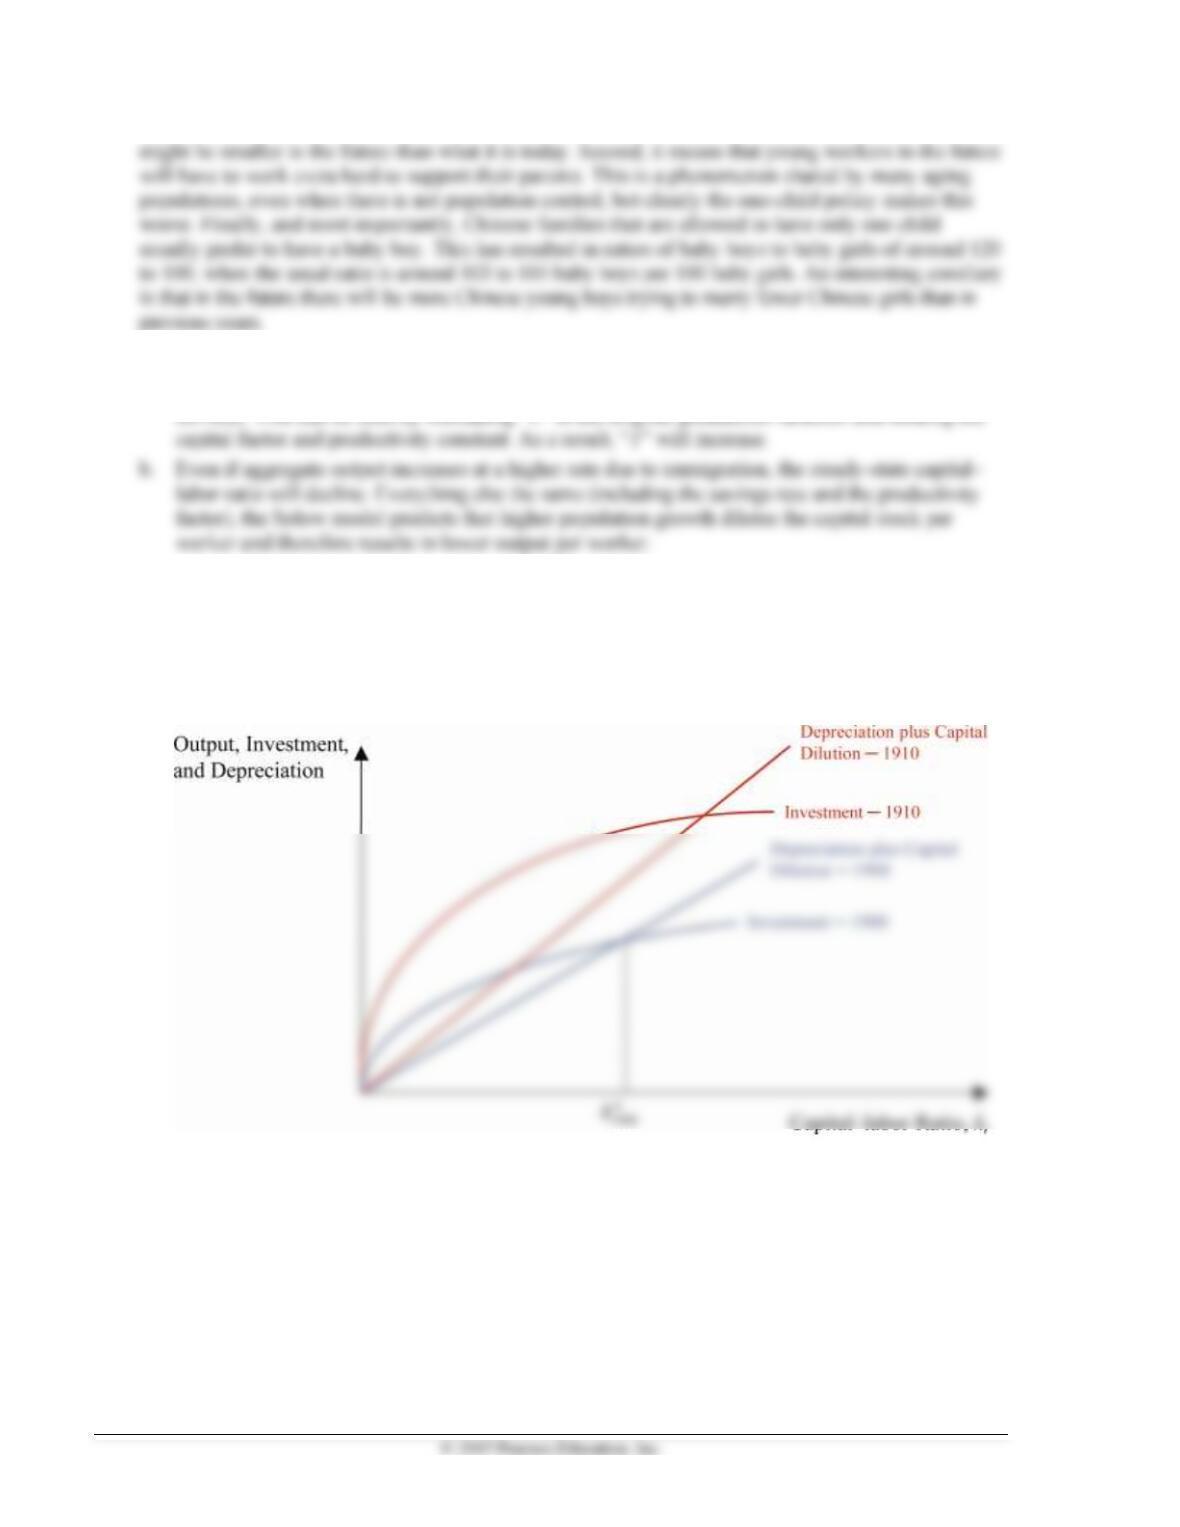
7. a. Investment increases as productivity increases during the period. This results in an upward shift
of the investment curve (holding the saving rate constant). At the same time, the immigration
wave means higher population growth during that period, making the depreciation and capital
dilution curve rotate counterclockwise.
Chapter 6 The Sources of Growth and the Solow Model 63
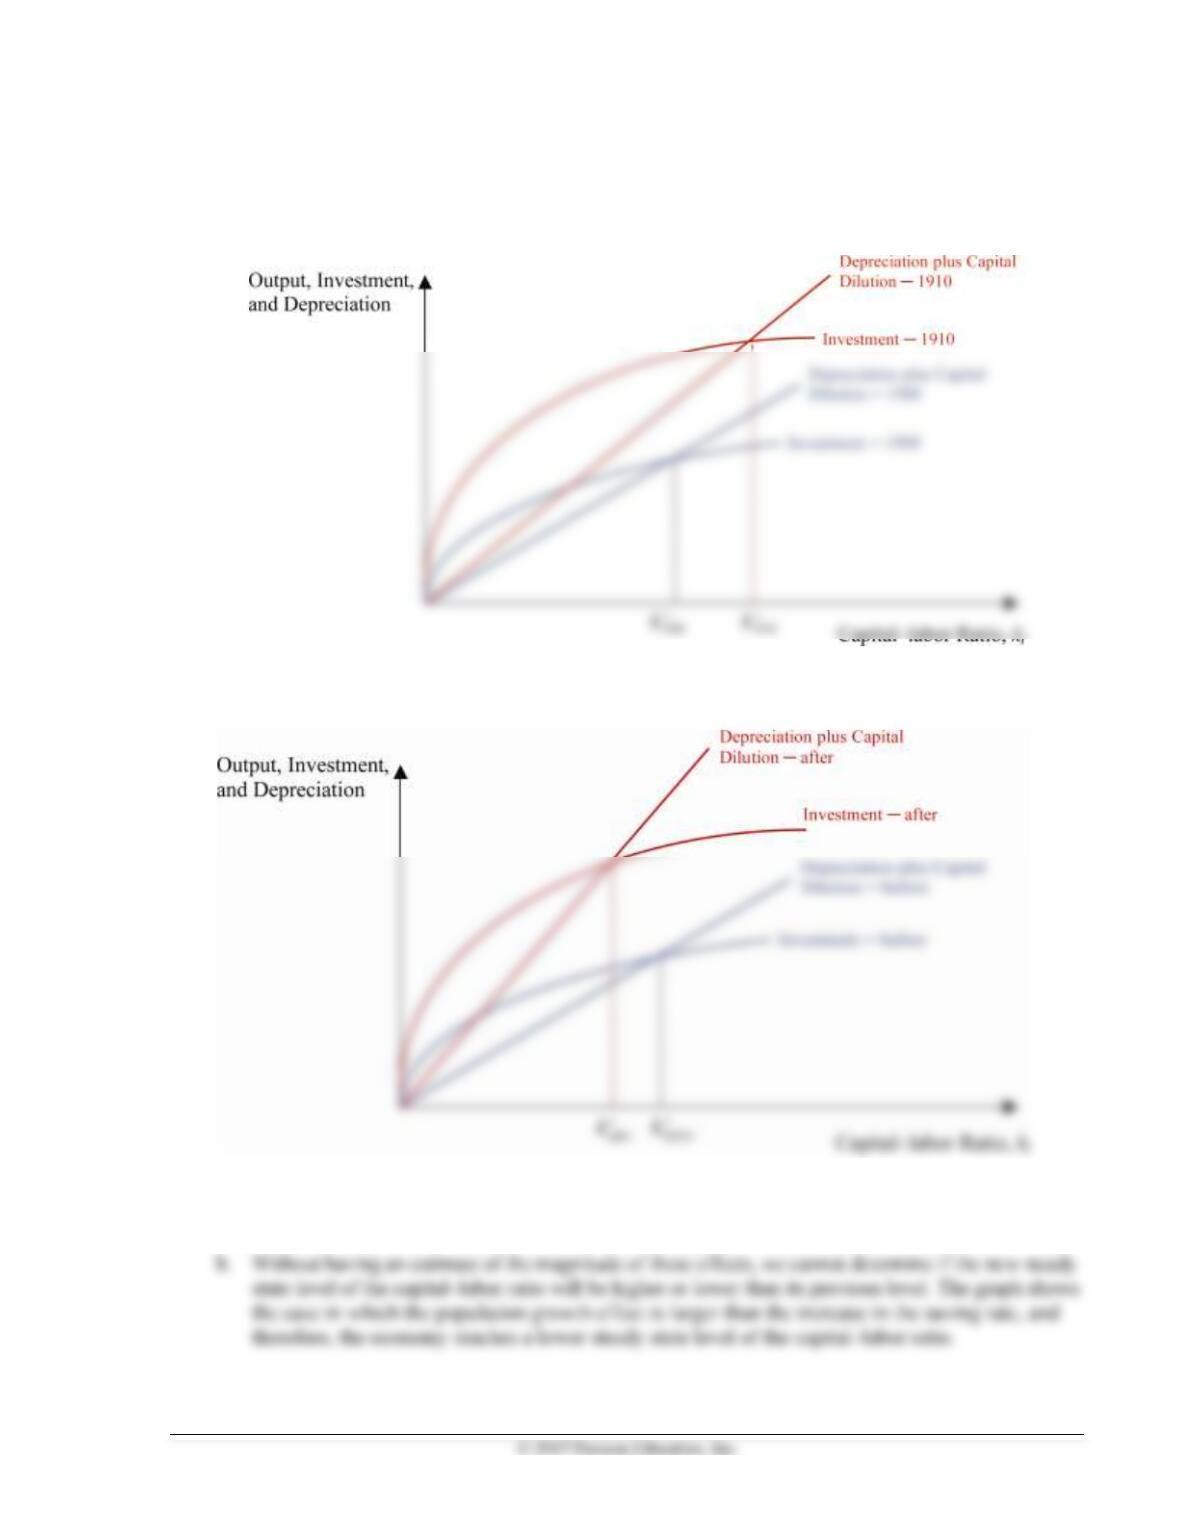
b. The result of these two opposing effects on the steady state capital–labor ratio depends on their
relative magnitudes. If capital per worker was higher in 1910 than it was in 1900, then it is
plausible to assume that the increased in productivity offset the increase in population growth, as
shown in the graph.
Summing Up the Solow Model
8.
a. Immigrants’ higher saving rate means that the new saving rate of the whole country will be higher,
shifting the investment curve upward. Also, a higher fertility rate means higher population growth,
represented by a counterclockwise rotation in the depreciation and capital dilution curve.
64 Mishkin • Macroeconomics: Policy and Practice, Second Edition
Sources of Economic Growth: Growth Accounting
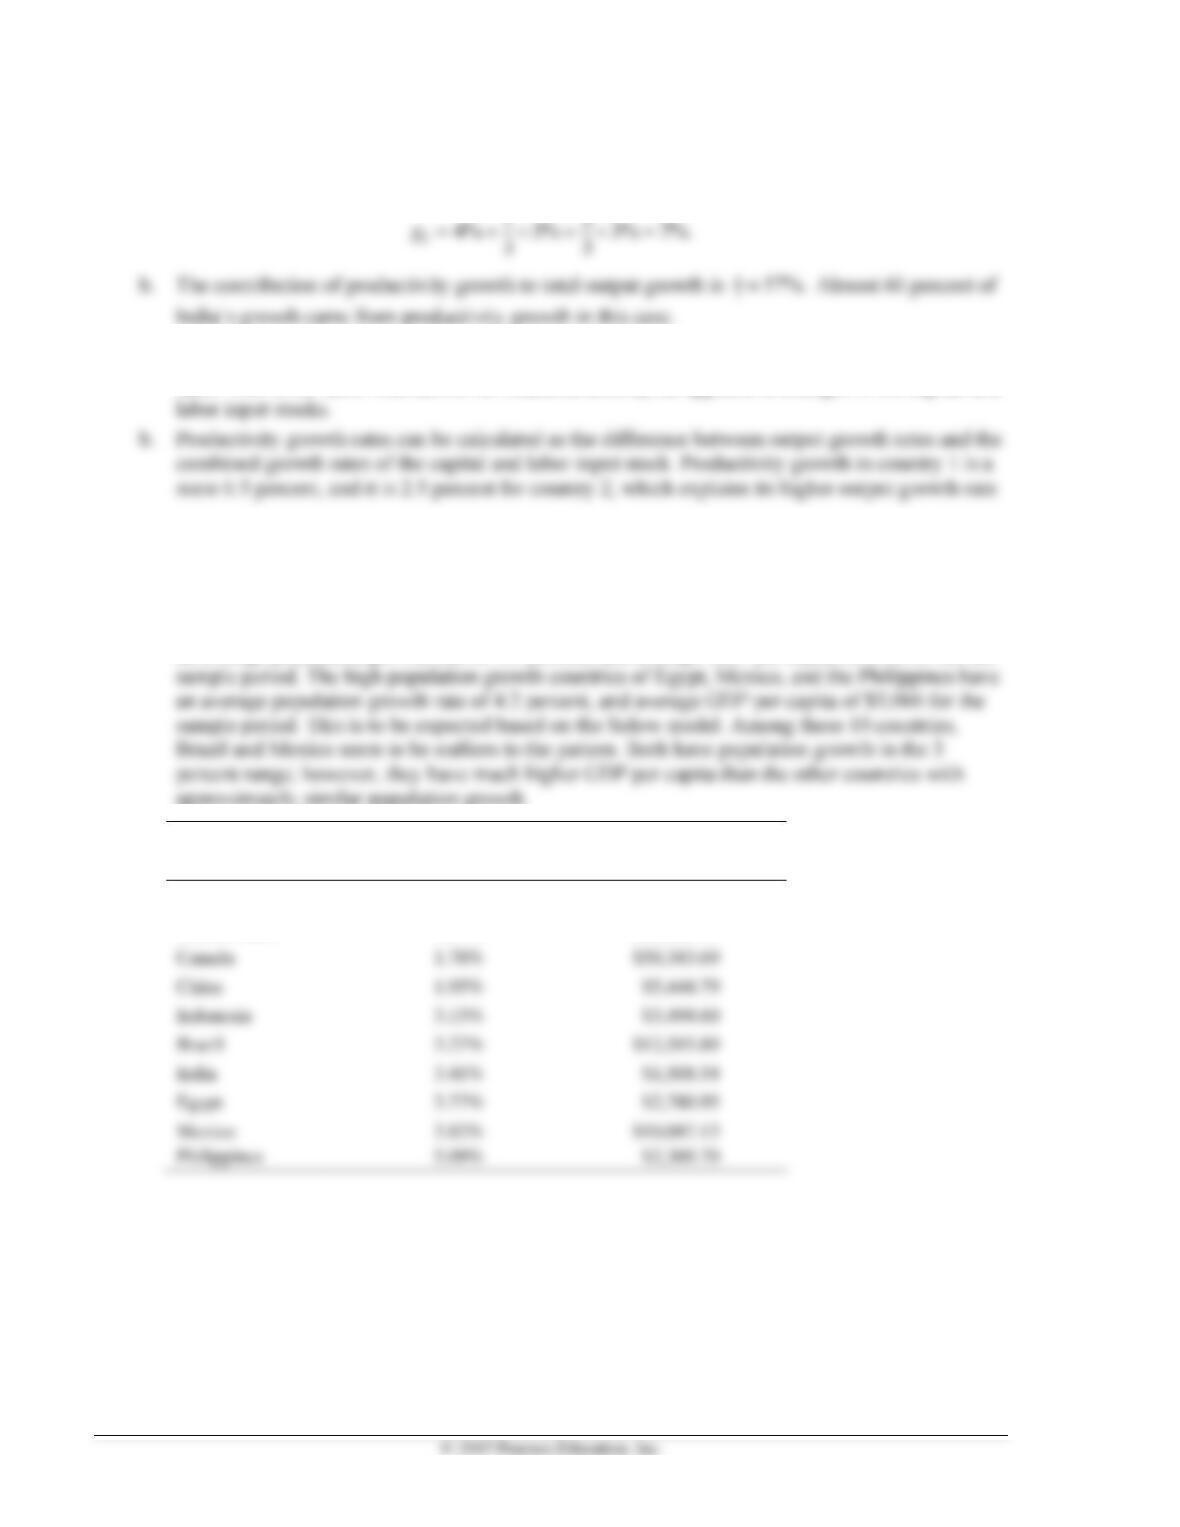
9. a. India’s output growth can be calculated as:
10. a. The difference in output growth rates can be explained by differences in productivity growth
rates. This is the factor that cannot be measured directly, as opposed to changes in the capital and
◼ Answers to Data Analysis Problems
1. a. See table below.
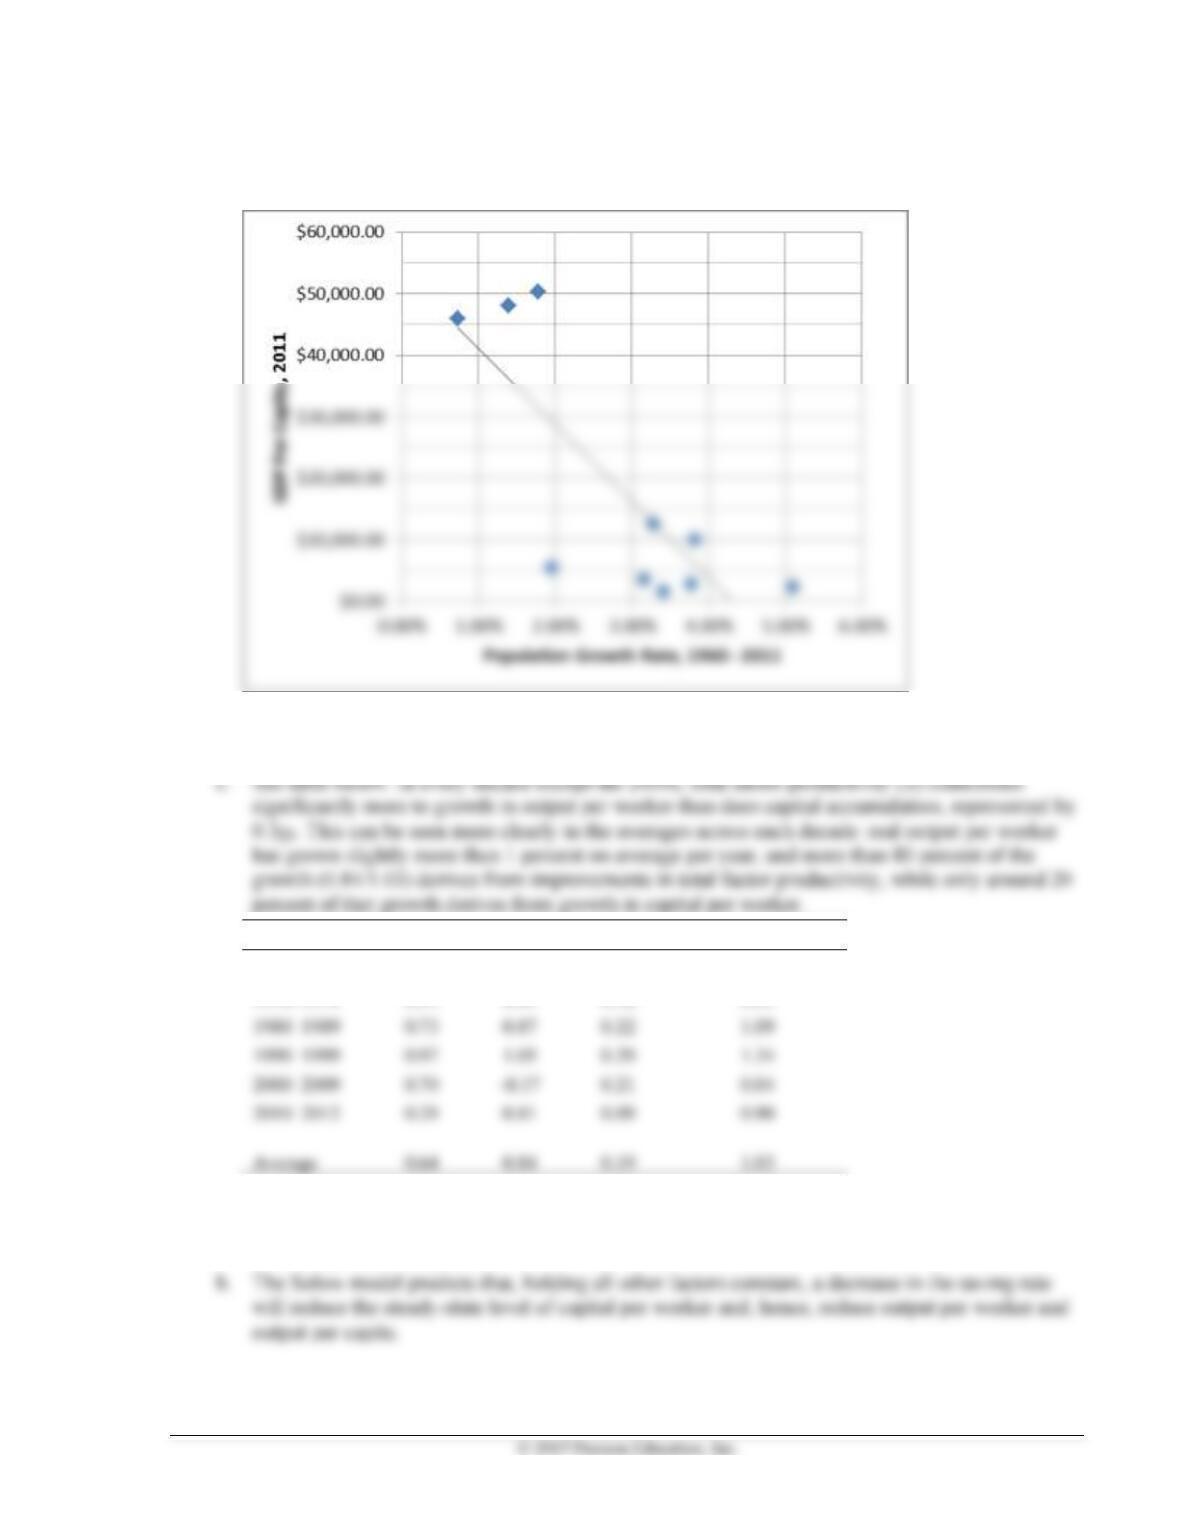
b. See table below. The low population growth countries of Japan, United States, and Canada have
an average population growth rate of 1.3 percent, and average GDP per capita of $48,119 for the
approximately similar population growth.
Country
Average Population
Growth Rate (1960–2011)
GDP Per Capita (2011)
Japan
0.73%
$45,902.67
United States
1.39%
$48,111.97
Canada
1.78%
$50,343.69
China
1.95%
Indonesia
3.15%
Brazil
3.27%
$12,593.89
India
3.41%
Egypt
3.77%
Mexico
3.82%
$10,047.13
Chapter 6 The Sources of Growth and the Solow Model 65
c. See scatterplot below. Clearly, among these countries there is a strong relationship between high
population growth leading to low GDP per capita as predicted by the Solow model.
2. a. Calculations not shown here.
b. See table below.
Decade
gk
gA
0.3gk
gy = 0.3gk + gA
1960–1969
0.77
2.07
0.23
2.30
1970–1979
0.39
0.41
0.12
0.53
1980–1989
0.73
0.87
0.22
1.09
1990–1999
0.97
1.05
0.29
1.34
2000–2009
0.70
0.21
0.04
2010–2012
0.29
0.81
0.09
0.90
0.64
0.84
0.19
1.03
3. a. From 1960 to 1980, the average net saving rate is 9.6 percent, and for 1980 to 2011, the average
net saving rate is 4.0 percent.
66 Mishkin • Macroeconomics: Policy and Practice, Second Edition
c. The net saving rate went down from 9.6 percent to 4.0 percent, while real GDP per capita
◼ Answers to Review Questions and Problems in Appendix, “The
Algebra of the Solow Growth Model”
1. According to the per worker production function, the steady-state value of the capital–labor ratio is
given by:
2. According to the per-worker production function, the steady-state value of the capital–labor ratio is
now:
The steady-state value of per-worker output is:
* * 0.3
2( ) 6.26.yk= =
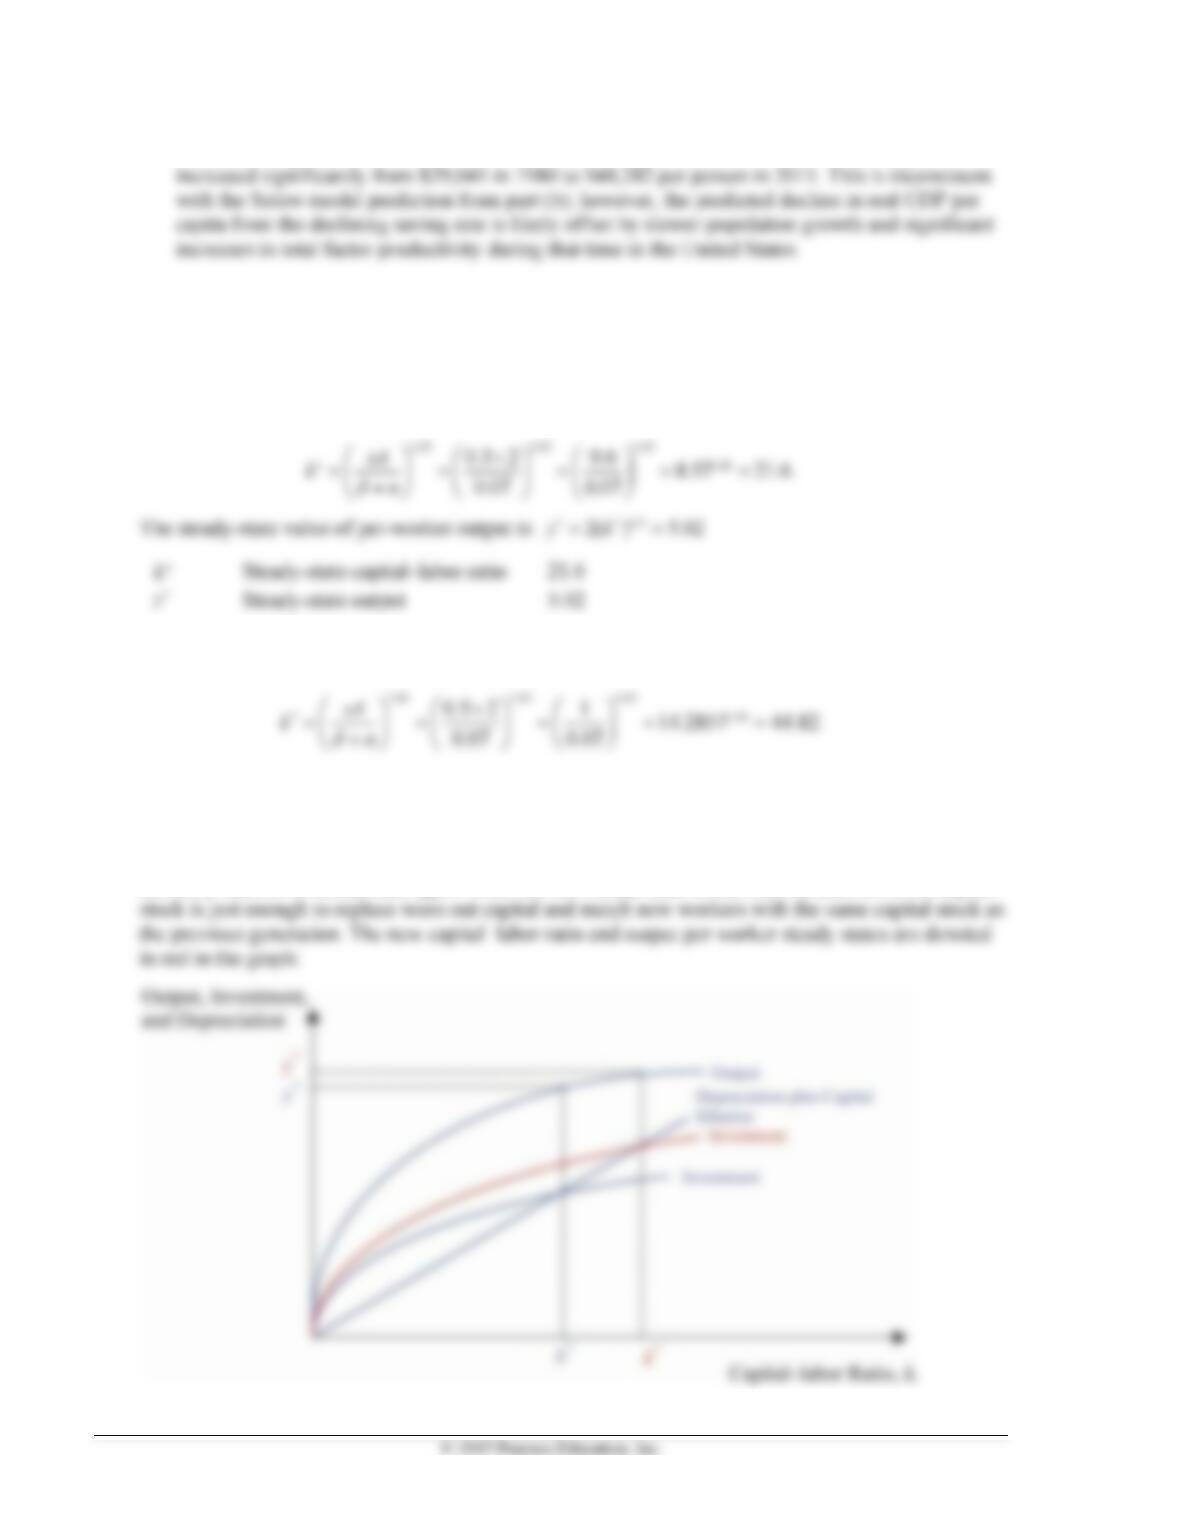
The higher saving rate shifts the
investment curve up, intersecting the depreciation plus capital dilution curve at a new (higher) steady
state value of the capital–labor ratio. Intuitively, the increase in savings allows this economy to reach
a higher capital-per-worker steady state by adding more capital to the existing capital stock until the
economy reaches its steady state again. Once the new steady state is reached, the addition to the capital
Chapter 6 The Sources of Growth and the Solow Model 67
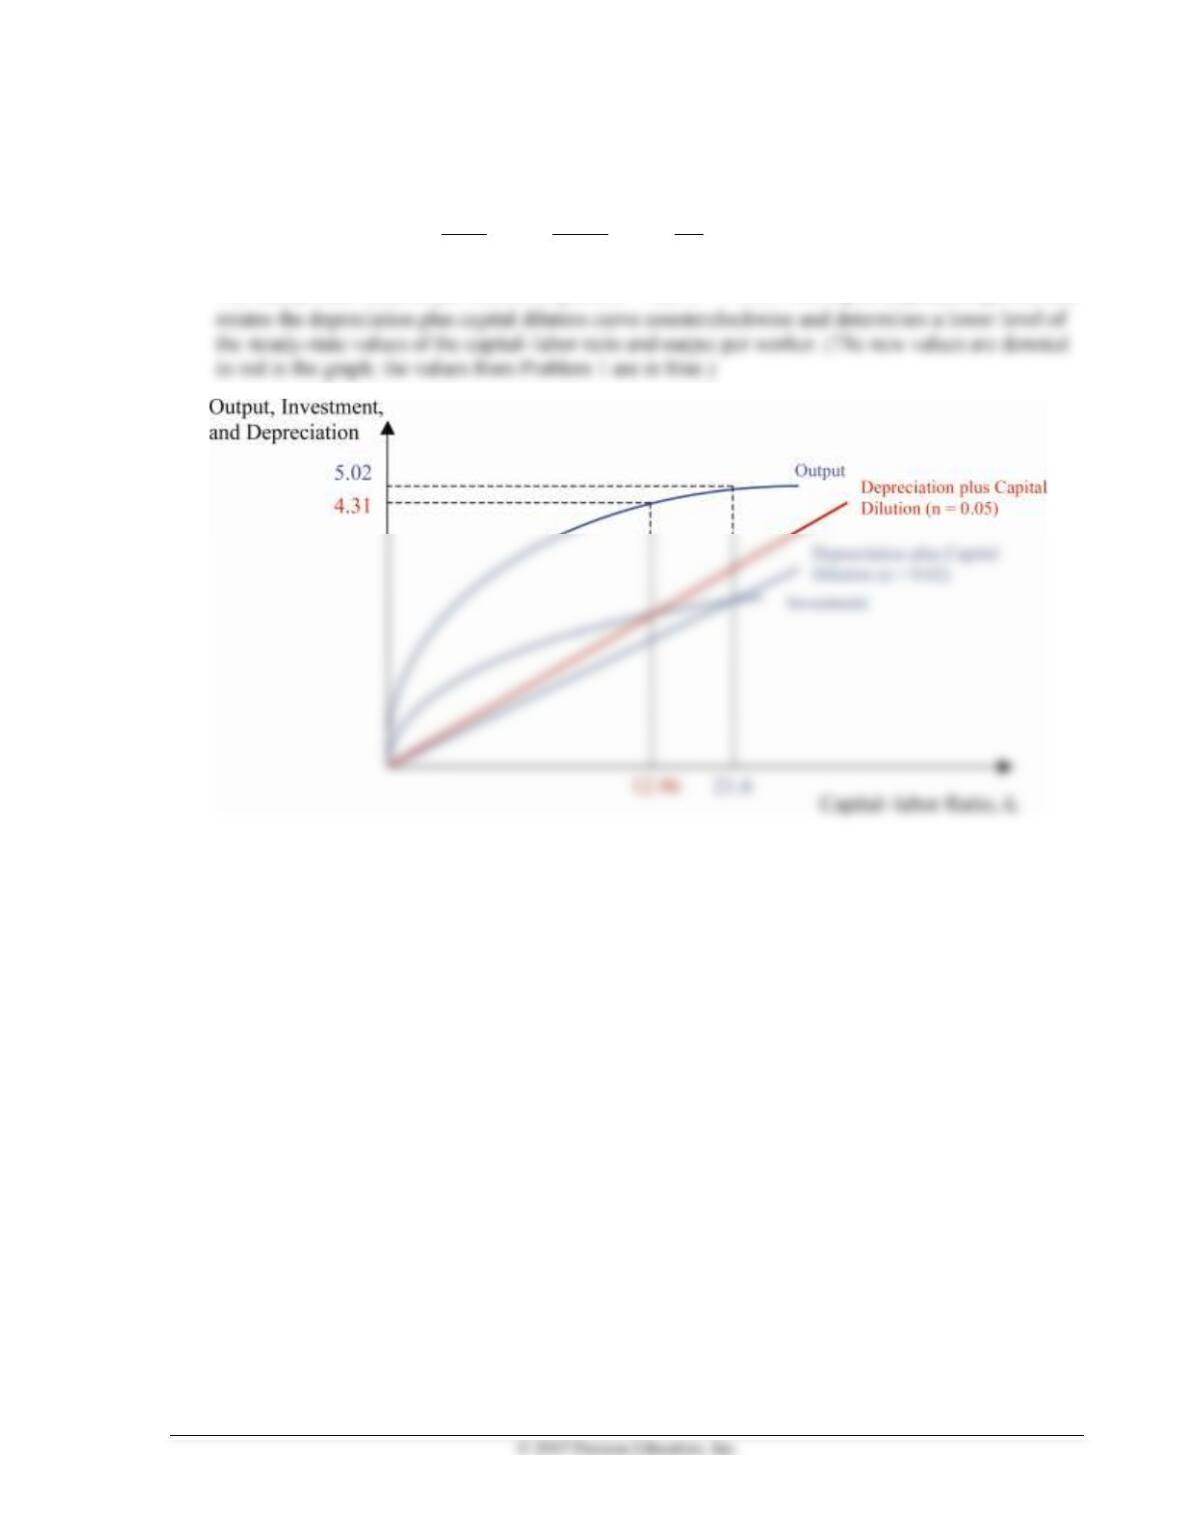
3. According to the per-worker production function, the steady-state value of the capital–labor ratio is
given by:
1.43 1.43 1.43
* 1.43
0.3 2 0.6 6 12.96.
0.1 0.1
sA
kn
= = = = =
+
The steady-state value of per-worker output is:
* 0.3
2( ) 4.31.yk
==
The higher population growth rate
68 Mishkin • Macroeconomics: Policy and Practice, Second Edition
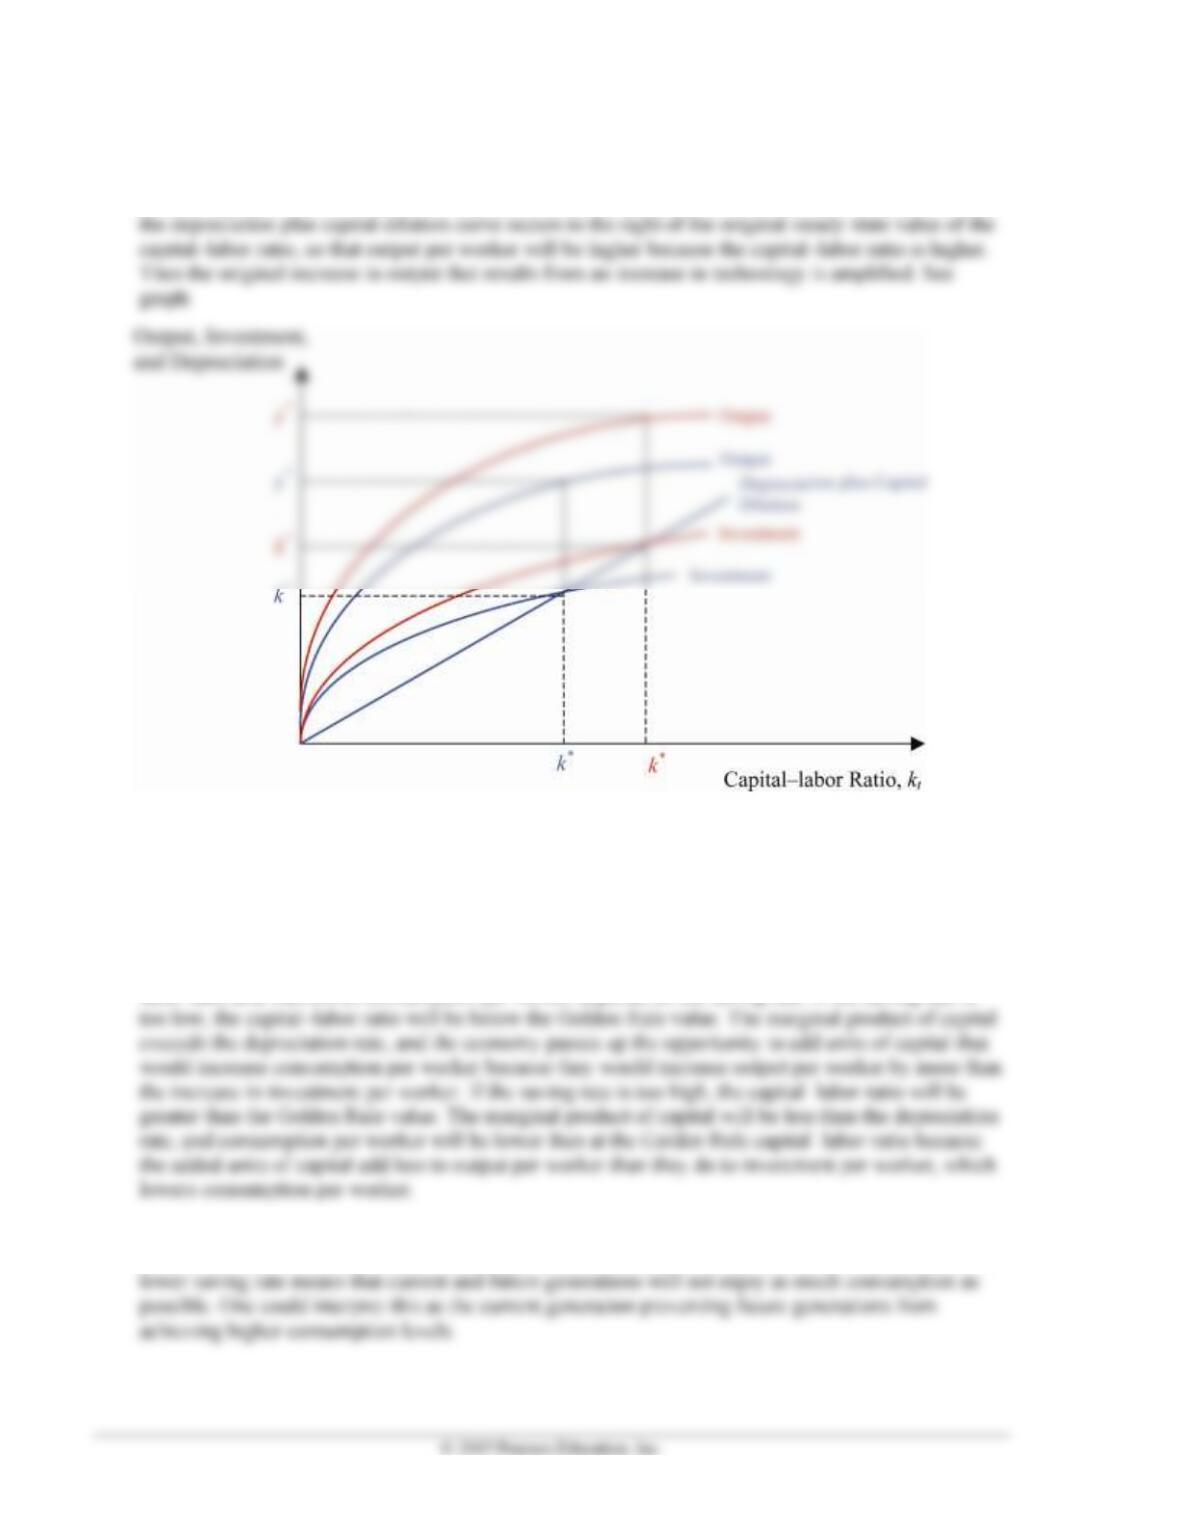
4. An increase in productivity (the technology factor) results in a rotation upward of both the output and
investment curves. At the original capital–labor ratio, output per worker rises as the output curve
rises. Output per worker will also rise because the intersection point of the new investment curve and
◼ Answers to Review Questions and Problems in Web Appendix,
“The Golden Rule Level of the Capital–Labor Ratio”
1. The Golden Rule capital–labor ratio is special because it is the value of the capital–labor ratio that
maximizes consumption per worker; at the Golden Rule capital–labor ratio the marginal product of
capital equals the depreciation rate. Whether or not the economy achieves the Golden Rule capital–
labor ratio and maximizes consumption per worker depends on the saving rate. If the saving rate is
2. A saving rate that is lower than the Golden Rule saving rate results in a capital–labor ratio that is
smaller than the Golden Rule ratio. This implies that consumption is not maximized. The choice of a
Chapter 6 The Sources of Growth and the Solow Model 69
3. An increase in the population growth rate will result in a decrease in the Golden Rule level of the
capital–labor ratio (refer to Equation 5 and remember that the marginal product of capital increases as
4. A decrease in the depreciation rate means that fewer units of capital are needed to replace the wearing
out of the current capital stock and maintain the Golden Rule capital–labor ratio. Using Equation 5,
5. The Golden Rule capital–labor ratio is determined at $6,000 per worker, when the equilibrium condition
in Equation 5 is met: marginal product of capital = depreciation rate + population growth rate.
6. An increase in the technological factor increases the marginal productivity of capital, thereby resulting
◼ Data Sources, Related Articles, and Discussion Questions
A. For Information About Application: Evidence on Convergence, 1960–2012
Data Source
Related Article
Grier, Kevin, “Empirics of Economic Growth”:
Discussion Question
What are some potential reasons different countries might be represented by different production functions
(so that according to the Solow model they would not converge to the same steady state)?
Answer: Even if some countries have similar per capita stocks or human capital (i.e., education), they
70 Mishkin • Macroeconomics: Policy and Practice, Second Edition
B. For Information About Policy and Practice: China’s One-Child Policy and
Other Policies to Limit Population Growth
Data Source
Related Article
Nie, Weiliang, “China’s One–Child Policy: Success or Failure?” http://www.bbc.co.uk/news/world-asia-
pacific-11404623. This article evaluates the consequences of the one-child policy in China.
Discussion Questions
Do you agree with the one-child policy? Why or why not?
Answer: The principle of the one-child policy is highly controversial. Not only does it impose a restriction
C. For Information About Application: U.S. Growth Rates in the Postwar
Period
Data Source
Bureau of Economic Analysis, NIPA Tables:
Related Article
Bosworth, Barry P. and Jack E. Triplett, “What’s New About the New Economy? IT, Economic Growth
Discussion Question
Suppose that during the next 10 years the growth rate of both labor and capital input remains constant in
the U.S. economy. What would happen to the U.S. GDP growth rate?
Answer: If the growth rate of both the labor and capital inputs remain constant, GDP growth will be entirely