$30,000
$35,000
$40,000
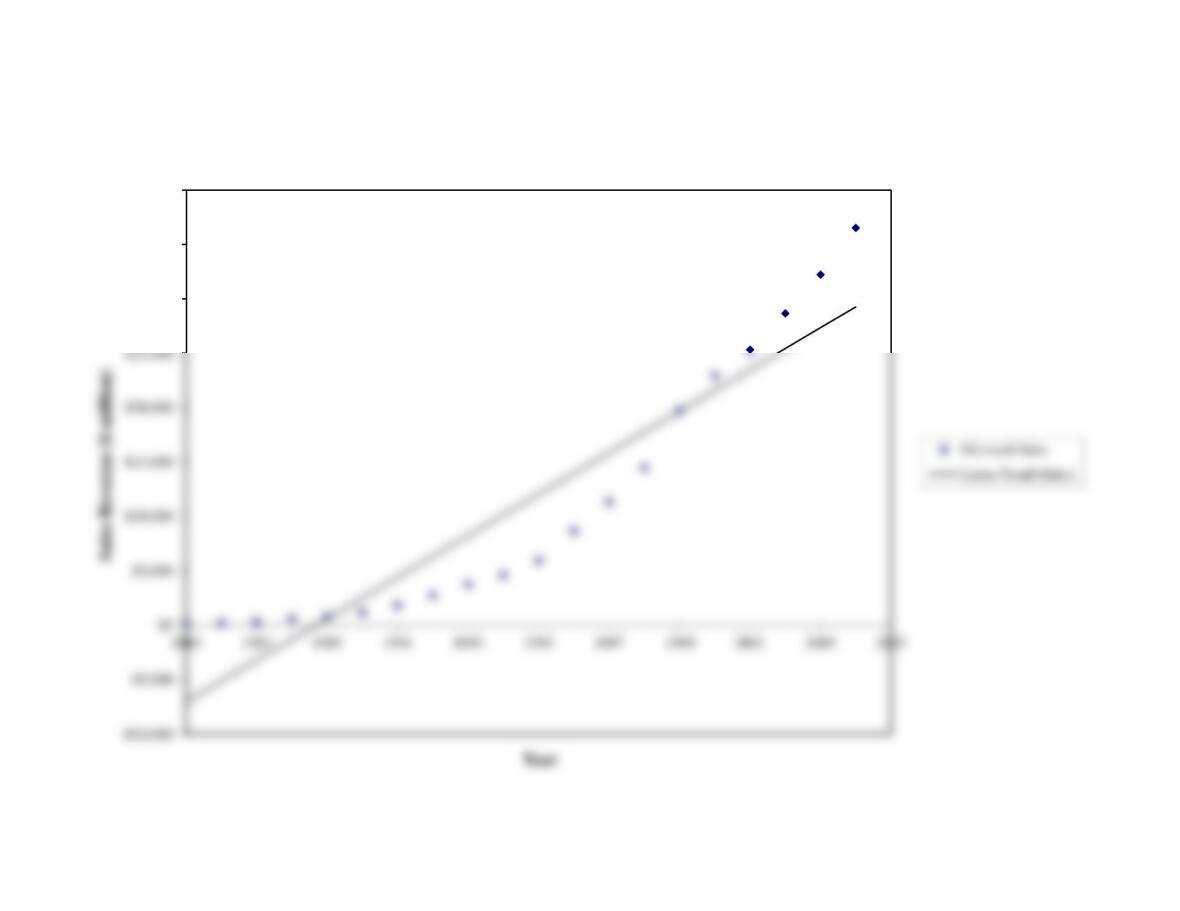
Figure 6.2 Linear Trend in Microsoft Corp. Sales 1985-2004
S
t
= -$8,937.7 + $1,908.5t
R2= 87.2%
TABLE 6.1 Sales Revenue for Microsoft Corp., 1985-2004
Sales Natural Logarithm Common Logarithm
Revenue of Sales Revenue of Sales Revenue Time Fitted Sales
Year ($ millions) (Base e) (Base 10) Period (Linear)
1985 139.5 4.938 2.145 1 -7,029.2
1986 202.1 5.309 2.306 2 -5,120.6
Data Source: Company annual reports (various years).
(Note: 2004 data are preliminary.)
a. Linear trend analysis (St)
SUMMARY OUTPUT
Regression Statistics
ANOVA
df SS MS F Significance F
Regression 1 2422300646 2422300646 122.4288294 1.8419E-09
b. Log sales (LogSt)
SUMMARY OUTPUT
Regression Statistics
Multiple R 0.982943035
R Square 0.96617701
X Variable 1 0.128500926 0.005666927 22.67559057 1.09118E-14 0.116595144 0.140406708 0.116595144 0.140406708
c. Natural Logarithm of sales (LnSt)
SUMMARY OUTPUT
Regression Statistics
Multiple R 0.982943035
ANOVA
df SS MS F Significance F
Regression 1 58.21910653 58.21910653 514.1824075 1.09118E-14
Month Visitors Percent change
January 7,481
February 9,686 29.5%
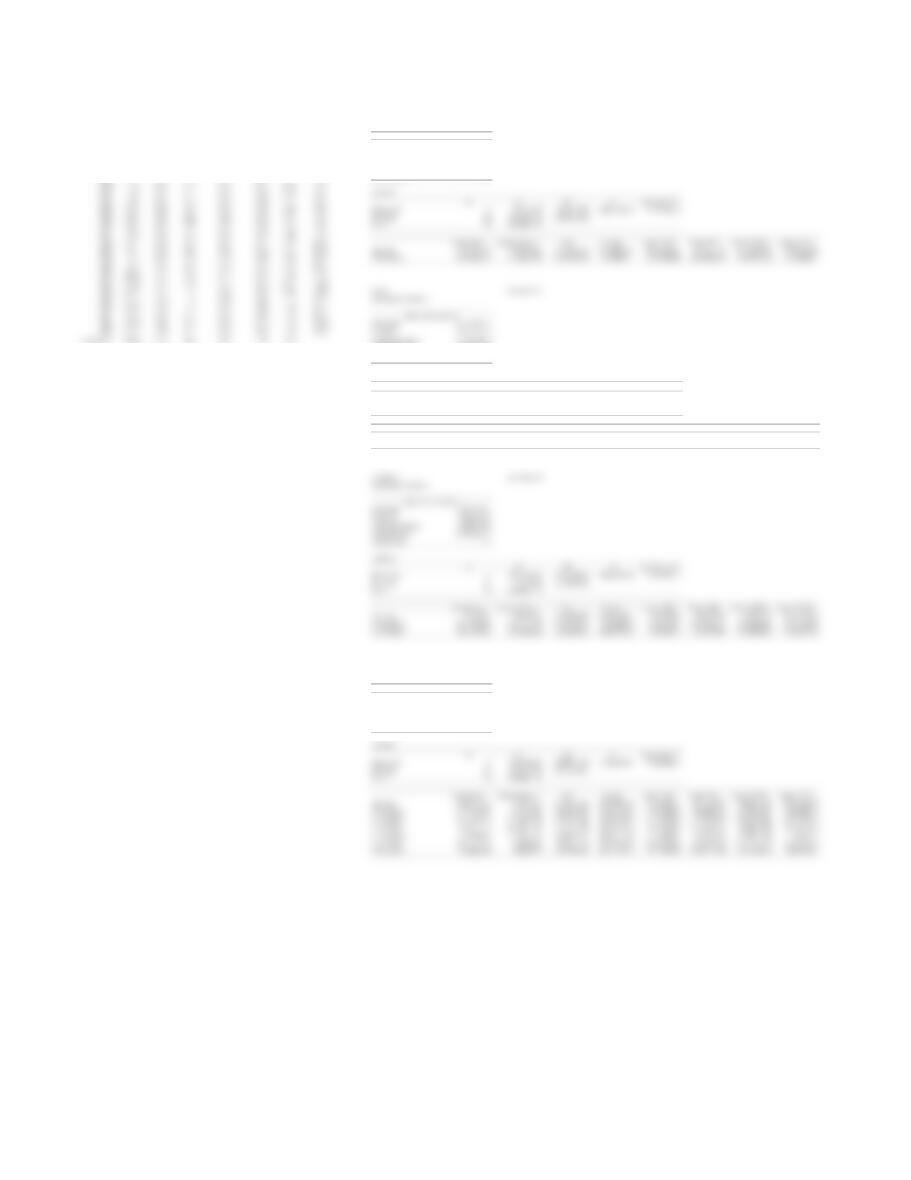
Table 6.7 Operating Statistics for The Walt Disney Company (all data in dollars per share) a. EPS 50.12828915
SUMMARY OUTPUT
Cash Capital Book Year-end
Year Revenues Flow Spending Dividends Earnings Value Stock Price Regression Statistics
1980 $0.59 $0.11 $0.10 $0.02 $0.09 $0.69 $1.07 Multiple R 0.931710916
1981 0.65 0.10 0.21 0.02 0.08 0.75 1.09 R Square 0.868085231
1982 0.64 0.09 0.38 0.03 0.06 0.80 1.32 Adjusted R Square 0.862089105
1983 0.79 0.11 0.20 0.03 0.06 0.85 1.10 Standard Error 3.944629684
1984 1.02 0.13 0.12 0.03 0.06 0.71 1.25 Observations 24
2007-2009218.10 2.25 0.45 0.21 1.65 17.55 Adjusted R Square 0.758969615
Standard Error 5.214862323
1 Split-adjusted share prices. Observations 24
2 Value Line estimates.
Data Sources: Company annual reports (various years), www.valueline.com, yahoo.com. ANOVA
df SS MS F Significance F
Regression 1 1996.740774 1996.740774 73.42365374 1.85294E-08
Residual 22 598.285359 27.19478905
Total 23 2595.026133
Coefficients Standard Error t Stat P-value Lower 95% Upper 95% Lower 95.0% Upper 95.0%
Intercept 3.16132432 1.584790674 1.994789831 0.058600383 -0.125333904 6.447982544 -0.125333904 6.447982544
X Variable 1 2.182484103 0.254702433 8.568760338 1.85294E-08 1.654263021 2.710705185 1.654263021 2.710705185
Observations 24
Total 23 2595.026133
X Variable 2 0.869403855 0.283924606 3.062094083 0.005917143 0.278950212 1.459857498 0.278950212 1.459857498
d.Multiple 23.76872757
SUMMARY OUTPUT
Regression Statistics
Multiple R 0.971295125
R Square 0.94341422
Adjusted R Square 0.923442769
Standard Error 2.939003202
Observations 24
Total 23 2595.026133
X Variable 6 -1.66502916 1.776157723 -0.937433167 0.361663912 -5.412399626 2.082341306 -5.412399626 2.082341306
1986 1.58 0.24 0.11 0.03 0.15 0.90 3.59 ANOVA
1990 3.70 0.65 0.45 0.05 0.50 2.21 8.46 Total 23 2595.026133
1991 3.96 0.58 0.59 0.06 0.40 2.48 9.54
1994 6.40 0.97 0.65 0.10 0.68 3.50 15.33 X Variable 1 31.38763074 2.608631425 12.03222136 3.77599E-11 25.97765448 36.79760701 25.97765448 36.79760701