interactive activity
Chapter 6
Macroeconomics:
The Big Picture
1. Which of the following questions are relevant for the study of macroeconomics
and which for microeconomics?
a. How will Ms. Martin’s tips change when a large manufacturing plant near the
restaurant where she works closes?
b. What will happen to spending by consumers when the economy enters a
downturn?
c. How will the price of oranges change when a late frost damages Florida’s
orange groves?
d. How will wages at a manufacturing plant change when its workforce is
unionized?
e. What will happen to U.S. exports as the dollar becomes less expensive in
terms of other currencies?
1. a. This is a microeconomic question because it addresses the effects of a single
firm’s actions (the closure of a manufacturing plant) on a single individual
(the waitress).
b. This is a macroeconomic question because it considers how overall spending
by consumers is affected by the state of the macroeconomy.
2. When one person saves more, that person’s wealth is increased, meaning that he
2. This question concerns the paradox of thrift; what is true for an individual—that
Solution
Solution
S-94 Chapter 6 MacroeconoMics: The Big PicTure
3. Before the Great Depression, the conventional wisdom among economists and
policy makers was that the economy is largely self-regulating.
a. Is this view consistent or inconsistent with Keynesian economics? Explain.
b. What effect did the Great Depression have on conventional wisdom?
4. How do economists in the United States determine when a recession begins and
when it ends? How do other countries determine whether or not a recession is
occurring?
5. The U.S. Department of Labor reports statistics on employment and earnings
that are used as key indicators by many economists to gauge the health of the
economy. Figure 6–4 plots historical data on the unemployment rate each month.
Noticeably, the numbers were high during the recessions in the early 1990s, in
2001, and in the aftermath of the Great Recession, 2008–2017.
b. Compare the current numbers with those during the early 1990s, 2001, and
during 2008–2017, as well as with the periods of relatively high economic
growth just before the recessions. Are the current numbers indicative of a
recessionary trend?
5. a. Answers will vary. In the May 2017 Employment Situation, the Bureau of
Labor Statistics states that the April 2017 unemployment rate was 4.3%.
b. During the recession of the early 1990s, the unemployment rate rose from
4.3% to 5.5%. During the recession of 2007–2009, the unemployment rate rose
of 4.3% is the lowest since unemployment surged in 2009 in the wake of the
Solution
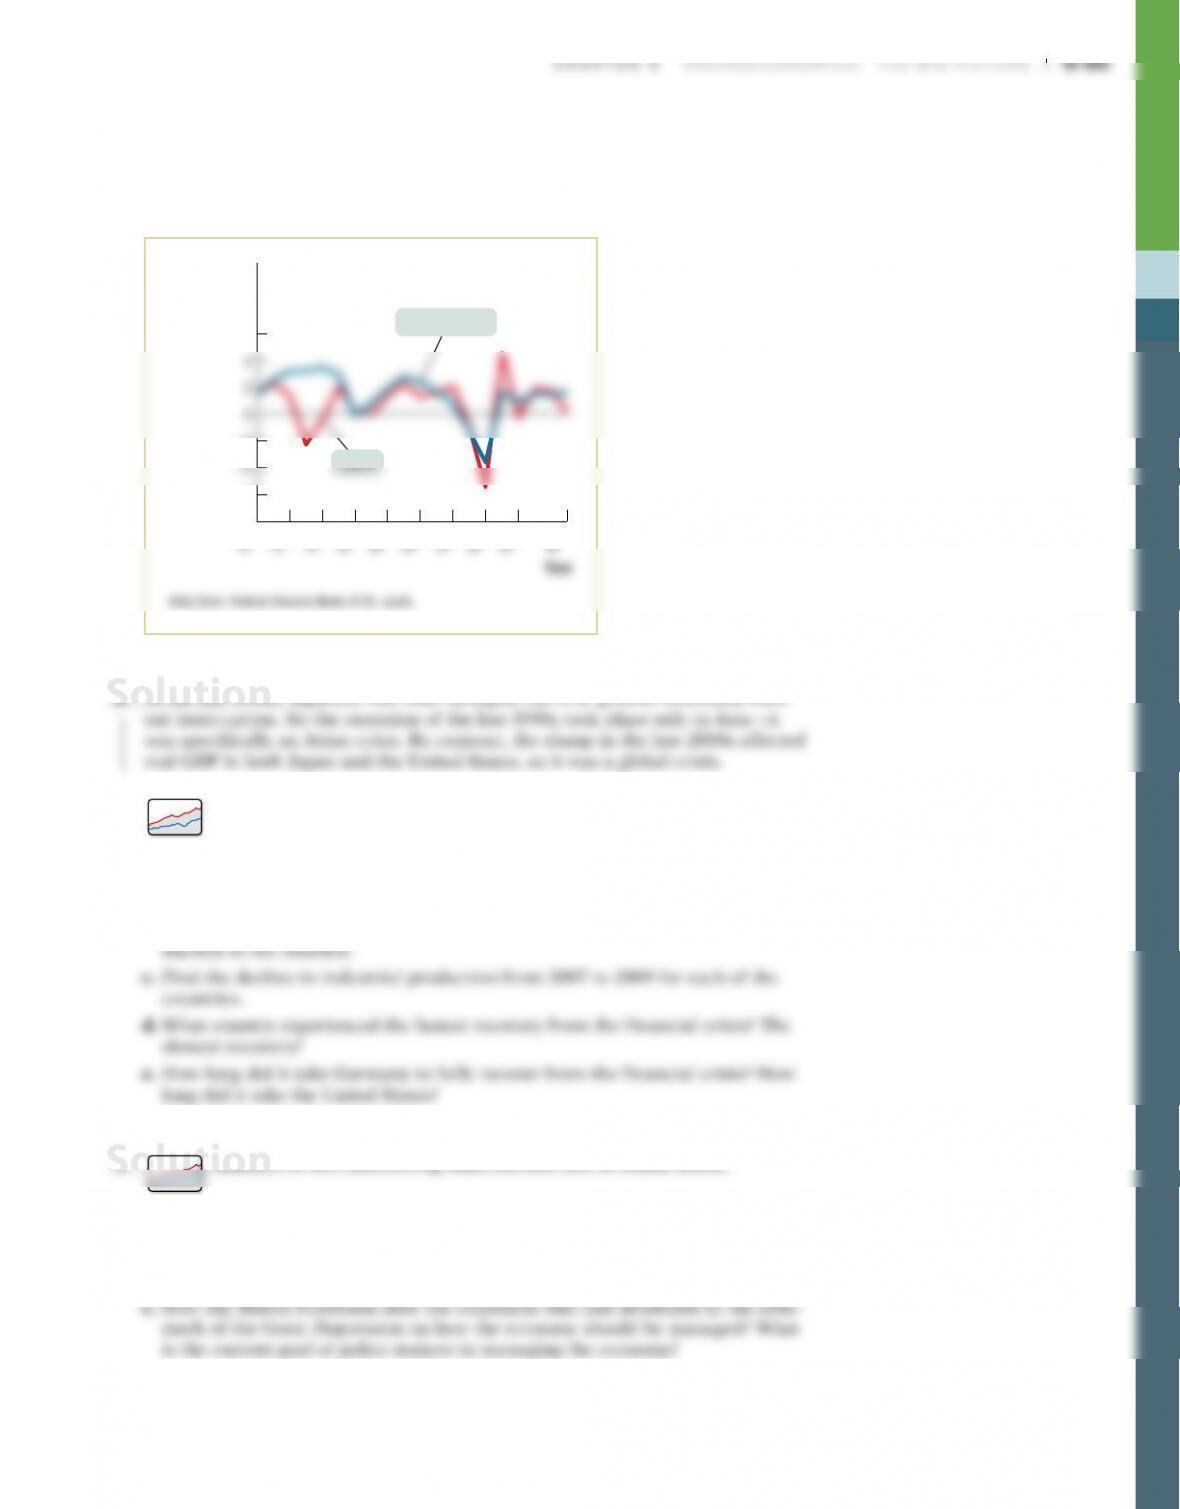
6. In the 1990s there were some dramatic economic events that came to be known
as the Asian financial crisis. A decade later similar events came to be known as
the global financial crisis. The accompanying figure shows the growth rate of
real GDP in the United States and Japan from 1995 to 2014. Using the graph,
explain why the two sets of events are referred to this way.
Growth rate
of real GDP
(percent)
6%
–2
–6
United States
Japan

S-96 Chapter 6 MacroeconoMics: The Big PicTure
9. Why do we consider a business–cycle expansion different from long-run
economic growth? Why do we care about the size of the long-run growth rate of
real GDP relative to the size of the growth rate of the population?
9. Long-run economic growth is the sustained upward trend in the economy’s
10. In 1798, Thomas Malthus’s Essay on the Principle of Population was published.
In it, he wrote: “Population, when unchecked, increases in a geometrical ratio.
Subsistence increases only in an arithmetical ratio. . . . This implies a strong and
constantly operating check on population from the difficulty of subsistence.”
Malthus was saying that the growth of the population is limited by the amount
of food available to eat; people will live at the subsistence level forever. Why
didn’t Malthus’s description apply to the world after 1800?
11. Each year, The Economist publishes data on the price of the Big Mac in different
countries and exchange rates. The accompanying table shows some data from
2007 and 2016. Use this information to answer the following questions.
a. Where was it cheapest to buy a Big Mac in U.S. dollars in 2007?
b. Where was it cheapest to buy a Big Mac in U.S. dollars in 2016?
Solution
Chapter 6 MacroeconoMics: The Big PicTure S-97
c. Using the increase in the local currency price of the Big Mac in each country
to measure the percent change in the overall price level from 2007 to 2016,
which nation experienced the most inflation? Did any of the nations experi-
ence deflation?
2007 2016
Country
Price of
Big Mac
(in local
currency)
Price of
Big Mac
(in U.S.
dollars)
Price of
Big Mac
(in local
currency)
Price of
Big Mac
(in U.S.
dollars)
Euro area €2.94 $3.82 €3.72 $4.00
11. a. In U.S. dollars, a Big Mac was cheapest in Japan in 2007.
b. In U.S. dollars, a Big Mac was cheapest in Argentina in 2016.
c. First we must calculate the percent change of the local currency price of the
Big Mac during the period from 2007 to 2016.
Percent price change in Argentina = (peso33.0 – peso8.25)/peso8.25 × 100 =
300%
Percent price change in Canada = (C$5.84 – C$3.63)/C$3.63 × 100 = 61%
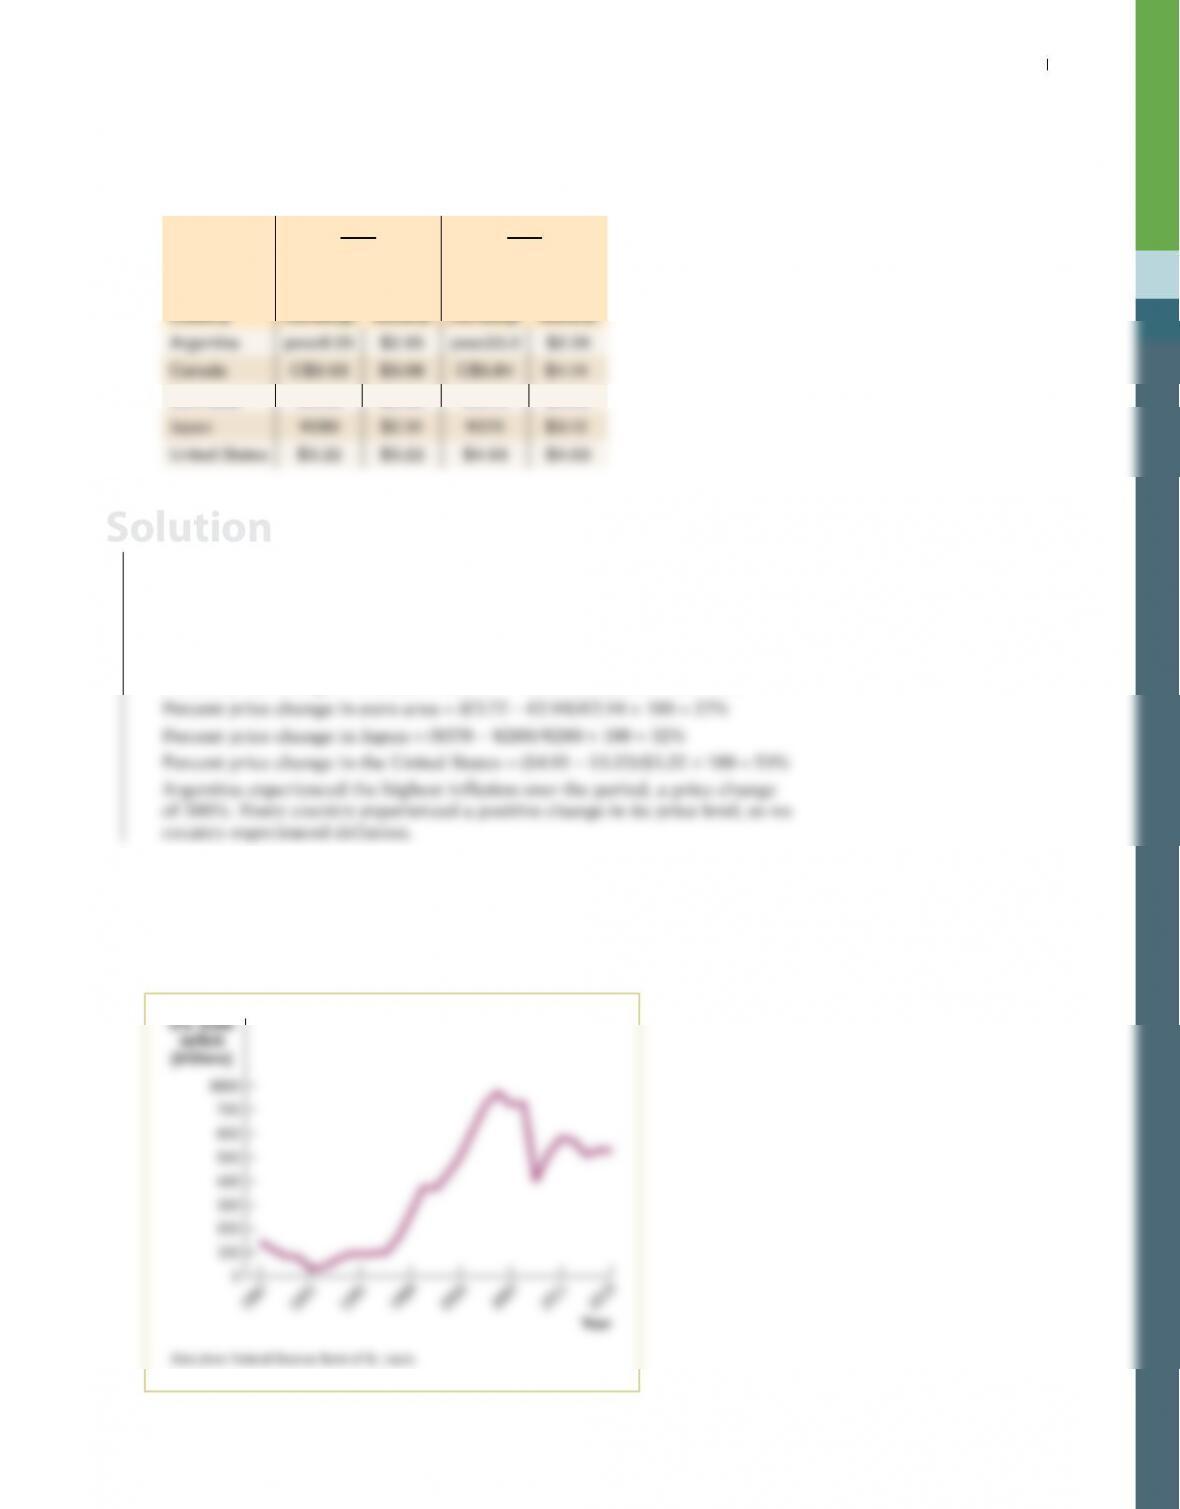
12. The accompanying figure illustrates the increasing trade deficit of the United
States since 1987. The United States has been consistently and, on the whole,
increasingly importing more goods than it has been exporting. One of the coun-
tries it runs a trade deficit with is China. Which of the following statements are
valid possible explanations of this fact? Explain.
U.S. trade
deficit
(billions)
$800
700
600
500
400
300
200
100
0
1987
1991
1995
1999
2011
2015
2003
2007
Solution
S-98 Chapter 6 MacroeconoMics: The Big PicTure
a. Many products, such as televisions, that were formerly manufactured in the
12. a. This is not a valid possible explanation. The determination of where goods
13. College tuition has risen significantly in the last few decades. For the sake of
this problem, let’s assume that over the last 20 years the cost of college, includ-
ing total tuition, room, and board paid by full-time undergraduate students
13. To determine whether it is more or less difficult for a typical person to afford
Solution
Solution