
S-87
interactive activity
Chapter 6
Elasticity
1. Do you think the price elasticity of demand for Ford sport-utility vehicles (SUVs)
will increase, decrease, or remain the same when each of the following events
occurs? Explain your answer.
2. In the United States, 2015 was a bad year for growing wheat. And as wheat sup-
ply decreased, the price of wheat rose dramatically, leading to a lower quantity
demanded (a movement along the demand curve). The accompanying table
describes what happened to prices and the quantity of wheat demanded.
2014 2015
Quantity demanded (bushels) 2.2 billion 2.0 billion
Average price (per bushel) $3.42 $4.26
a. Using the midpoint method, calculate the price elasticity of demand for winter
wheat.
b. What is the total revenue for U.S. wheat farmers in 2014 and 2015?
2. a. Using the midpoint method, the percent change in the quantity of U.S. winter
wheat demanded is
2.0 billion – 2.2 billion
$4.26 – $3.42
Solution

S-88 Chapter 6 Elasticity
Dropping the minus sign, the price elasticity of demand is therefore
$7.524 billion. Similarly, total revenue in 2015 is $4.26 × 2.0 billion = $8.52 billion.
c. The rise in price from 2014 to 2015 increased U.S. wheat farmers’ total
3. The accompanying table gives part of the supply schedule for personal comput–
ers in the United States.
Price of computer Quantity of computers supplied
$1,100 12,000
900 8,000
b. Suppose firms produce 1,000 more computers at any given price due to
improved technology. As price increases from $900 to $1,100, is the price elas–
ticity of supply now greater than, less than, or the same as it was in part a?
and the percent change in the price is
The price elasticity of supply is therefore
b. The elasticity estimate would be lower. A price change from $900 to $1,100 is
a 20% price change, just as calculated in part a. Previously, when the quantity
supplied changed from 8,000 to 12,000, that was a 40% change in the quantity
c. The elasticity estimate would be unchanged. The price increase from $900 to
$1,100 is a 20% increase, just as calculated in part a. But now that all quan-

4. The accompanying table lists the cross-price elasticities of demand for several
goods, where the percent quantity change is measured for the first good of the
pair, and the percent price change is measured for the second good.
Good
Cross-price elasticities
of demand
Air-conditioning units and kilowatts
of electricity
–0.34
vehicles (SUVs) and gasoline
McDonald’s burgers and Burger King
burgers
+0.82
Butter and margarine +1.54
a. Explain the sign of each of the cross-price elasticities. What does it imply
about the relationship between the two goods in question?
b. Compare the absolute values of the cross-price elasticities and explain their
magnitudes. For example, why is the cross-price elasticity of McDonald’s burg-
ers and Burger King burgers less than the cross-price elasticity of butter and
margarine?
4. a. A negative cross-price elasticity of demand implies that the two goods are
complements. So air-conditioning units and kilowatts of electricity are com-
plements, as are sport-utility vehicles and gasoline. A positive cross-price elas-
b. The larger (and positive) the cross-price elasticity of demand is, the more
closely the two goods are substitutes. Since the cross-price elasticity of butter
and margarine is larger than the cross-price elasticity of McDonald’s burgers
c. A cross-price elasticity of 0.63 implies that a 1% increase in the price of Pepsi
would increase the quantity of Coke demanded by 0.63%. So a 5% increase in
the price of Pepsi would increase the quantity of Coke demanded by five times
as much, that is, by 5 × 0.63% = 3.15%.
d. A cross-price elasticity of –0.28 implies that a 1% fall in the price of gasoline
would increase the quantity of SUVs demanded by 0.28%. So a 10% fall in the
Solution

5. What can you conclude about the price elasticity of demand in each of the
following statements?
5. a. This statement says that a 10% increase in price reduces the quantity
demanded by 50%. That is, the price elasticity of demand is
50%
10% = 5
So demand is elastic.
b. The fact that it was necessary for price to drop by 80% in order to sell one
more unit (an increase in quantity of 67%, using the midpoint method) indi-
cates that the demand for Jerry Garcia autographed lithographs is inelastic.
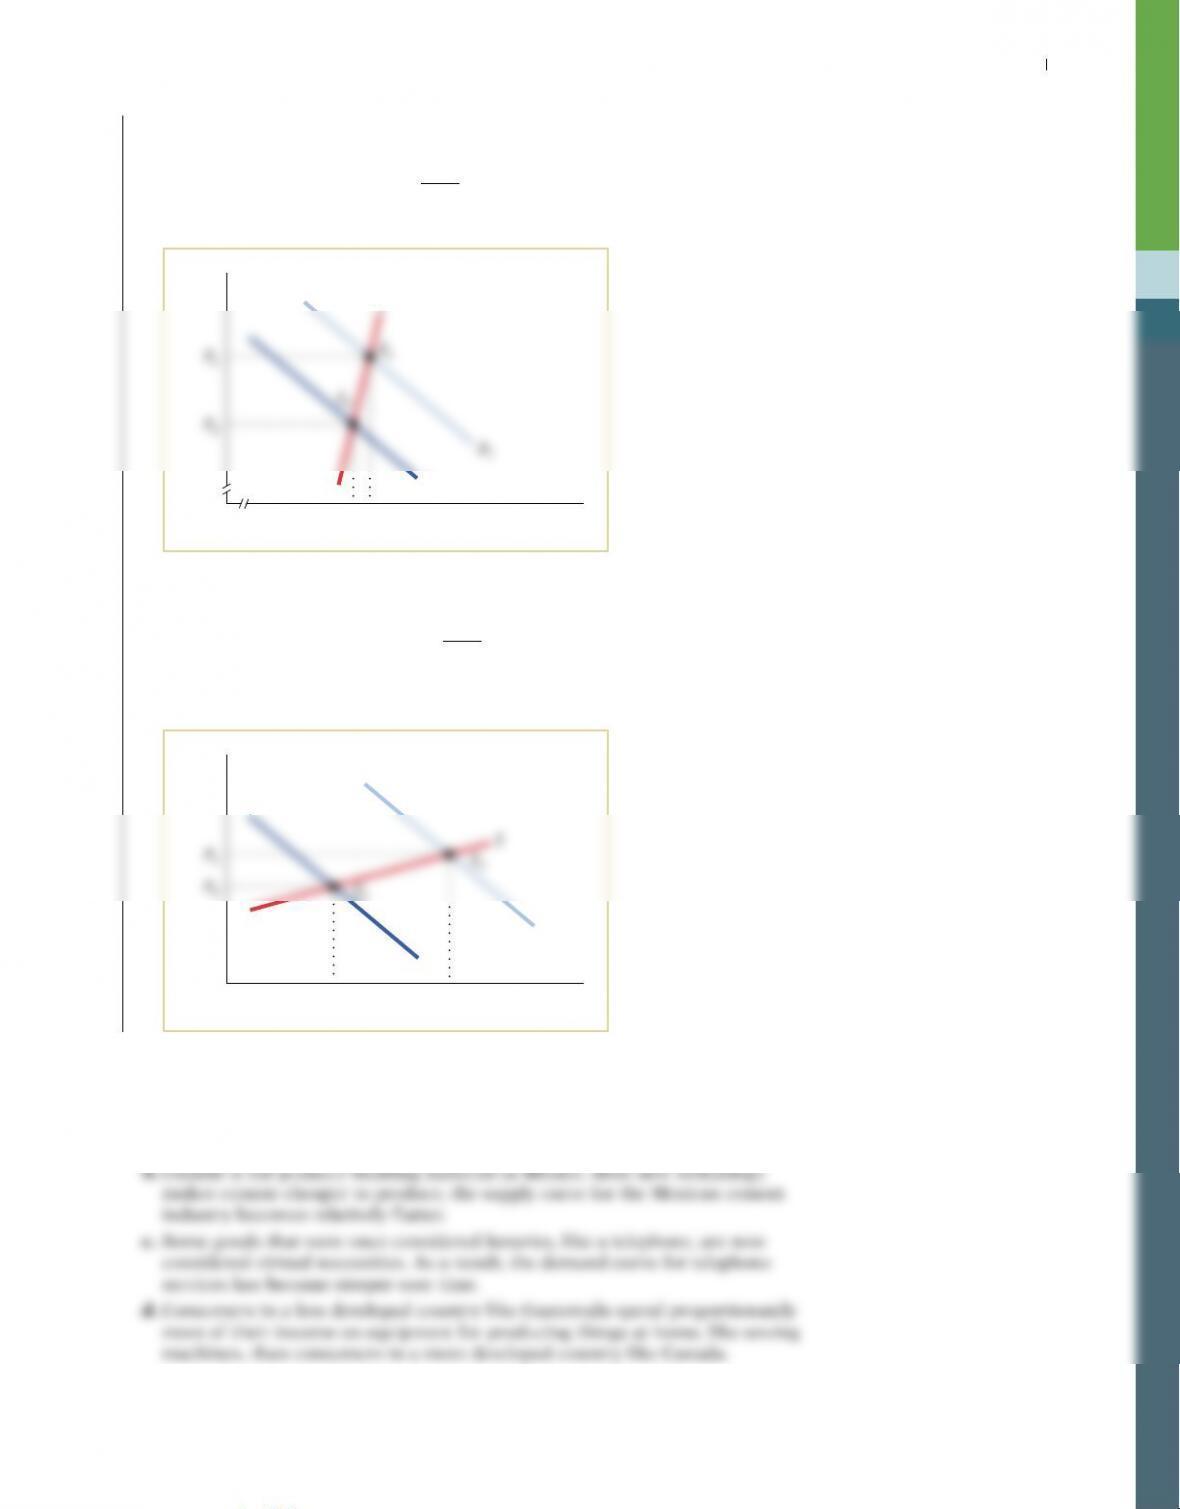
6. Take a linear demand curve like that shown in Figure 6-5, where the range of
prices for which demand is elastic and inelastic is labeled. In each of the follow-
ing scenarios, the supply curve shifts. Show along which portion of the demand
curve (that is, the elastic or the inelastic portion) the supply curve must have
Solution
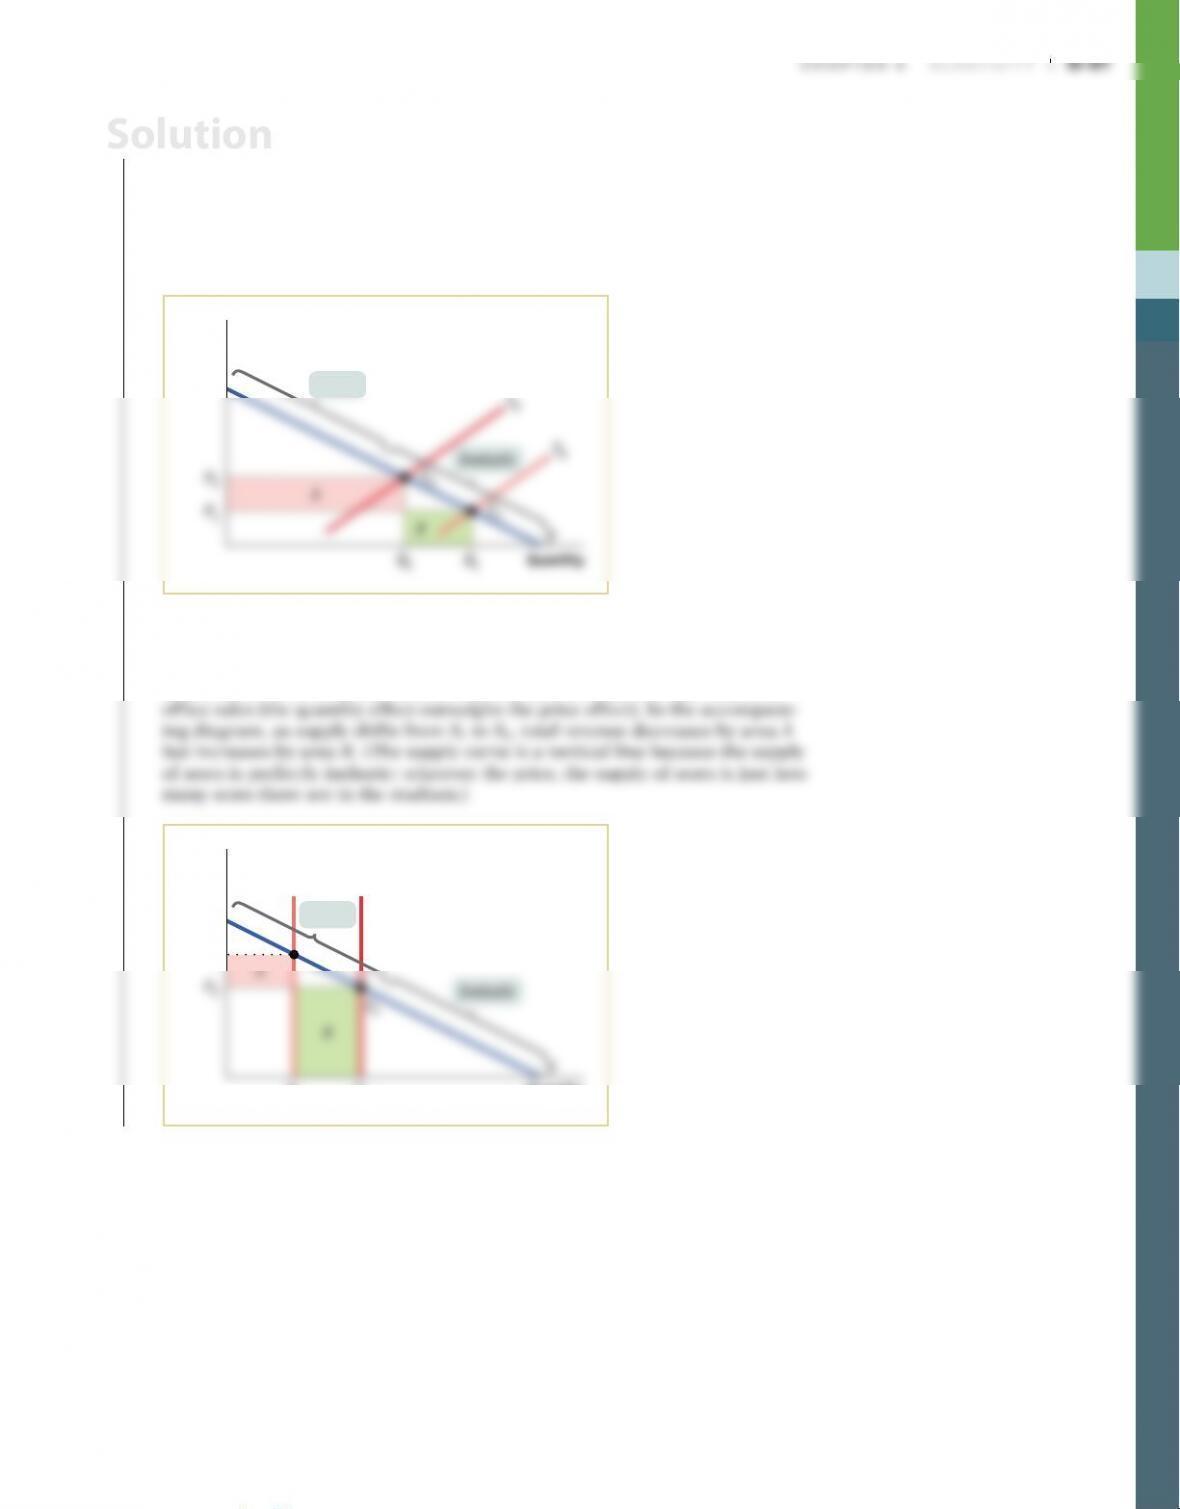
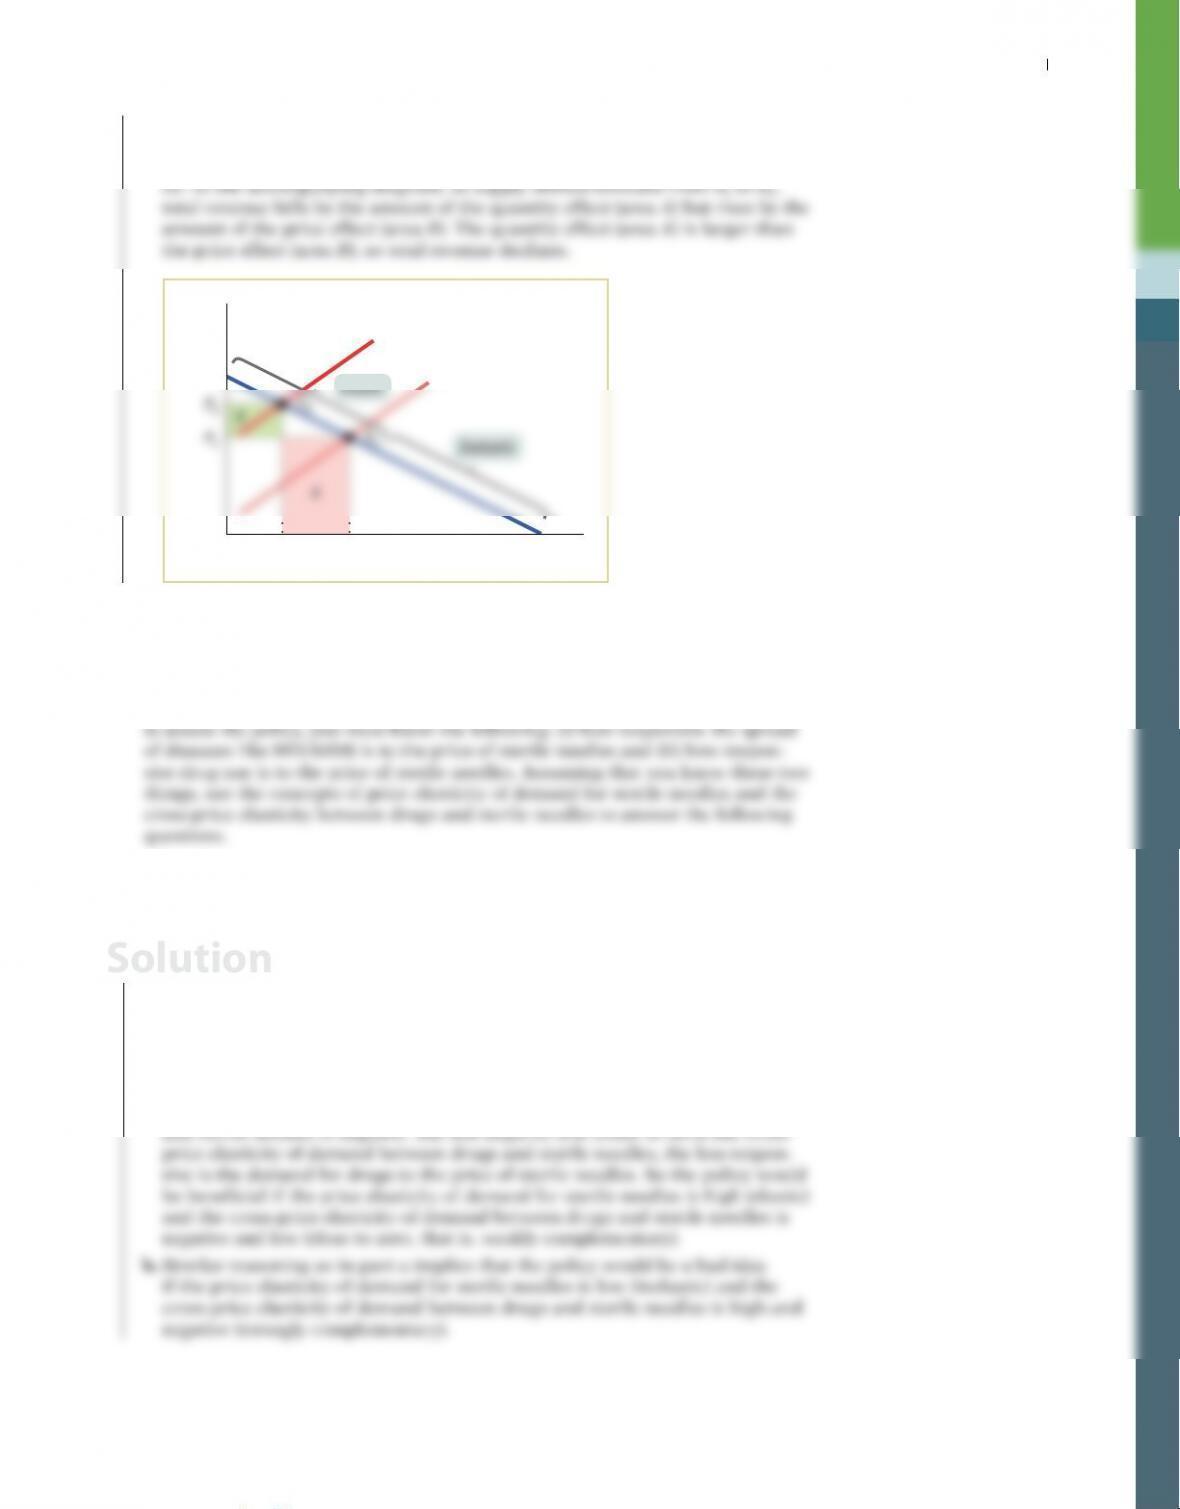
6. a. Attempts to stop the flow of drugs into the United States shift the supply curve
leftward, raising the price of drugs and reducing the quantity demanded.
If this benefits drug dealers, their total revenue must have increased. That
is, we must be on the inelastic portion of the demand curve, where a rise in
price results in an increase in revenue (the price effect outweighs the quantity
effect). In the accompanying diagram, as supply shifts from S1 to S2, revenue
decreases by area B but increases by area A.
Elastic
S2
Price
Solution
S-92 Chapter 6 Elasticity
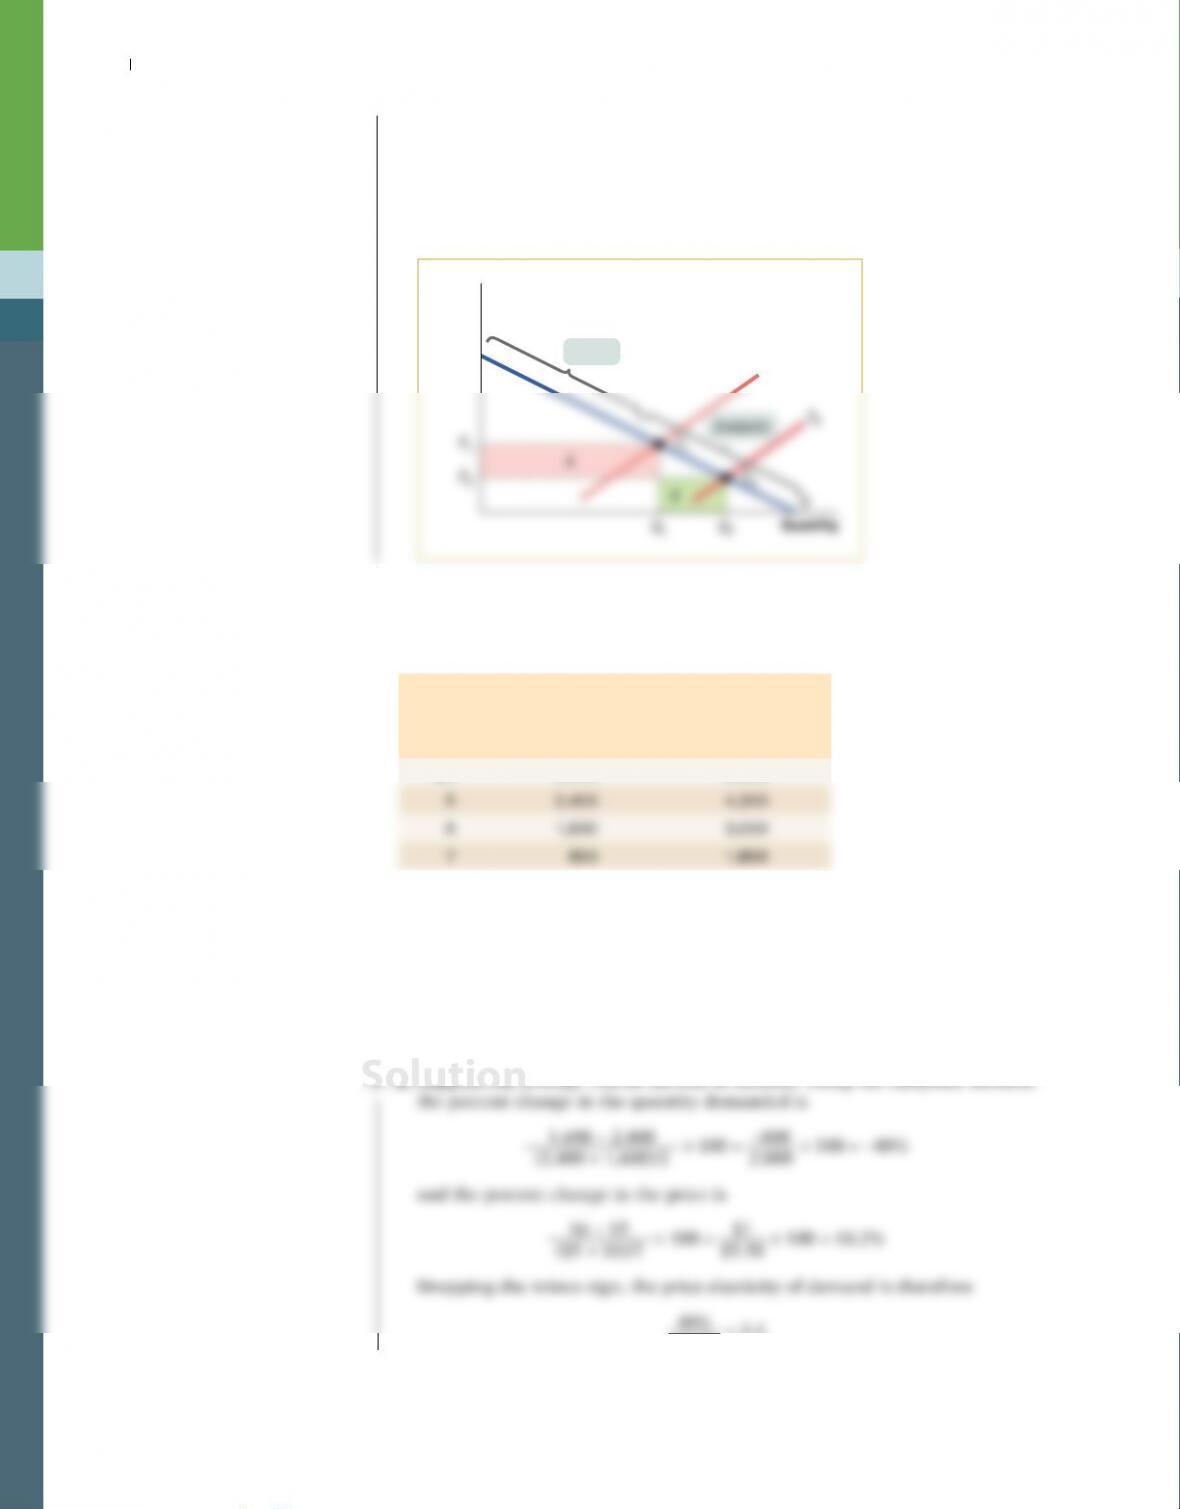
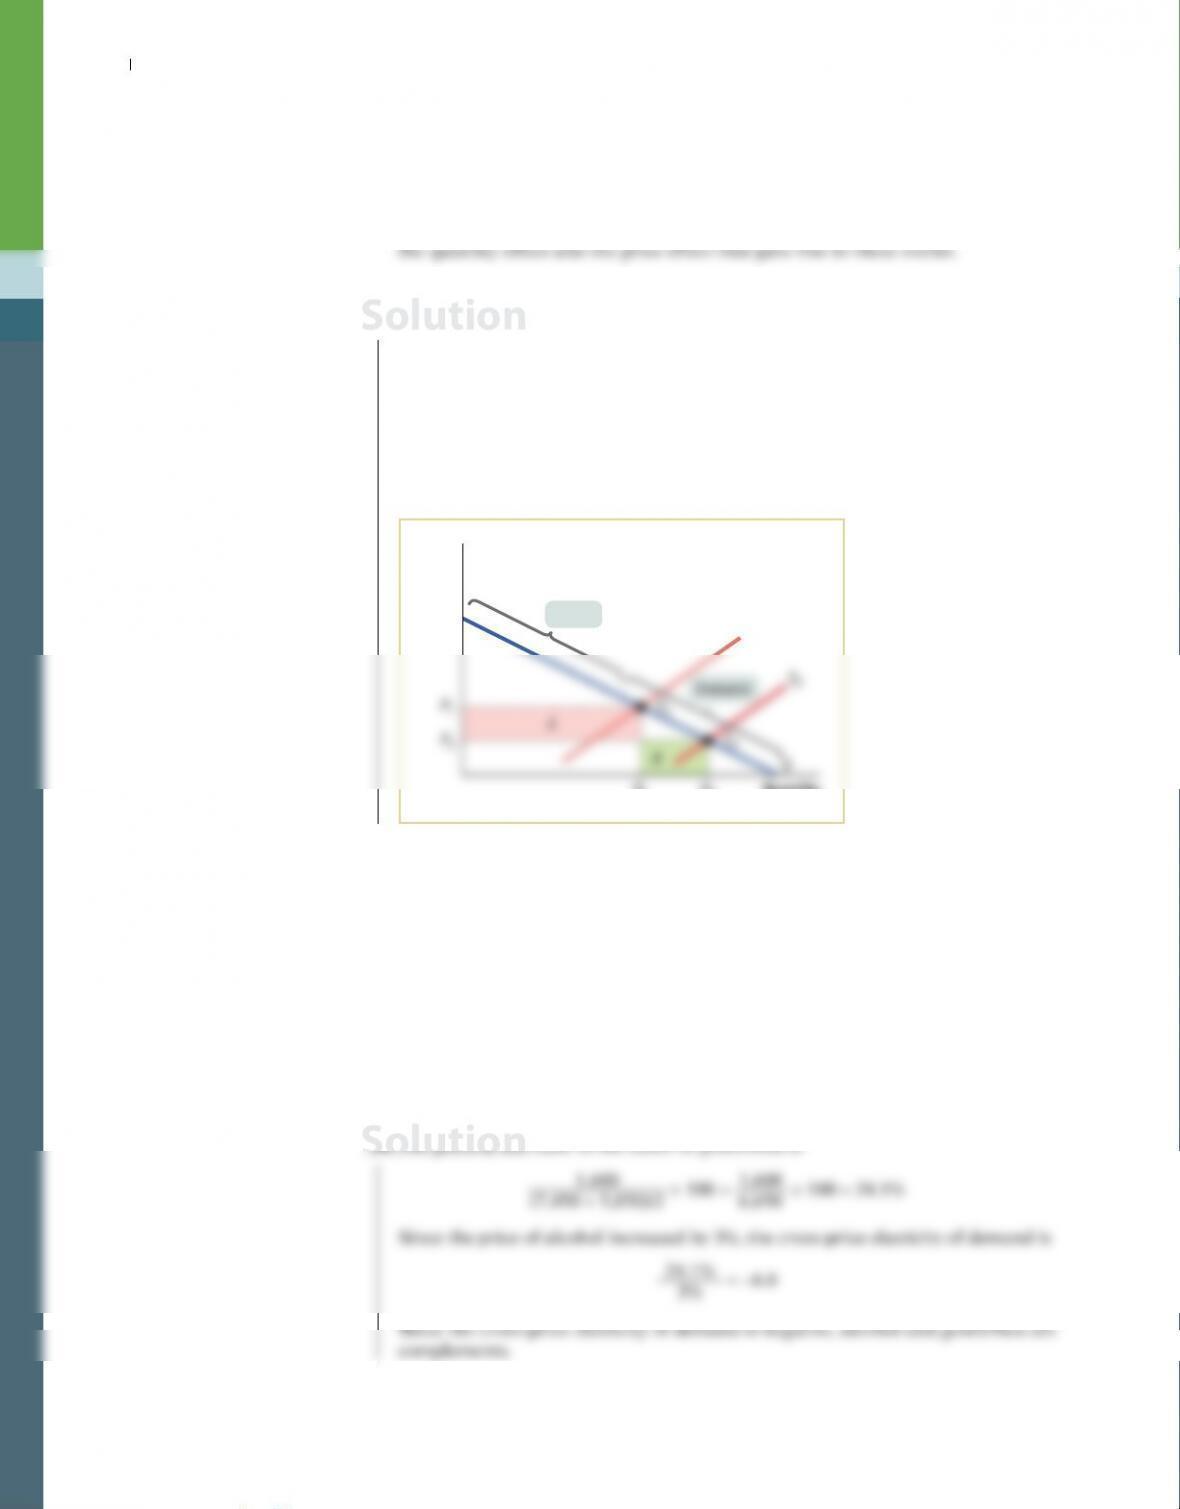
c. Increasing production shifts the supply curve rightward, lowering the price of
Porsches and increasing the quantity demanded. If this reduces total revenue,
we must be on the inelastic portion of the demand curve, where a fall in price
results in a fall in total revenue (the price effect outweighs the quantity effect).
In the accompanying diagram, as supply shifts from S1 to S2, total revenue
decreases by area A but increases only by area B.
Elastic
S1
Price
Chapter 6 Elasticity S-93
Now suppose the average tourist income is $30,000. The percent change in the
33.3%
18.2% = 1.8
b. Suppose the price of a T-shirt is $4. Using the midpoint method, the percent
change in the quantity demanded is
The income elasticity of demand is therefore
50%
40% = 1.25
Now suppose the price is $7. The percent change in the quantity demanded is
The income elasticity of demand is therefore
8. A recent study determined the following elasticities for Volkswagen Beetles:
Price elasticity of demand = 2
Income elasticity of demand = 1.5
The supply of Beetles is elastic. Based on this information, are the following
statements true or false? Explain your reasoning.
S-94 Chapter 6 Elasticity
9. In each of the following cases, do you think the price elasticity of supply is
(i) perfectly elastic; (ii) perfectly inelastic; (iii) elastic, but not perfectly elastic;
or (iv) inelastic, but not perfectly inelastic? Explain using a diagram.
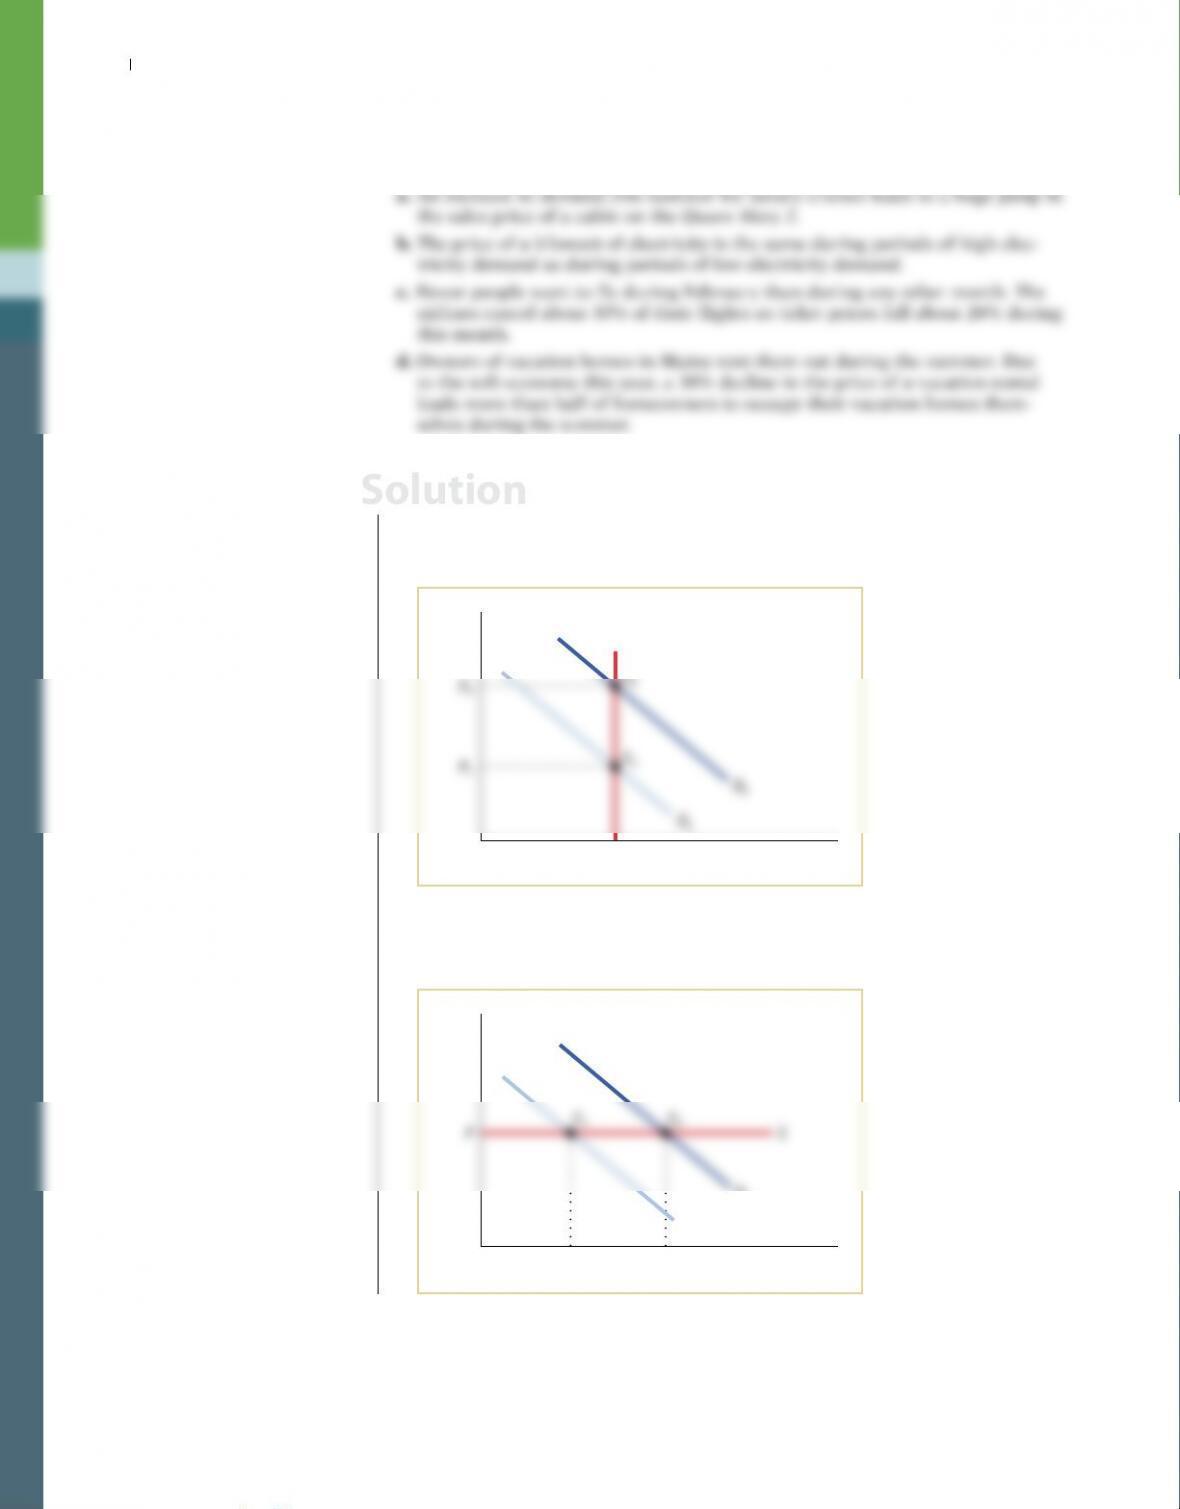
9. a. Supply is perfectly inelastic: the quantity of cabins on the Queen Mary 2 is
fixed. As demand increases (a rightward shift in the demand curve), the price
of a cabin on the Queen Mary 2 increases, without an increase in the quantity
supplied. See the accompanying diagram.
Q
Quantity
Price
S
D1
b. Supply is perfectly elastic. As demand changes (for instance, as demand
increases in times of high electricity demand), price does not change but the
quantity supplied does change. See the accompanying diagram.
Q1
PS
Quantity
Price
D2
Q2
D1
Solution
Chapter 6 Elasticity S-95
c. Supply is inelastic. As price falls by 20%, the quantity supplied falls by 10%.
This implies a price elasticity of supply of
10%
20% = 0.5
which is inelastic. See the accompanying diagram.
Q1
P2
P1
S
Quantity
Price
Q2
E2
E1
D2
d. Supply is elastic. As price falls by 30%, the quantity supplied falls by more
than 50%. This implies a price elasticity of supply greater than
50%
30%
that is, a price elasticity of supply greater than 1.7. See the accompanying
diagram.
Q1
S
Quantity
Price
Q2
D2
D1
10. Use an elasticity concept to explain each of the following observations.
a. During economic booms, the number of new personal care businesses, such as
gyms and tanning salons, is proportionately greater than the number of other
new businesses, such as grocery stores.

10. a. During times of economic boom, incomes rise. Whether, and by how much,
demand responds to changes in income is determined by the income elasticity
of demand. Since the demand for personal care services increases as income
increases, personal care services are a normal good. If the demand for per-
sonal care services is more responsive to changes in income than the demand
b. New technology has made cement easier to produce. This implies that as the price
of cement rises, many more firms are now willing to supply cement than before;
that is, supply has become more elastic, leading to a relatively flatter supply curve.
c. As telephones have become less and less of a luxury, the price elasticity of
demand for telephones has fallen: telephones have become so much a necessity
d. Incomes in Canada are higher than those in Guatemala. The statement there–
fore implies that as income rises, the demand for sewing machines increases
by proportionately less than the change in income, making the income elas–
11. Taiwan is a major world supplier of semiconductor chips. A recent earthquake
severely damaged the production facilities of Taiwanese chip-producing compa-
nies, sharply reducing the amount of chips they could produce.
a. Assume that the total revenue of a typical non-Taiwanese chip manufacturer
rises due to these events. In terms of an elasticity, what must be true for this
to happen? Illustrate the change in total revenue with a diagram, indicat-
ing the price effect and the quantity effect of the Taiwan earthquake on this
company’s total revenue.
b. Now assume that the total revenue of a typical non-Taiwanese chip manufac-
turer falls due to these events. In terms of an elasticity, what must be true for
this to happen? Illustrate the change in total revenue with a diagram, indicat-
11. a. The earthquake shifts the supply curve to the left, leading to a price increase.
If the increase in price results in an increase in total revenue, then the price
effect (which tends to increase total revenue) must outweigh the quantity
Elastic
S2
Price
Solution
Solution
Chapter 6 Elasticity S-97
b. If the increase in price results in a fall in total revenue, then the quantity
effect (which tends to reduce total revenue) must outweigh the price effect
(which tends to increase total revenue). That is, demand must have been elas–
Q1
Q2
A
Quantity
D
12. There is a debate about whether sterile hypodermic needles should be passed
out free of charge in cities with high drug use. Proponents argue that doing so
will reduce the incidence of diseases, such as HIV/AIDS, that are often spread by
needle sharing among drug users. Opponents believe that doing so will encour-
age more drug use by reducing the risks of this behavior. As an economist asked
a. In what circumstances do you believe this is a beneficial policy?
b. In what circumstances do you believe this is a bad policy?
12. a. Handing out free needles lowers the price of needles to zero. First consider
the demand for needles. The higher the price elasticity of demand for sterile
needles, the greater the increase in the quantity of sterile needles demanded
in response to a decrease in the price. And the greater the increase in the
quantity of sterile needles demanded, the lower the spread of diseases like
HIV/AIDS. Now consider the demand for drugs. Drugs and sterile needles
are complements: as the price of sterile needles falls, the demand for drugs
increases. This implies that the cross-price elasticity of demand between drugs
Solution
S-98 Chapter 6 Elasticity
13. Worldwide, the average coffee grower has increased the amount of acreage
under cultivation over the past few years. The result has been that the average
coffee plantation produces significantly more coffee than it did 10 to 20 years
ago. Unfortunately for the growers, however, this has also been a period in which
their total revenues have plunged. In terms of an elasticity, what must be true for
these events to have occurred? Illustrate these events with a diagram, indicating
13. An increase in the amount of acreage that is cultivated results in a rightward shift
in the supply of coffee. This reduces the price of coffee and increases the quantity
demanded. If total revenue from coffee sales has decreased, this means that the
price effect (which tends to lower total revenue) must have outweighed the quan–
tity effect (which tends to increase total revenue). This implies that demand must
be inelastic. As shown in the accompanying diagram, the price effect results in a
loss of total revenue equal to the size of area A. The quantity effect (the quantity
demanded increases as a result of the price fall) results in an increase in total rev–
enue equal to the size of area B. Area A exceeds area B, so total revenue falls.
Elastic
Q2
S1
Q1
Quantity
Price
14. A 2015 article published by the American Journal of Preventive Medicine studied
the effects of an increase in alcohol prices on the incidence of new cases of sexu-
ally transmitted diseases. In particular, the researchers studied the effects that a
Maryland policy increasing alcohol taxes had on the decline in gonorrhea cases.
The report concluded that an increase in the alcohol tax rate by 3% resulted in
1,600 fewer cases of gonorrhea. Assume that prior to the tax increase, the num-
ber of gonorrhea cases was 7,450. Use the midpoint method to determine the
percent decrease in gonorrhea cases, and then calculate the cross-price elastic-
ity of demand between alcohol and the incidence of gonorrhea. According to
your estimate of this cross-price elasticity of demand, are alcohol and gonorrhea
complements or substitutes?
Solution
15. The U.S. government is considering reducing the amount of carbon dioxide that
firms are allowed to produce by issuing a limited number of tradable allowances
for carbon dioxide (CO2) emissions. In a recent report, the U.S. Congressional
Budget Office (CBO) argues that “most of the cost of meeting a cap on CO2 emis–
sions would be borne by consumers, who would face persistently higher prices
for products such as electricity and gasoline . . . poorer households would bear a
larger burden relative to their income than wealthier households would.” What
assumption about one of the elasticities you learned about in this chapter has to
be true for poorer households to be disproportionately affected?
16. According to data from the U.S. Department of Energy, sales of the fuel-efficient
Toyota Prius hybrid fell from 194,108 vehicles sold in 2014 to 180,603 in 2015.
Over the same period, according to data from the U.S. Energy Information
Administration, the average price of regular gasoline fell from $3.36 to $2.43
per gallon. Using the midpoint method, calculate the cross-price elasticity of
demand between Toyota Prii (the official plural of “Prius” is “Prii”) and regular
gasoline. According to your estimate of the cross-price elasticity, are the two
goods complements or substitutes? Does your answer make sense?
16. A fall in price of regular gasoline from $3.36 to $2.43 per gallon, using the mid-
point method, is a percent change of
And a fall in the quantity of Prii demanded from 194,108 to 180,603 vehicles,
using the midpoint method, is a percent change of
So the cross-price elasticity of demand is
Since the cross-price elasticity of demand between Toyota Prii and regular gaso–
line is positive, this estimate indicates that the two are substitutes. This answer
might seem perplexing because cars and gasoline are generally complements:
you need gasoline to run a (gasoline-powered) car like a Toyota Prius. The gen-
demand for gas-guzzling cars falls and the demand for fuel-efficient cars (such
as the Toyota Prius), which are substitutes, rises. So the substitute nature of gas–
guzzlers and Toyota Prii implies a positive cross-price elasticity between gas and
Toyota Prii. Which effect is stronger? Clearly the substitution effect is stronger
Solution

S-100 Chapter 6 Elasticity
WORK IT OUT Interactive step-by-step help with solving this
problem can be found online.
17. Nile.com, the online bookseller, wants to increase its total revenue. One strat–
egy is to offer a 10% discount on every book it sells. Nile.com knows that its
customers can be divided into two distinct groups according to their likely
responses to the discount. The accompanying table shows how the two groups
respond to the discount.
Group A
(sales per week)
Group B
(sales per week)
Volume of sales before the
10% discount
1.55 million 1.50 million
Volume of sales after the
10% discount
1.65 million 1.70 million
a. Using the midpoint method, calculate the price elasticities of demand for
group A and group B.
b. Explain how the discount will affect total revenue from each group.
c. Suppose Nile.com knows which group each customer belongs to when he
17. a . Using the midpoint method, the percent change in the quantity demanded by
group A is
and since the change in price is 10%, the price elasticity of demand for group A is
Using the midpoint method, the percent change in the quantity demanded by
group B is
and since the change in price is 10%, the price elasticity of demand for group B is
Solution