CHAPTER 6
Search and Unemployment
KEY IDEAS IN THIS CHAPTER
1. The model constructed in this chapter is intended to explain Statistics Canada labor
3. In the Diamond-Mortensen-Pissarides (DMP) labor search model, on the supply side
of the labor market, there are N consumers who choose between home production and
4. For consumers, searching for work becomes more attractive the higher the market
5. For firms, posting vacancies becomes more attractive the lower is the cost of posting
6. In equilibrium, a higher unemployment insurance benefit increases the unemployment
7. In equilibrium, an increase in productivity increases labor market tightness, reduces
the unemployment rate, increases the vacancy rate, and increases the labor force.
8. In equilibrium, a decrease in matching efficiency reduces labor market tightness,
9. A form of Keynesian analysis is introduced. In the DMP model, bargaining between a
matched firm and worker determines the wage, but bargaining strength can be
Chapter 6: Search and Unemployment
NEW IN THE FOURTH EDITION
1. The entire chapter is new.
TEACHING GOALS
Including a version of the DMP model in an intermediate macroeconomics text is a
novelty. Students should not have difficulty understanding the model, but they may need
some additional help, as the approach is somewhat different than what we use in standard
competitive equilibrium models, for example in Chapter 5. However, it helps to think of
the labor market in terms of demand and supply sides. Then, it is possible to use what a
student knows from Chapter 5 to teach them about the DMP model. Workers and firms
care about the wage in the same way they do in a competitive model, but now the market
It is important first to understand the labor market data. The DMP model is very nice, as
the variables in the model match up almost exactly with the labor market data as
measured. The unemployed are those who chose to search but were unsuccessful, the
labor force is the number of people who actively searched and found a job (employed)
plus the number who actively searched and were unsuccessful (the unemployed), etc.
Instructor’s Manual for Macroeconomics, Fourth Canadian Edition
CLASSROOM DISCUSSION TOPICS
It should not be hard to get students talking about unemployment. Most of them should
know someone who has been unemployed, or they have read about unemployment as it
relates to the recent recession. However, students may not understand how
It will be helpful if students understand why a search-model approach is necessary to
understanding unemployment. Get them thinking about what an unemployed person is
actually doing, and what is motivating them. Unemployment is an economically
measurable activity, and we want to take a scientific approach to thinking about it.
Also, get the students to think about what motivates firms to search for workers to fill job
openings. Why is searching for workers costly? What difficulties does a firm face in
hiring workers? How does matching between firms and workers take place? Why is the
market for labor similar to, and different from, the market for a good or service?
OUTLINE
1. The Behaviour of the Unemployment Rate, the Participation Rate, and the
Employment/Population Ratio in Canada
2. The Diamond-Mortensen-Pissarides Model of Search and Unemployment
a) Consumers
b) Firms
c) Matching
d) Optimization by Consumers
e) Optimization by Firms
f) Equilibrium
Chapter 6: Search and Unemployment
TEXTBOOK QUESTION SOLUTIONS
Problems
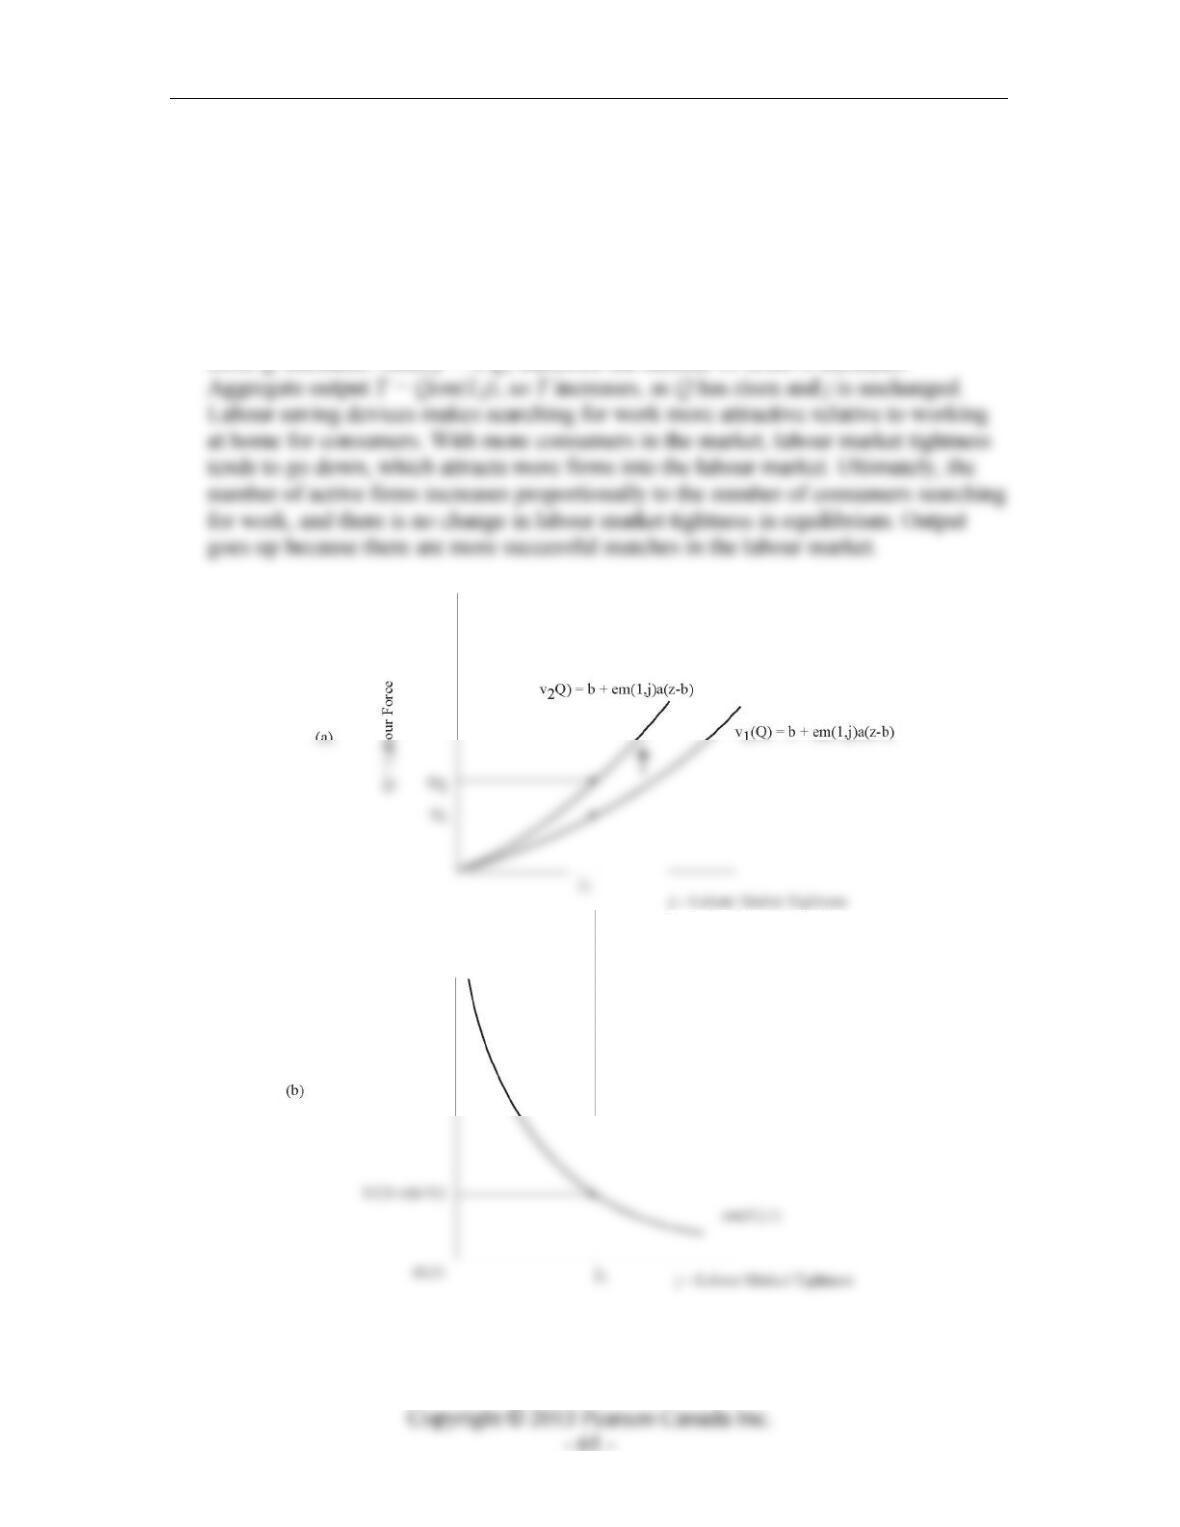
1. More labour-saving devices has the effect of reducing the payoff to working at home
for all consumers, which reduces v(Q) for each value of Q. As a result, the curve in
panel (a) of Figure 6.1 shifts up. In equilibrium, Q increases, but j remains
unchanged. The unemployment rate and the vacancy rate are unaffected, but the labor
force Q increases. Since j = A/Q, therefore the number of firms A increases.
Figure 6.1
2. (i) With a subsidy s to hiring a worker, for a successful match, the surplus of the firm
is z+s-w, the surplus of the worker is w-b, total surplus is z+s-b, and the wage
(from Nash bargaining) is w=a(z+s)+(1-a)b. Then, on the supply side of the
labour market, the equation determining the curve in panel (a) of Figure 6.2 is
given by
and on the demand side of the market, the equation determining j is
(ii) If the government pays would-be workers to stay out of the labour market, this
has no effect on the demand side (firms’ behavior). However, the supply side of
the labour market is now characterized by the equation
Chapter 6: Search and Unemployment
Figure 6.2
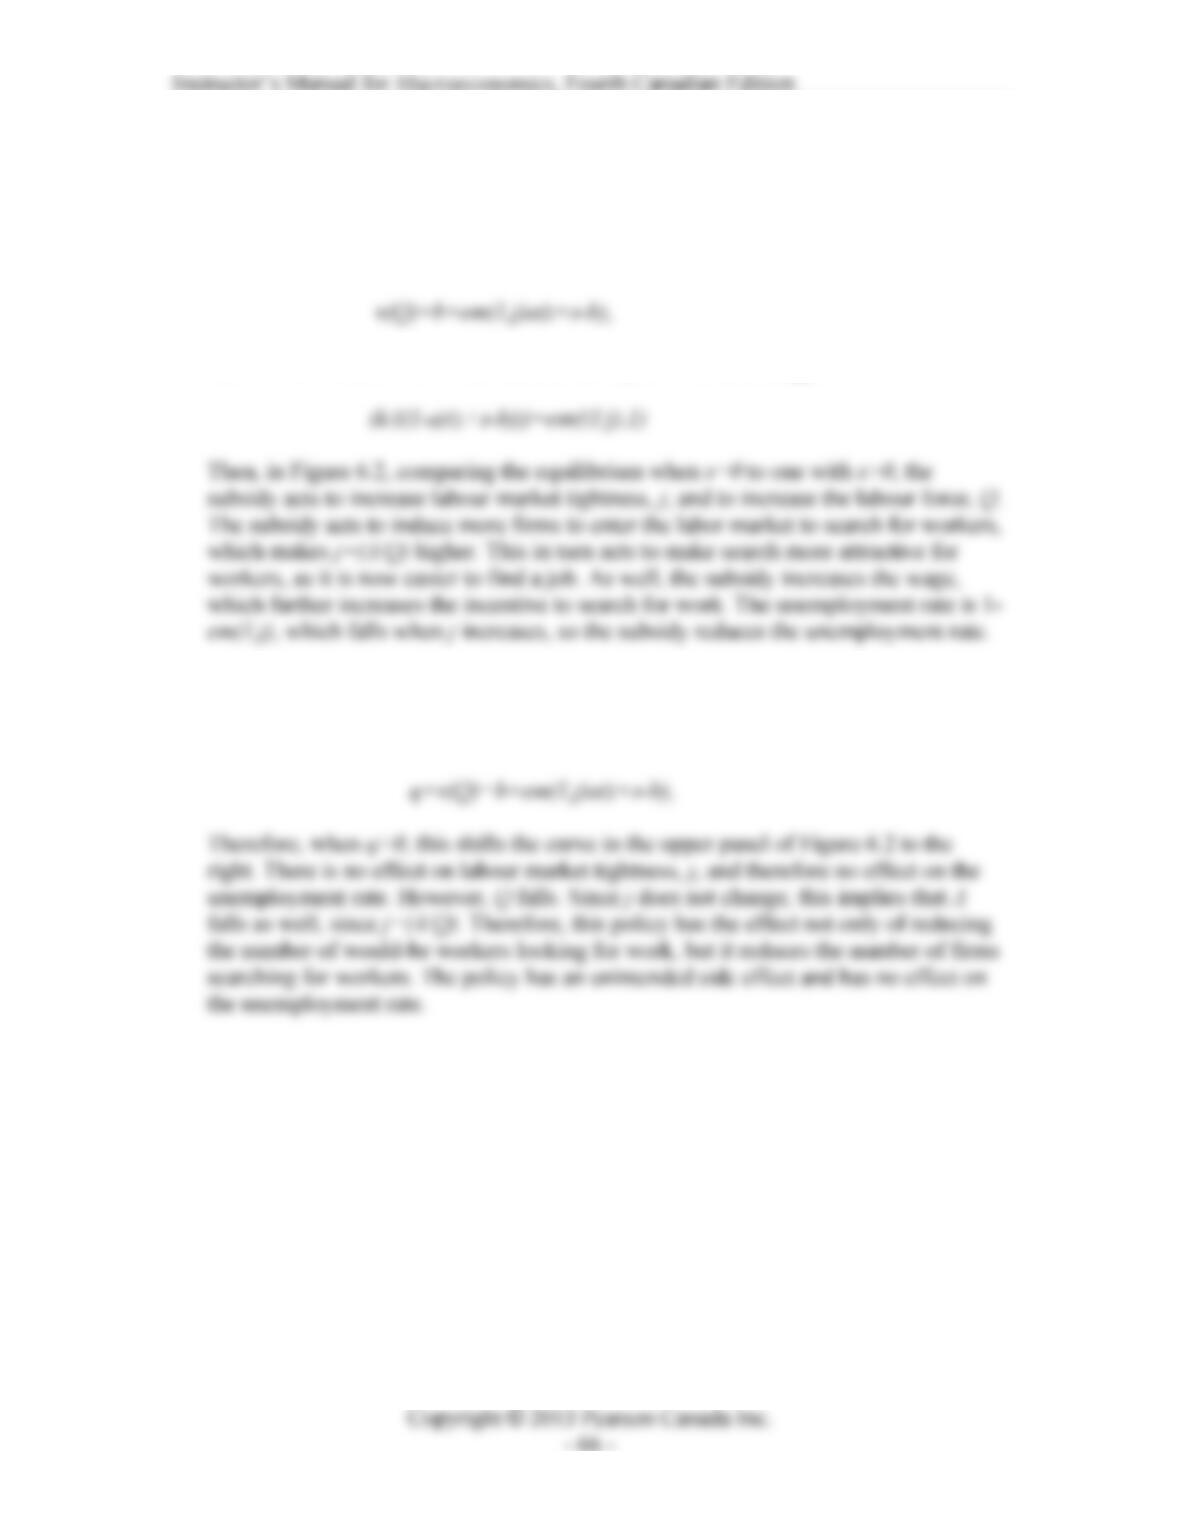
3. The lower recruiting cost, k, affects only the demand side of the labour market. In
Figure 6.3, labour market tightness increases from j to j, and the labor force
increases from Q to Q. The unemployment rate is 1-em(1,j), which decreases
Instructor’s Manual for Macroeconomics, Fourth Canadian Edition
Figure 6.3
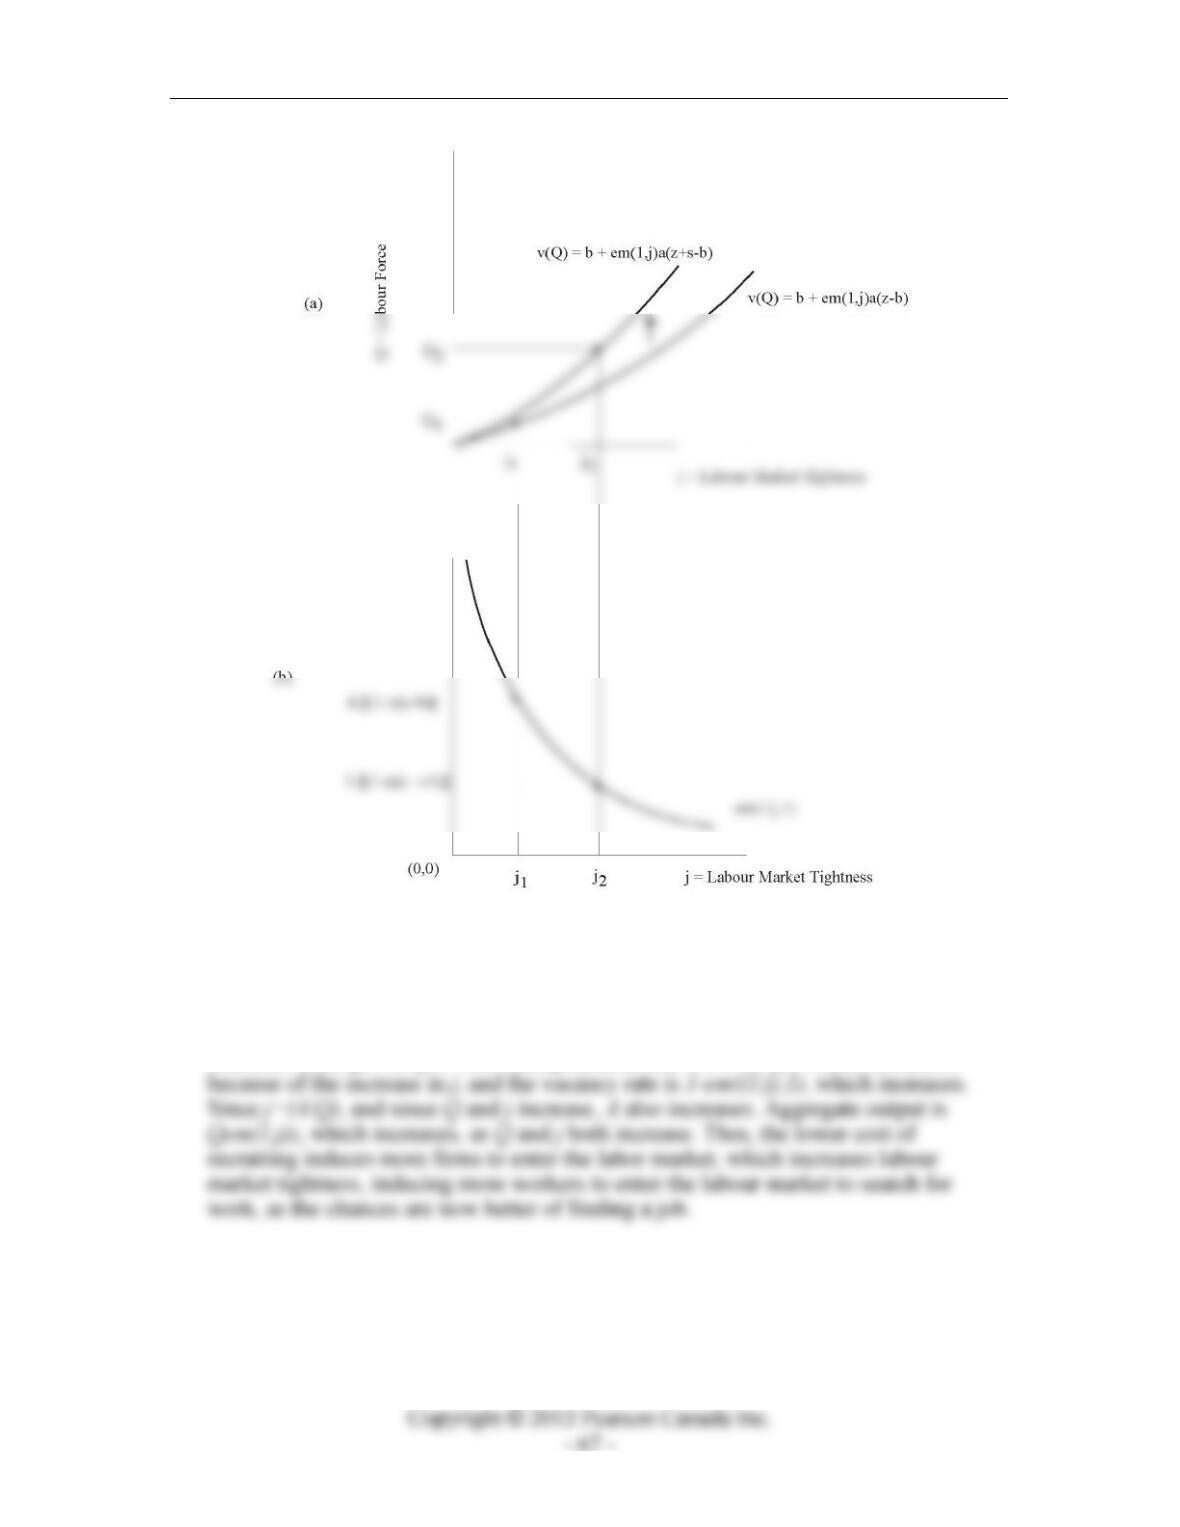
4. For this question, re-define labor market tightness as j = (A+G)/Q. Then, the diagram
we work with looks identical to Figure 6.10 in Chapter 6, and Q and j are determined
as in Figure 6.10. Note in particular that G is irrelevant for determining Q and j, so
government activity is irrelevant for the size of the labor force and labor market
tightness. Further, government activity will not matter for the unemployment rate, the
5. In the Keynesian DMP model, the wage w is indeterminate and, given w, equations
(6.6) and (6.8) solve for Q and j, i.e.
Chapter 6: Search and Unemployment
Suppose that w is “too high” in equilibrium, which implies that Q and j are too low
relative to what is socially efficient. If the government were to subsidize successful
matches by paying s to a firm when a match occurs, then equation (2) becomes
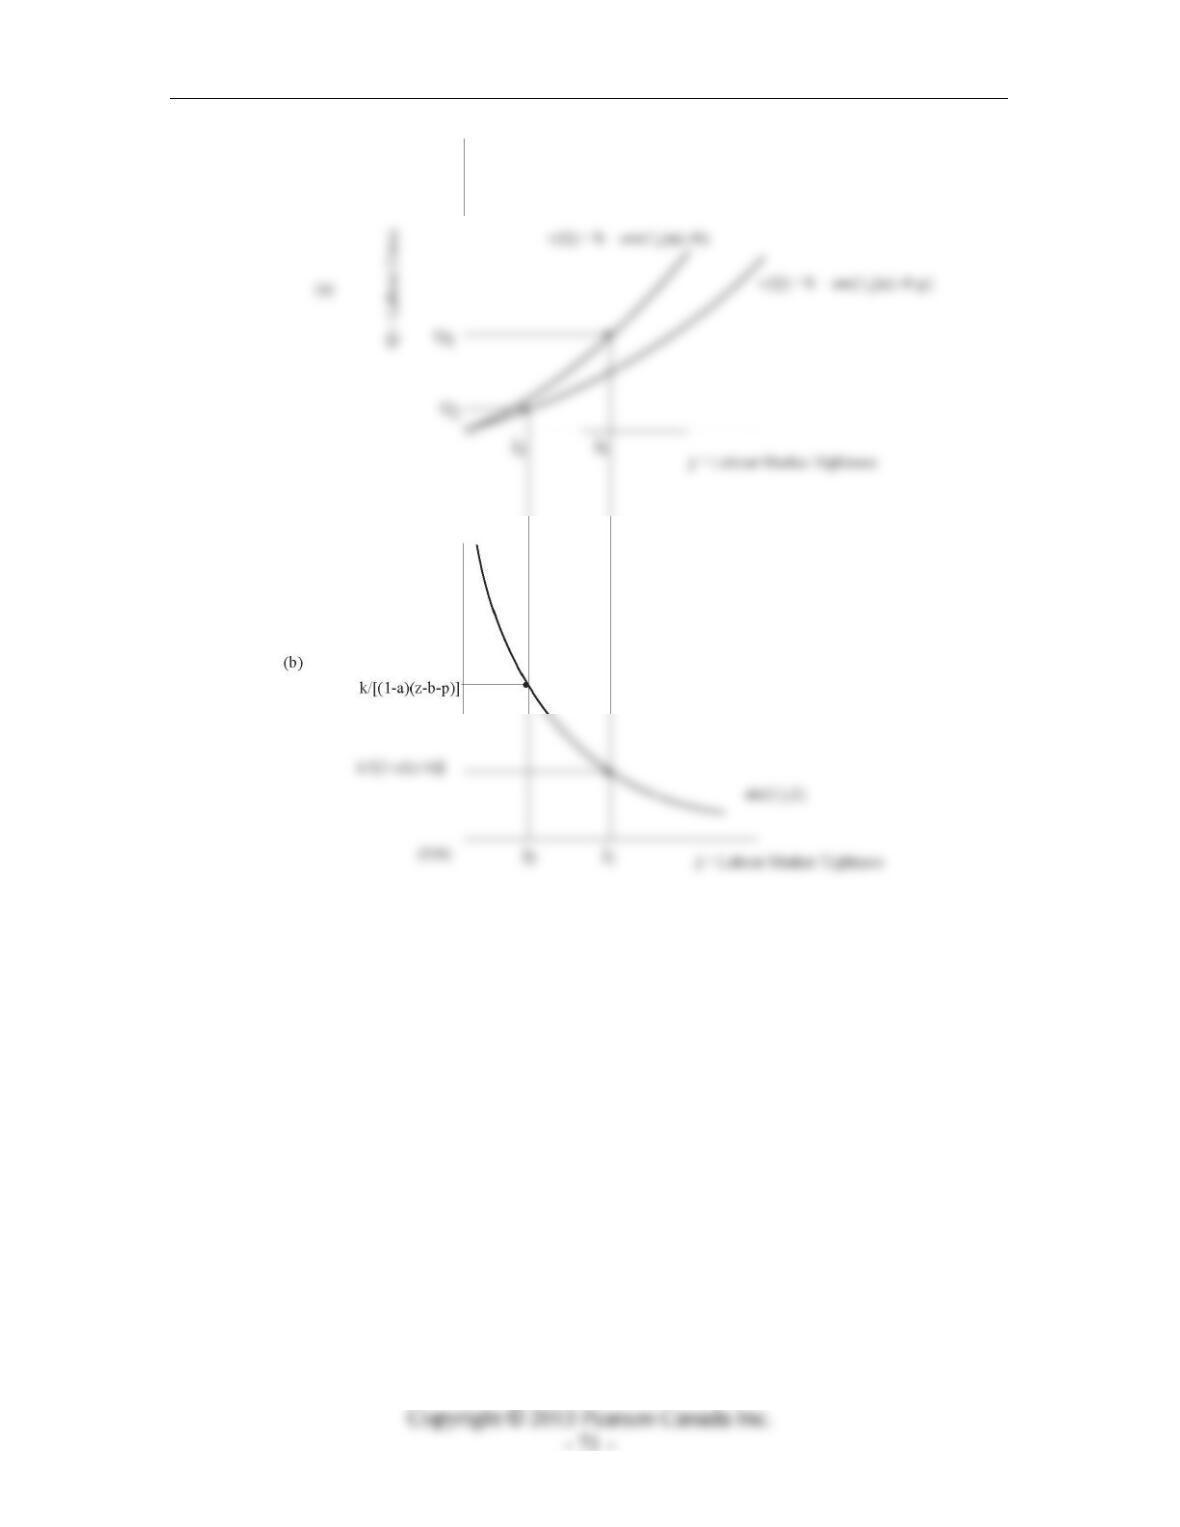
since the firm’s surplus from a match (the firm’s profit) is now z-w+s. In Figure 6.4,
this has the effect of increasing j and Q. As long as the government makes s
sufficiently large, it can correct the social inefficiency. The subsidy makes it more
attractive for firms to enter the labour market to search for workers, which in turn
attracts more would-be workers into the labour market as it is now easier to get a job.
The labor force increases, the unemployment rate decreases, the vacancy rate
as now the vacancy-posting cost is k-s. Qualitatively, this has the same effects as in
Figure 6.4, so in that sense it does not matter if the subsidy is aimed at reducing
recruiting costs or subsidizing successful matches. In fact, it literally makes no
and if the government subsidizes recruiting with a subsidy s, then equation (4)
gives
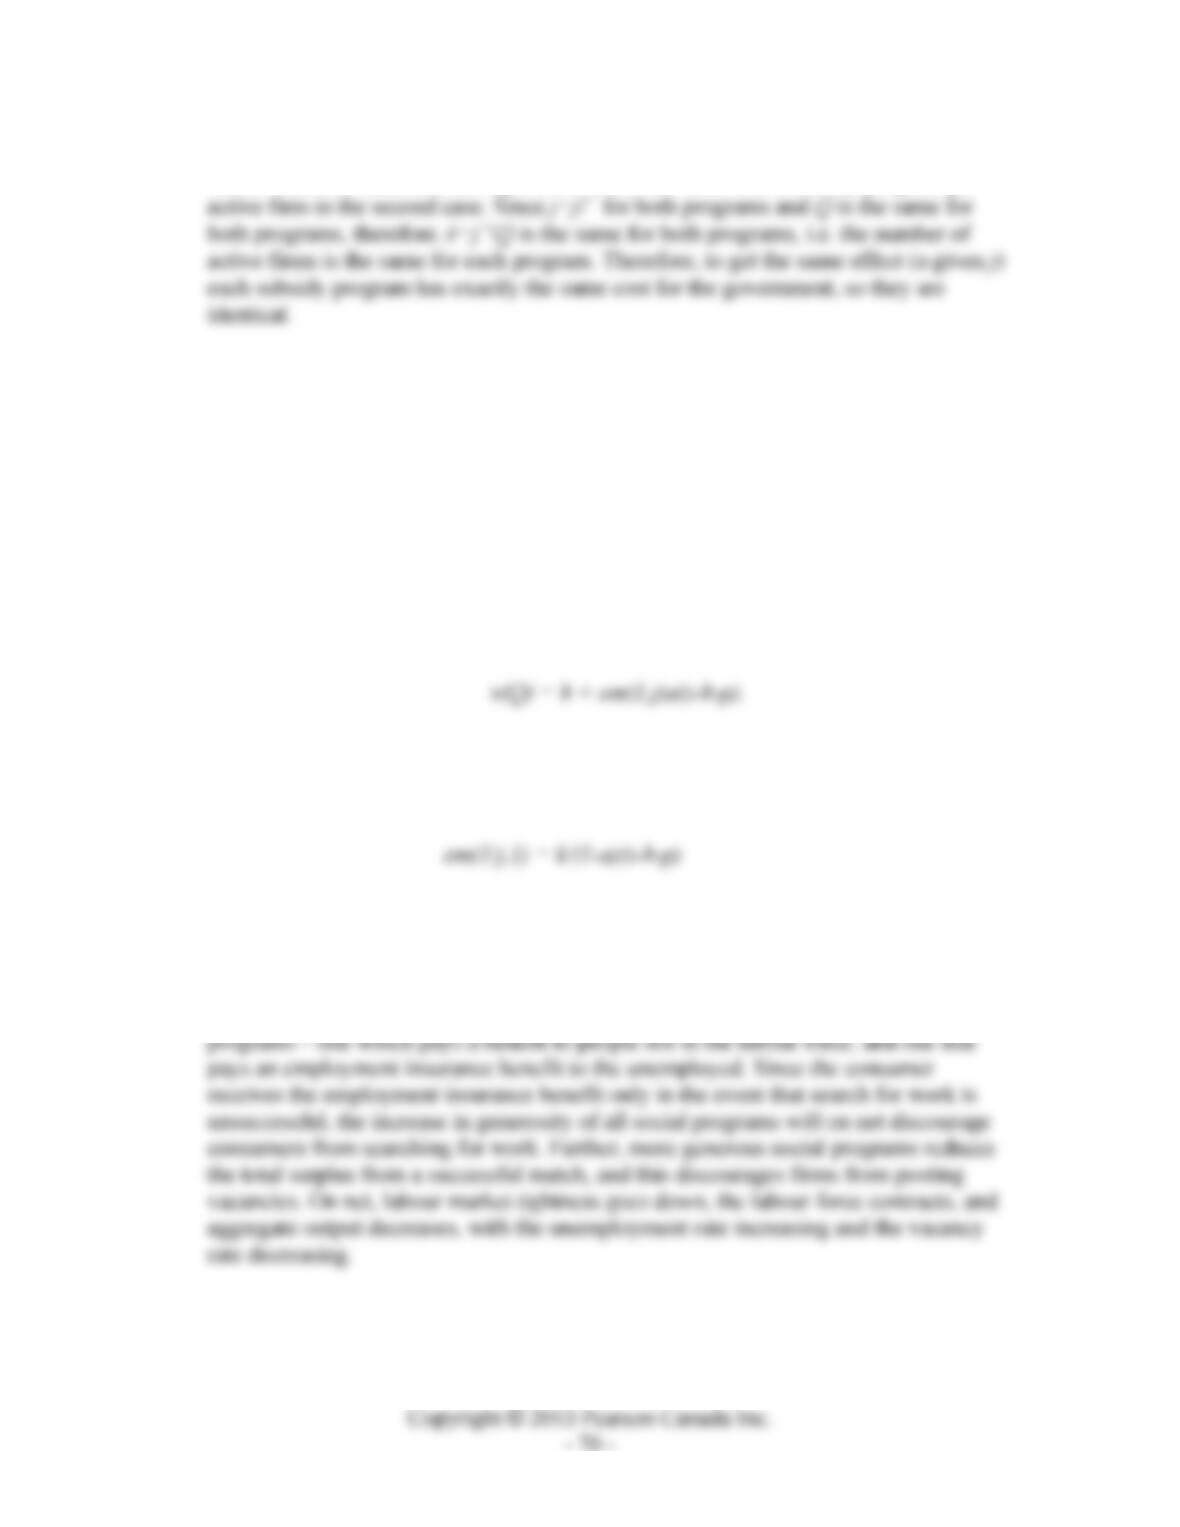
Instructor’s Manual for Macroeconomics, Fourth Canadian Edition
But in equation (7), the left-hand side is the cost of the subsidy program per active
firm, in the first case, and the right-hand side is the cost of the subsidy program per
6. If all social welfare programs simultaneously become more generous, suppose that we
represent this as a payment p to each person not in the labor force, and an increase by
p in the employment insurance benefit. Then, the equation that summarizes behavior
on the supply side of the labour market becomes
v(Q) + p = b + p + em(1,j)a(z-b-p),
or, simplifying,
As well, the equation summarizing demand-side behaviour in the labour market can be
written as
Therefore, in Figure 6.4, labour market tightness falls from j1 to j2, and the labour
force falls from Q1 to Q2. As a result, the unemployment rate increases and the
vacancy rate decreases. The number of firms is A=jQ, so A decreases. As well, output
is Y=zQem(1,j), so output falls as well. Consumers are affected by two social
Chapter 6: Search and Unemployment