Chapter 6
Human Capital
Note: Special icons in the margin identify problems requiring a computer or calculator .
◼ Solutions to Problems
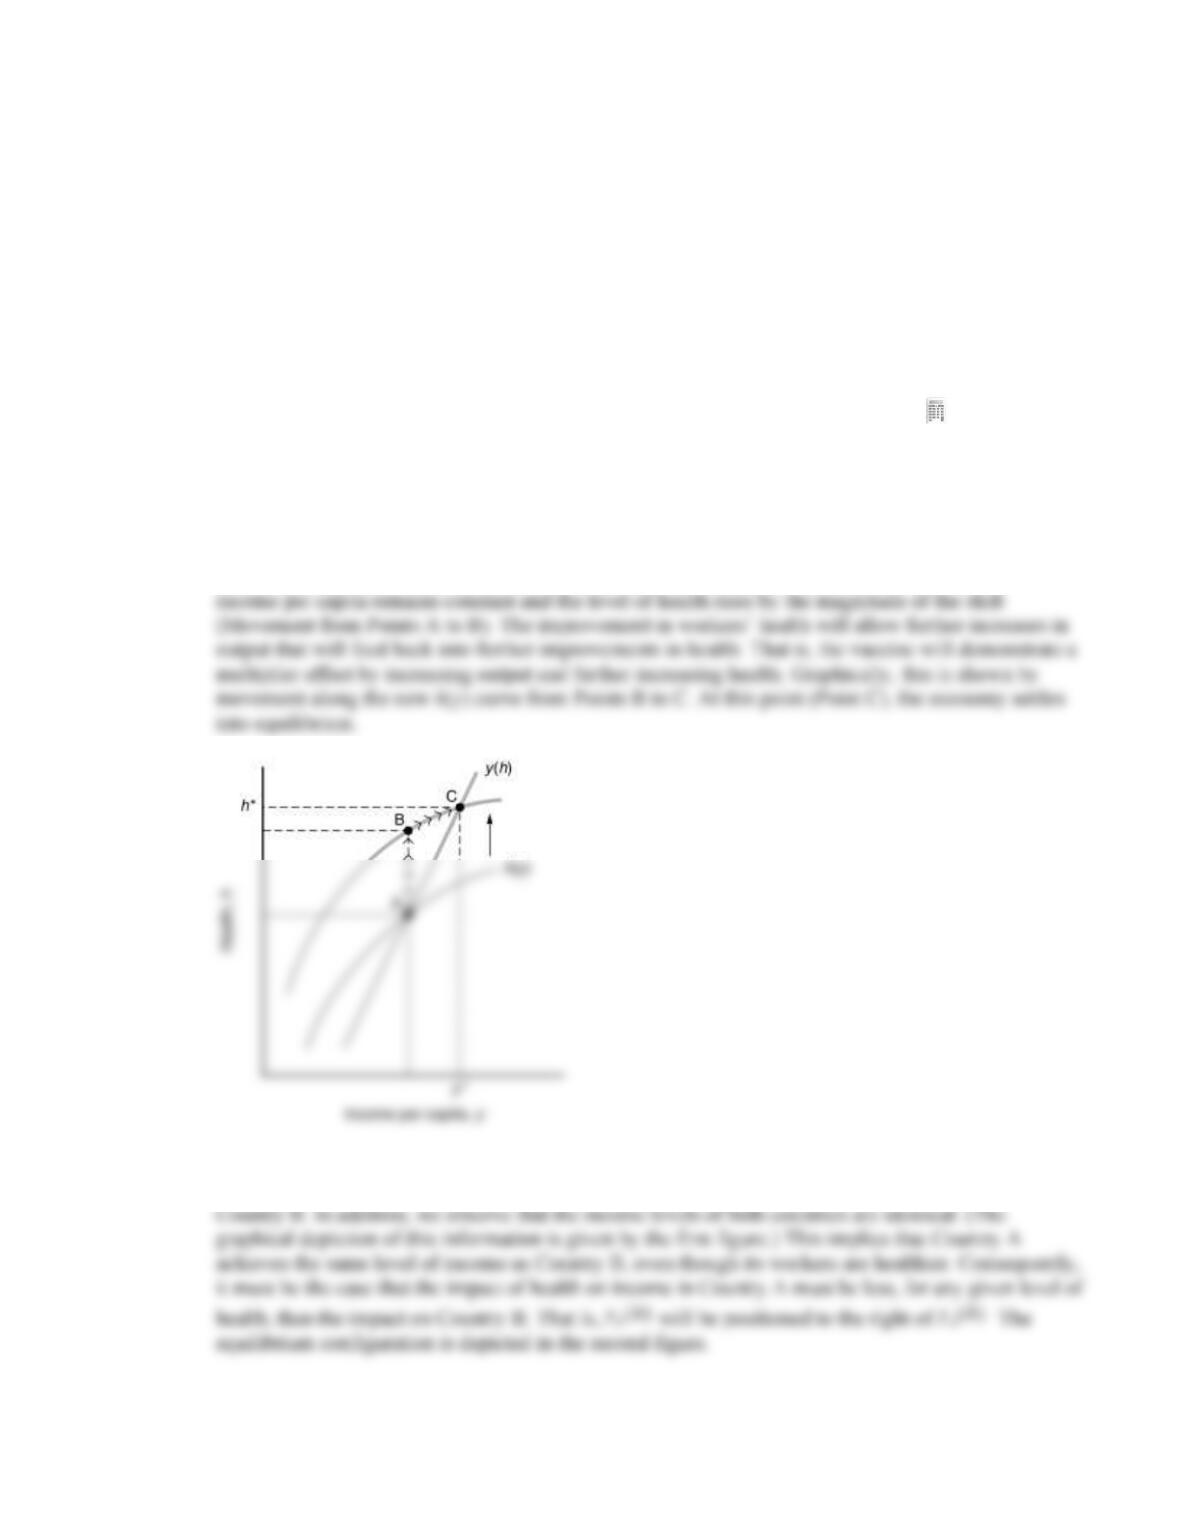
1. Assuming the presence and prevalence of malaria within a given country, the invention of an
effective vaccine would shift upward the h(y) curve. The implication is that for any given level of
income per capita, the vaccine will increase the health of the population. Therefore, the level of
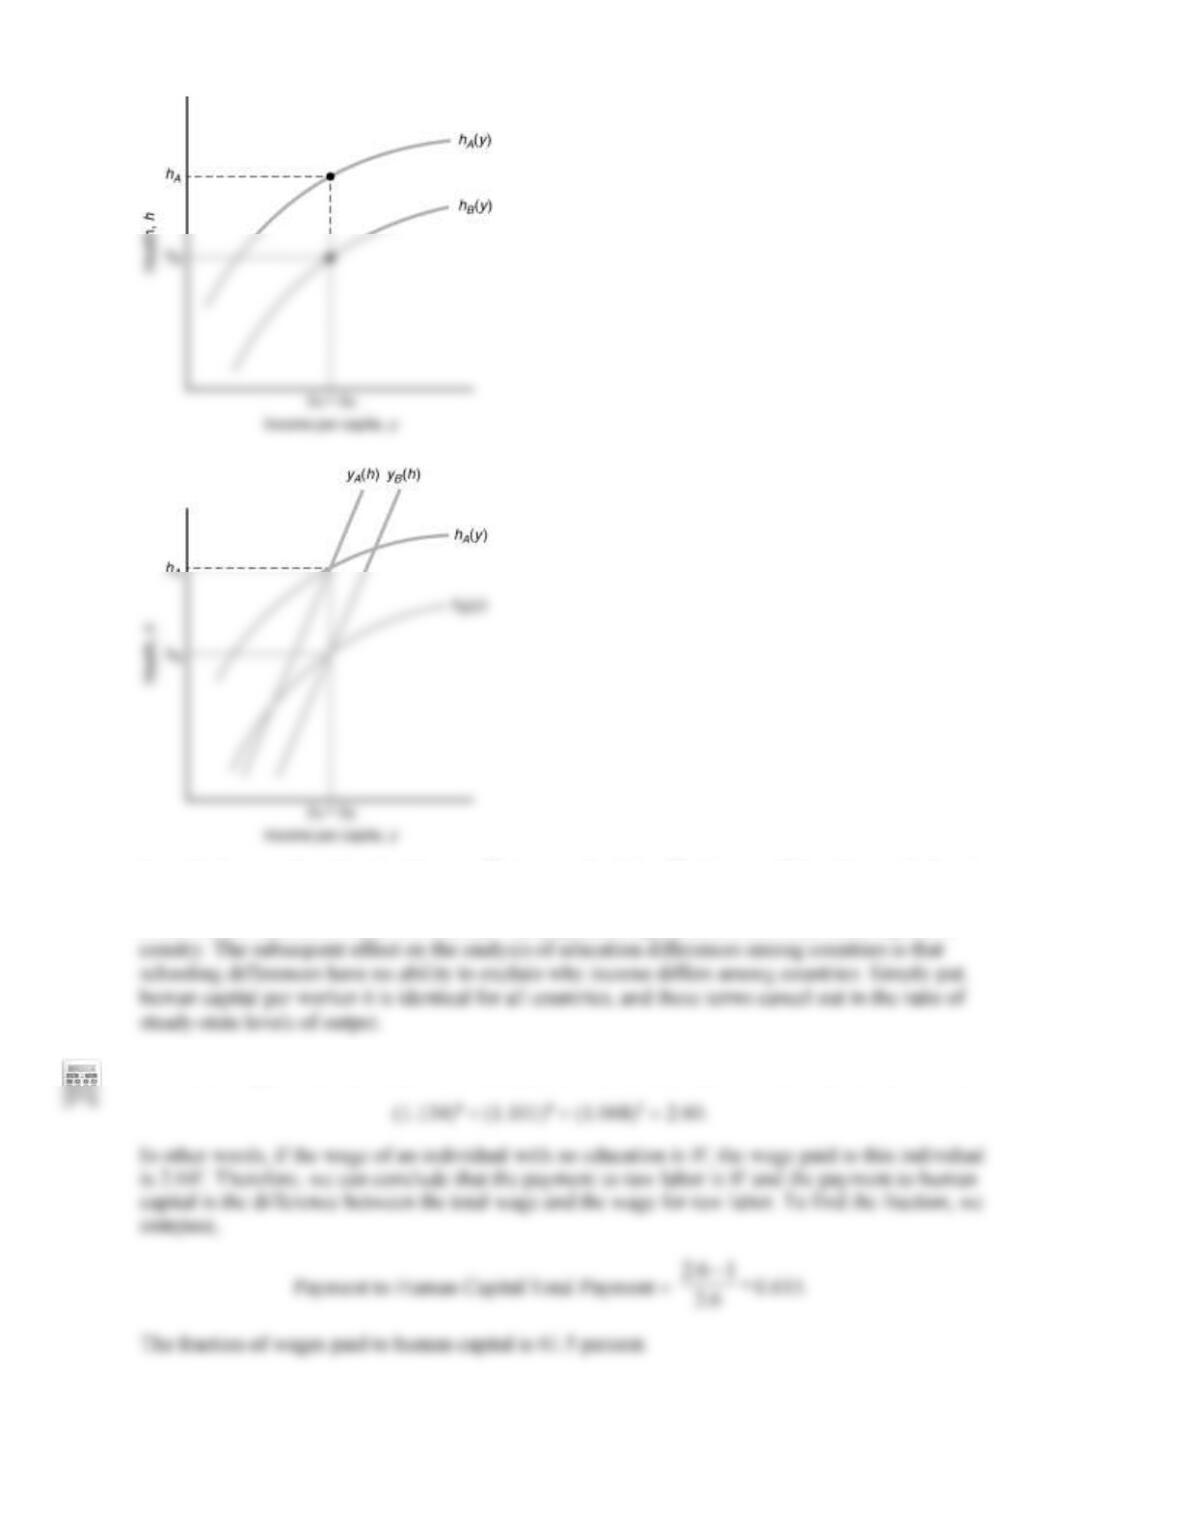
2. Because for any given level of income Country A will generally be healthier than Country B,
we can determine that the
()
A
hy
curve for Country A will be positioned above the
()
B
hy
curve for
3. In the case that education has no effect on productivity. That is, an additional year of education
does not raise the productive ability of an individual. Therefore, the average level of education does
not affect the total labor input of a country. The population again, determines total labor input of a
4. The wage for an individual with nine years of education, relative to one with no education, is
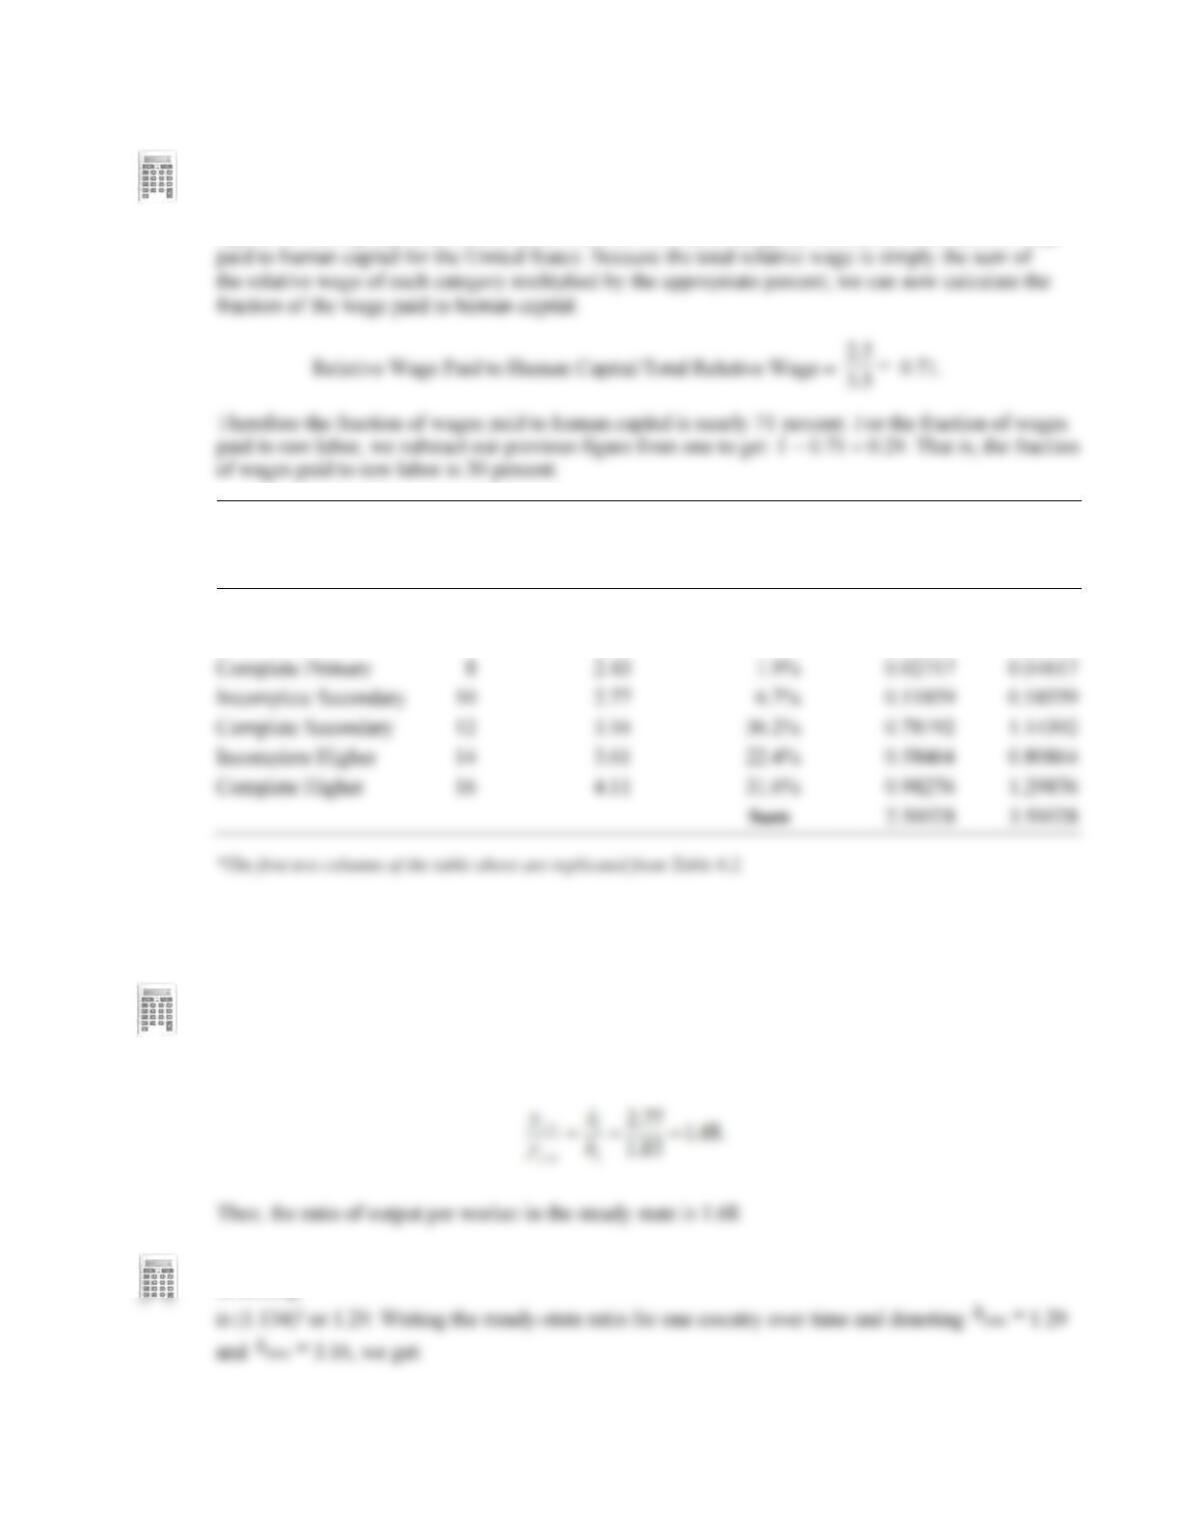
5. We first subtract from each relative wage the relative wage paid for raw labor. This amounts to
subtracting one from the relative wage for every category. Then, we scale this value, multiplying it by
the percentage of people in each category. The resulting number is the relative wage paid to human
capital for each group. The sum of these numbers over each category, therefore, is the relative wage
Years of
Schooling*
Wage Relative
to No Schooling*
Percentage of
People
Relative Wage
Paid to Human
Capital
Total
Relative
Wage
No Schooling
0
1
0.4%
0
0.004
Partial Primary
4
1.65
0.8%
0.0052
0.0132
Complete Primary
8
2.43
1.9%
0.02717
0.04617
Incomplete Secondary
2.77
6.7%
0.11859
0.18559
Complete Secondary
3.16
0.78192
1.14392
Incomplete Higher
3.61
0.58464
0.80864
Complete Higher
4.11
0.98276
1.29876
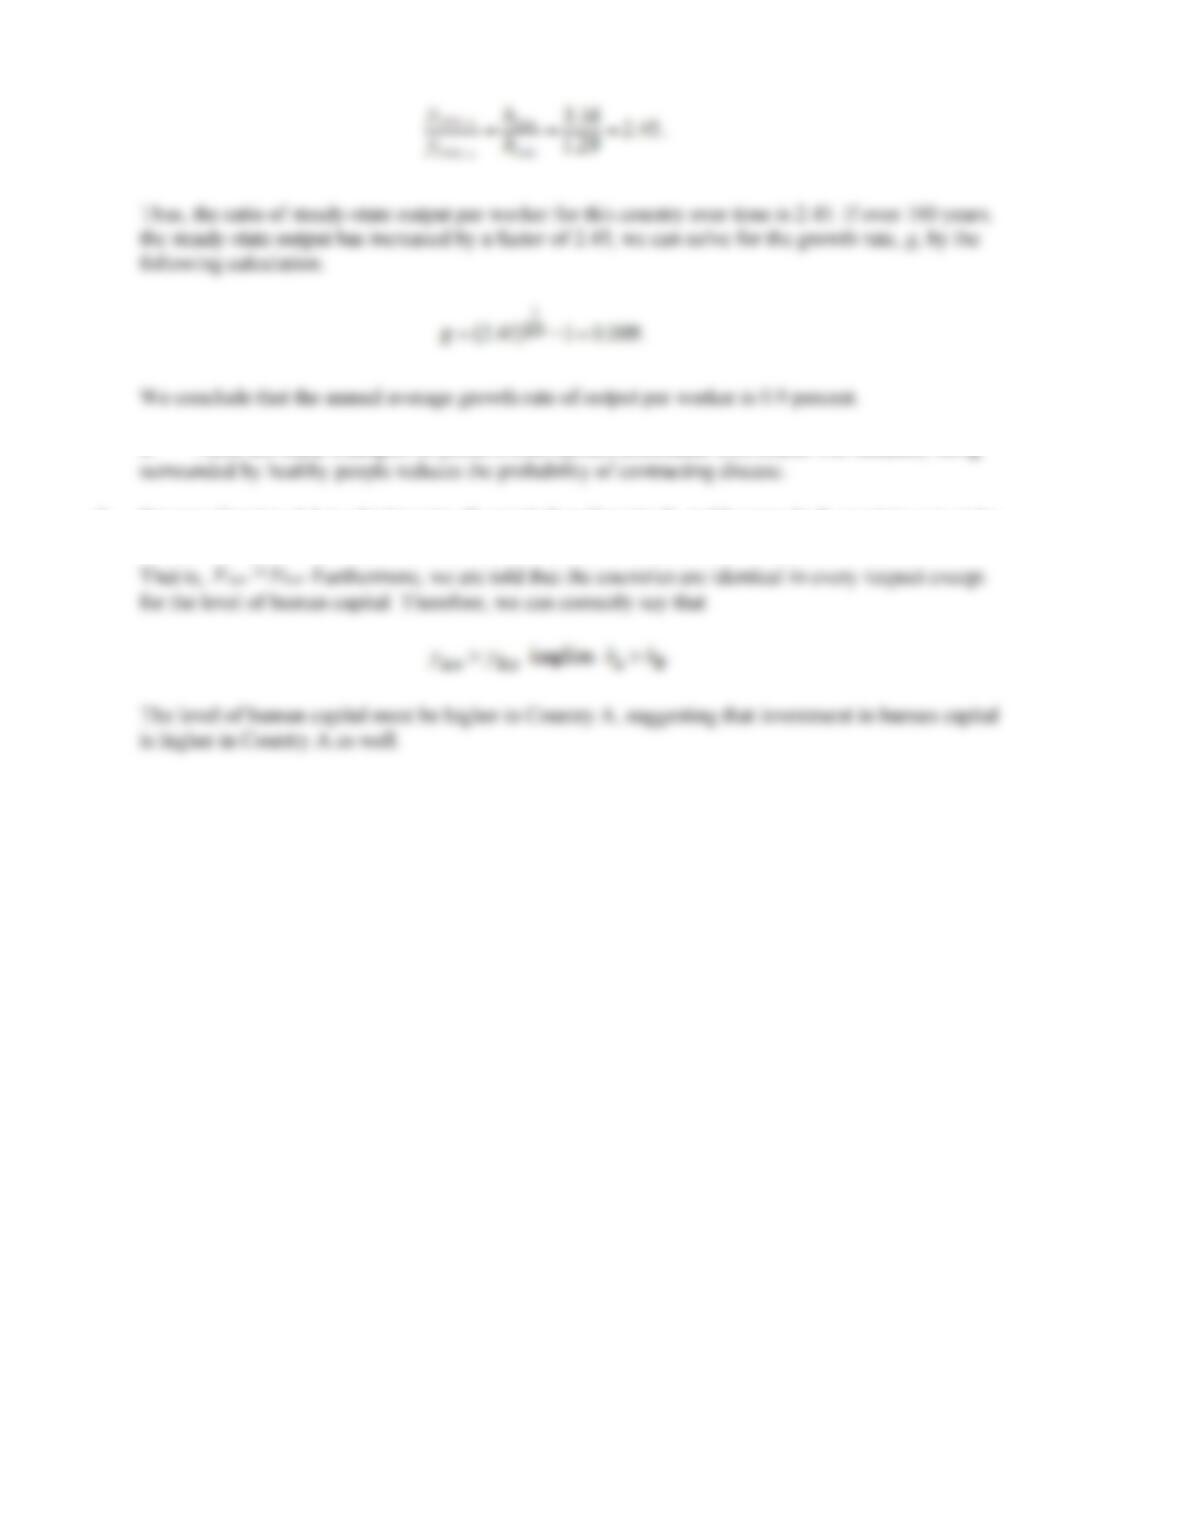
6. The relative return to 10 years of schooling is 2.77, and the relative return to four years of
schooling is 1.65 (from the table above). Denoting
i
h=
2.77 and
j
h=
1.65, we can solve for the
steady-state ratio for two countries identical in every respect expect for education as follows:
7. The relative return to 12 years of schooling is 3.16, and the relative return to two years of
schooling
8. There are many examples of positive externalities associated with health. For instance, being
9. Because Country A has a higher rate of growth than Country B, and because both countries are at the
same level of income, the Solow model predicts that Country A is farther from its steady-state level.