Chapter 6
Tariffs
This chapter begins a series of four chapters on commercial policy. The aim of this chapter is to introduce
the student to these issues by focusing on tariffs as a commercial policy instrument. The chapter begins
with a review of the gains from international trade. It then turns to a partial equilibrium analysis of tariffs.
Included with this analysis is the standard discussion of deadweight costs. This is followed by treatments
of such issues as the export tariff and the optimal tariff (this section may be skipped without loss of
continuity).
We have found that students appreciate seeing real world illustrations of this material. One way to do this
is to bring to class the U.S. tariff code (or the tariff codes of some other countries) and then to look up for
the students current tariff levels on products of their choosing. (The U.S. tariff code is generally available
in government documents sections of libraries.) We include a small sample of U.S. tariffs in Table 6.1. In
addition, we have provided a boxed item on the welfare costs of U.S. tariffs. Other examples of these costs
can be found in the references at the end of this chapter or, from time to time, in the popular press.
One of the gains from free (or freer) trade that is emphasized in this chapter is the greater availability of
goods at lower prices and, in general, the pro-competitive nature of international trade. A study by James
book).
◼ Chapter Outline
Introduction
The Gains from Free Trade
Tariffs: An Introduction
Tariffs: An Economic Analysis
The Gains from Free Trade: One More Time
The Welfare Cost of Tariffs
Tariffs: Some Extensions
Export Tariff
Global Insights 6.1: The Welfare Costs of Tariffs: Estimates from Certain U.S. Industries
Global Insights 6.2: Argentine Export Tariffs
Chapter 6 Tariffs 25
The Optimal Tariff
◼ Suggested Answers for the End-of-Chapter Exercises
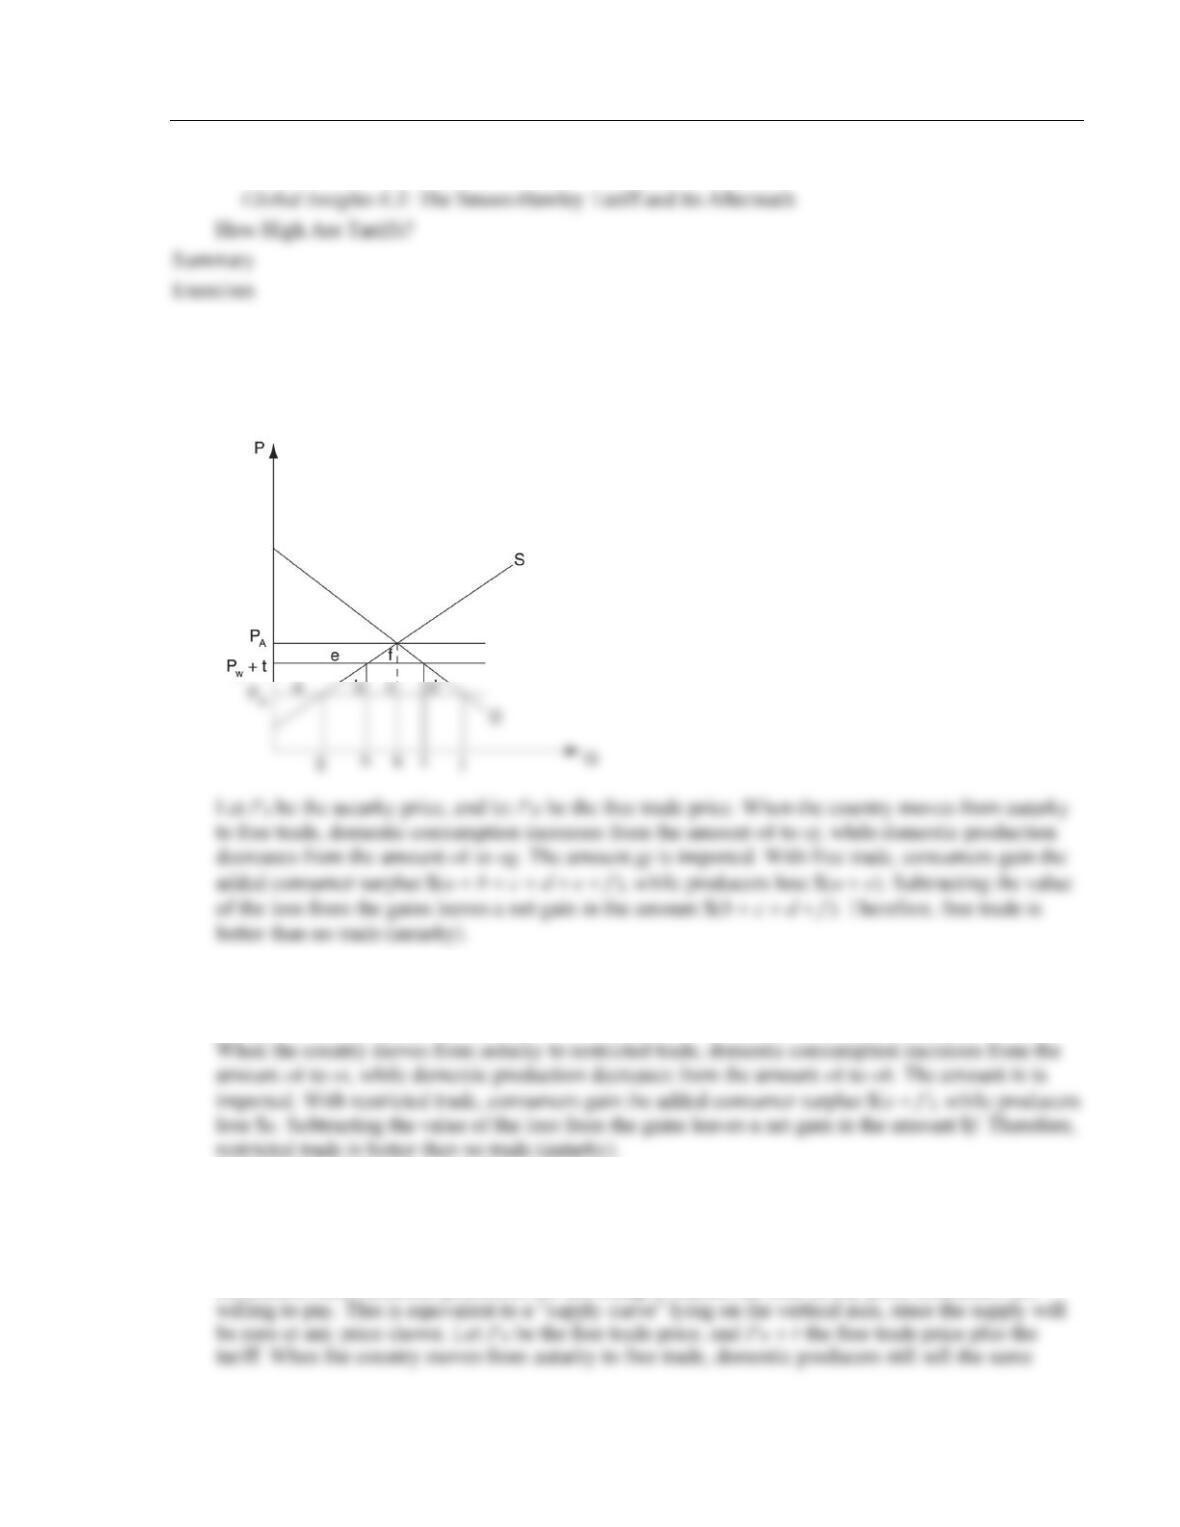
1. Prove the following proposition: Free trade is better than no trade.
2. Prove the following: Some trade (trade with tariffs) is better than no trade.
Using the same graphic illustration as in Exercise 1., let PW + t be the free trade price plus the tariff.
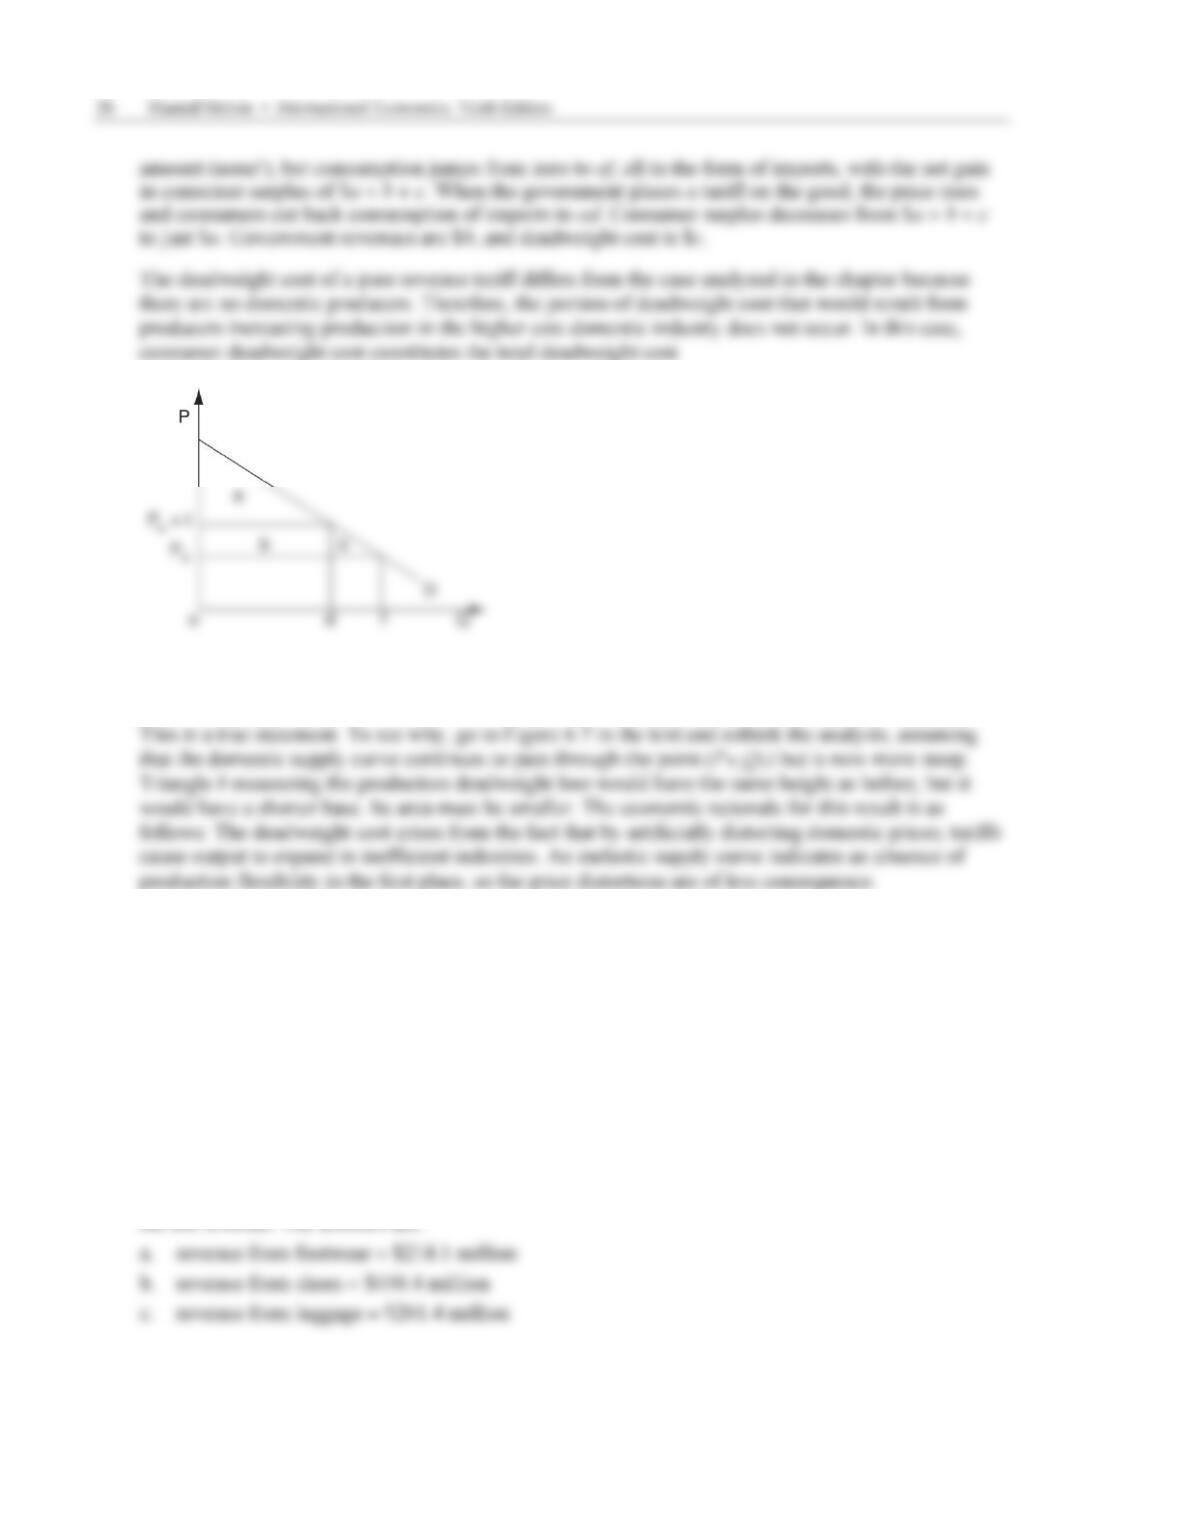
3. Suppose that a country imposes a pure revenue tariff. Diagram the welfare effects of this tariff. How
do these effects differ from the usual deadweight costs analyzed in the chapter?
An example of a pure revenue tariff is shown below. There is no domestic supply curve in this
illustration since domestic producers are unwilling to market the item at any price consumers are
4. The less elastic (i.e., the steeper) is the domestic supply curve, the lower is the production deadweight
cost of any tariff. True or false? Demonstrate and explain.
5. The more elastic (i.e., the flatter) is the domestic demand curve, the lower the consumption
deadweight cost of any tariff. True or false? Demonstrate and explain.
This is a false statement. The analysis parallels that in Question 4.
6. Use the data in the first table of Global Insights 6.2 to calculate U.S. tariff revenues on rubber
footwear, women’s shoes, and luggage.
The answer to this question involves the following identity:
deadweight cost = consumer cost − producer gain − tariff revenue.
The table provides information on everything but the tariff revenue. With the identity, we can figure
7. Given the following information, calculate the cost to consumers, the benefit to producers, the change
in government revenue, and the deadweight costs of a proposed 20 percent tariff on personal
computers.
price of computers (free trade)
$2,000
domestic production (free trade)
100,000
domestic consumption (free trade)
150,000
8. The optimal tariff for a small country is zero. Prove this statement geometrically and then explain
your results.
Refer to the illustration for Question 1. By definition, a “small country” is one that is unable to
9. Prove that the more elastic demand and supply conditions are in a country that is large in world
markets, the greater the ability of that country to impose an optimal tariff.
A country is more likely to gain by imposing a tariff the less the tariff is reflected in the domestic
price and the more it is reflected in the foreign price. To answer the question, let us show that a tariff
10. Prove that the more inelastic demand and supply conditions are in the foreign country, the greater the
ability of a country that is large in world markets to impose an optimal tariff. Use this result to
explain why the OPEC price increases of the 1970s had such devastating effects on the economies of
the West.
The proofs are similar to those in Question 9. For example, return to Figure 6.10 and imagine a
supply curve in country B that supports the original equilibrium but is otherwise more inelastic. The
11. Suppose a country imposed a specific export tariff of $t on each unit of its exports of a certain
product. Depict this situation graphically, and calculate the welfare cost of this policy.
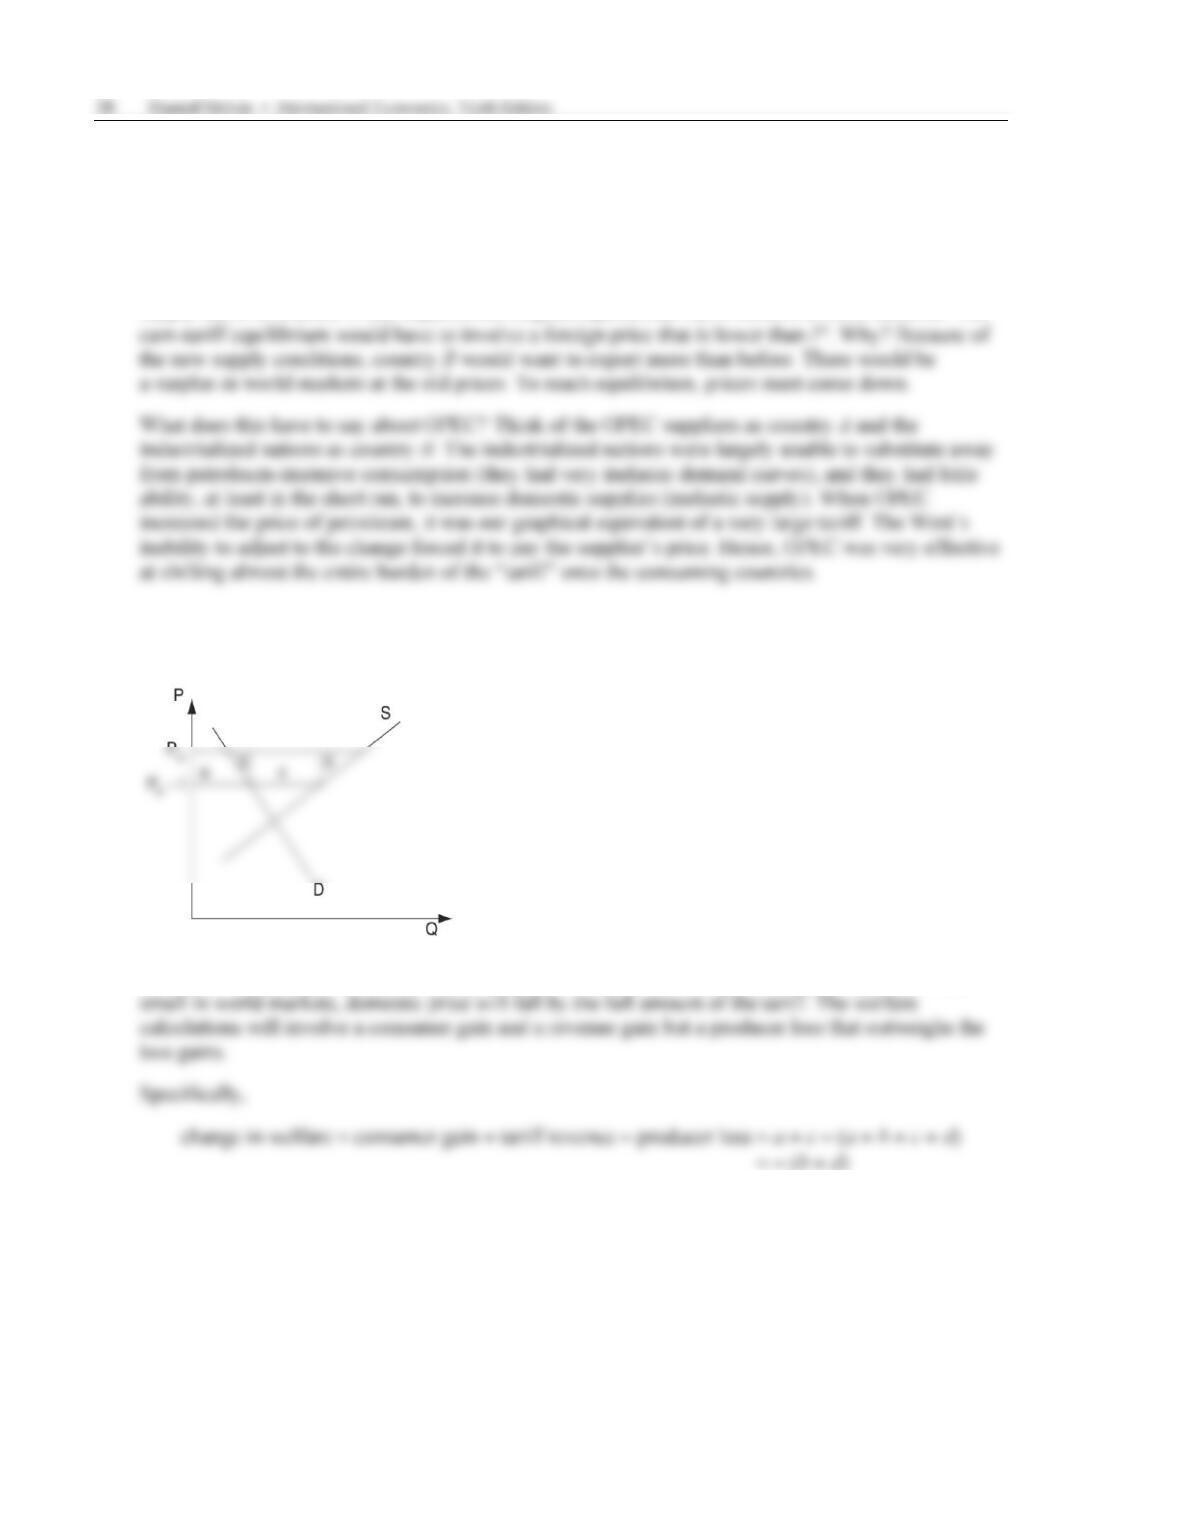
As shown in the diagram above, the export tariff lowers the domestic price. Assuming the country is
12. Use the data in Table 6.7 to compare U.S. protectionist policies with those of Japan. In what sectors
are protection levels relatively equal? Where do they differ? Try to explain these patterns.
13. Suppose that the domestic demand and supply for shoes in a small open economy are given by
P = 100 − 2Q (demand)
P = 4 + Q (supply)
where P denotes price and Q denotes quantity.
a. What are the autarky price of shoes and quantity produced?
b. What are the levels of domestic production, consumption, and imports if the world price is $10?
c. How would your answers in part (b) change if this country were to impose a tariff of $3?
14. Consider the demand and supply curves in Question 13. Suppose that the world price is $50.
a. What will be the levels of production and consumption under free trade?
b. Will the country be an exporter or an importer if the world price is $50? How much will it want
to trade?
c. Suppose that the local government imposes a tax of $5 per unit of the quantity traded of this
product. What will happen to production, consumption, and trade levels of this product?
d. What will be the welfare costs of this policy?