1
2
3
4
5
6
10
11
12
13
14
15
20
16
21
22
23
24
25
26
27
31
28
34
A B C D E F G H I J K L M N O P Q R
06 Chapter Model 12/12/2018
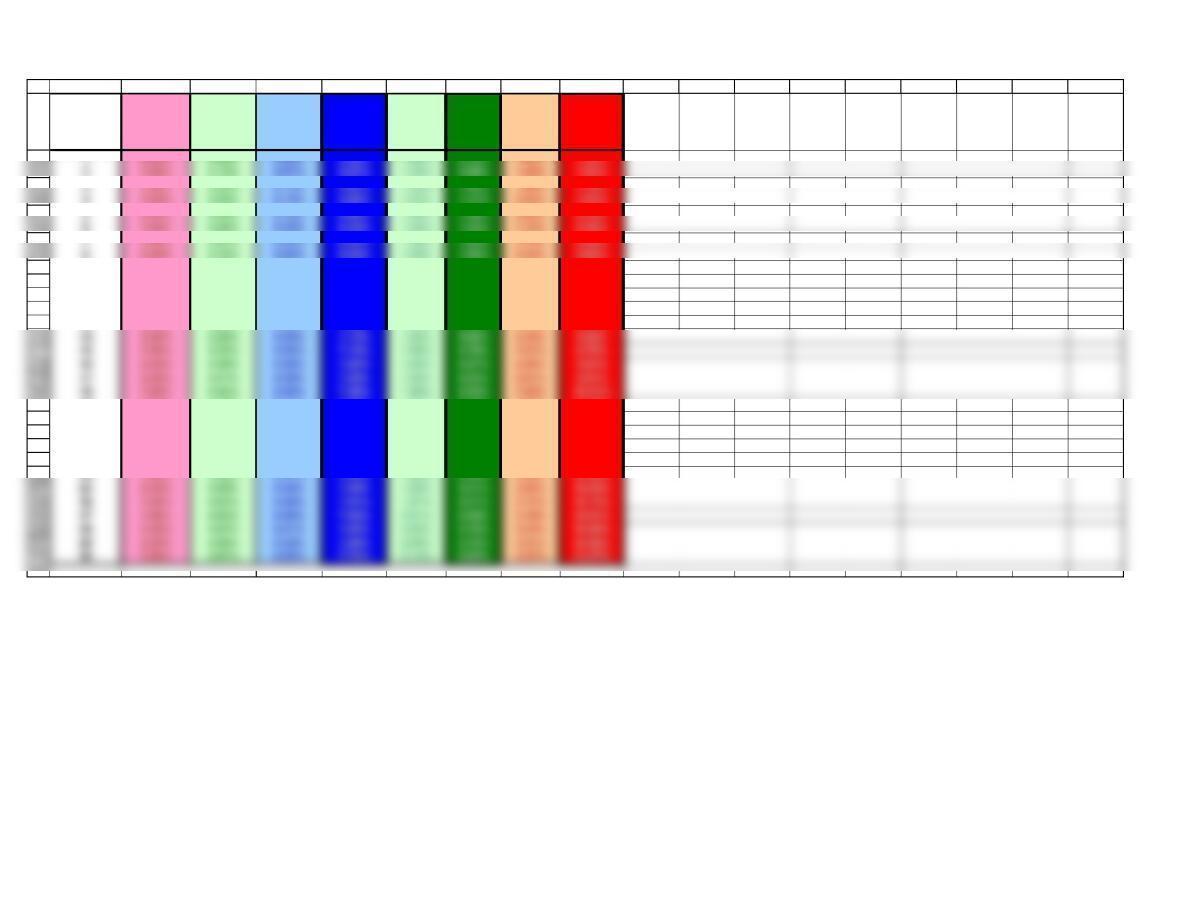
THE DETERMINANTS OF INTEREST RATES (Section 6-3)
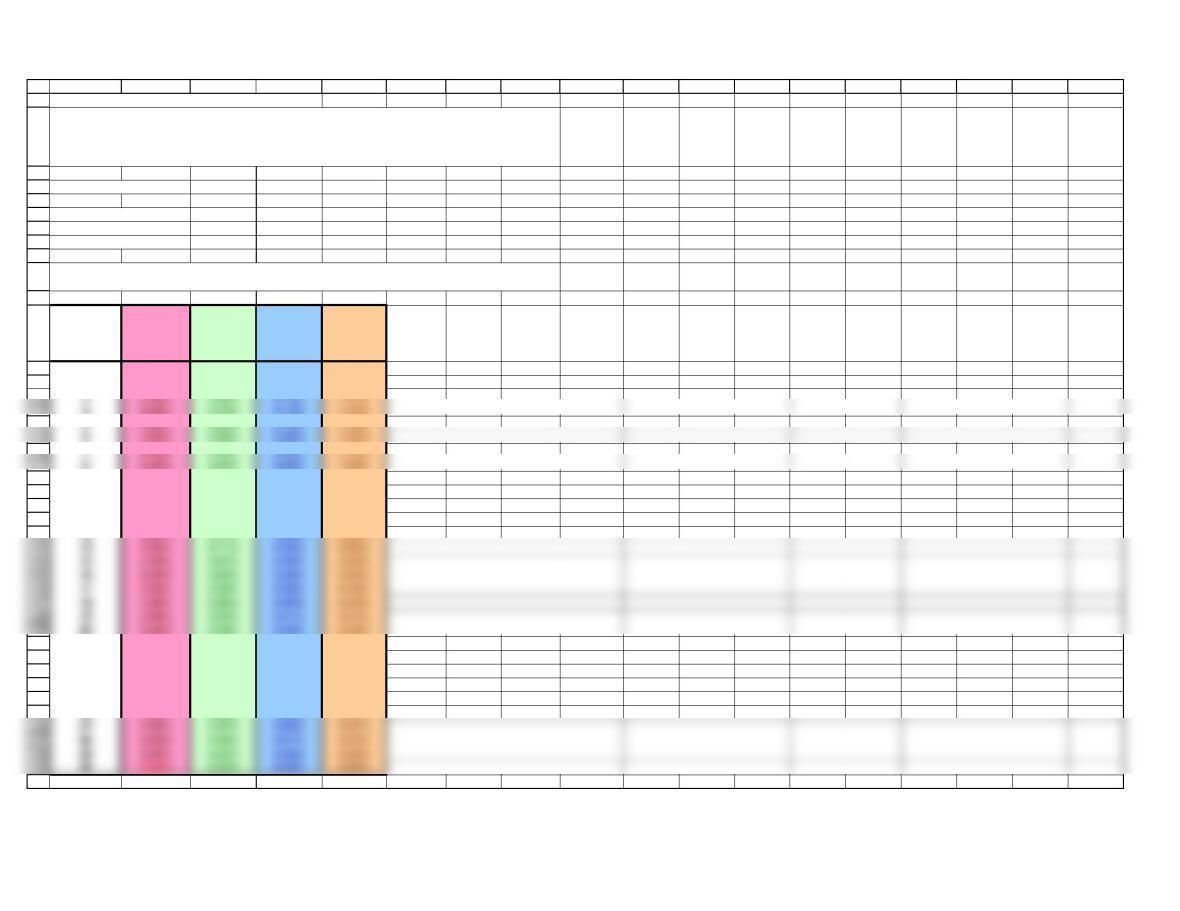
WHICH TYPES OF SECURITIES ARE EXPOSED TO WHAT KIND OF RISK?
Interest Rate Short-Term Long-Term Short-Term Long-Term
Parameter Treasuries Treasuries Corporates Corporates
r* X X X X
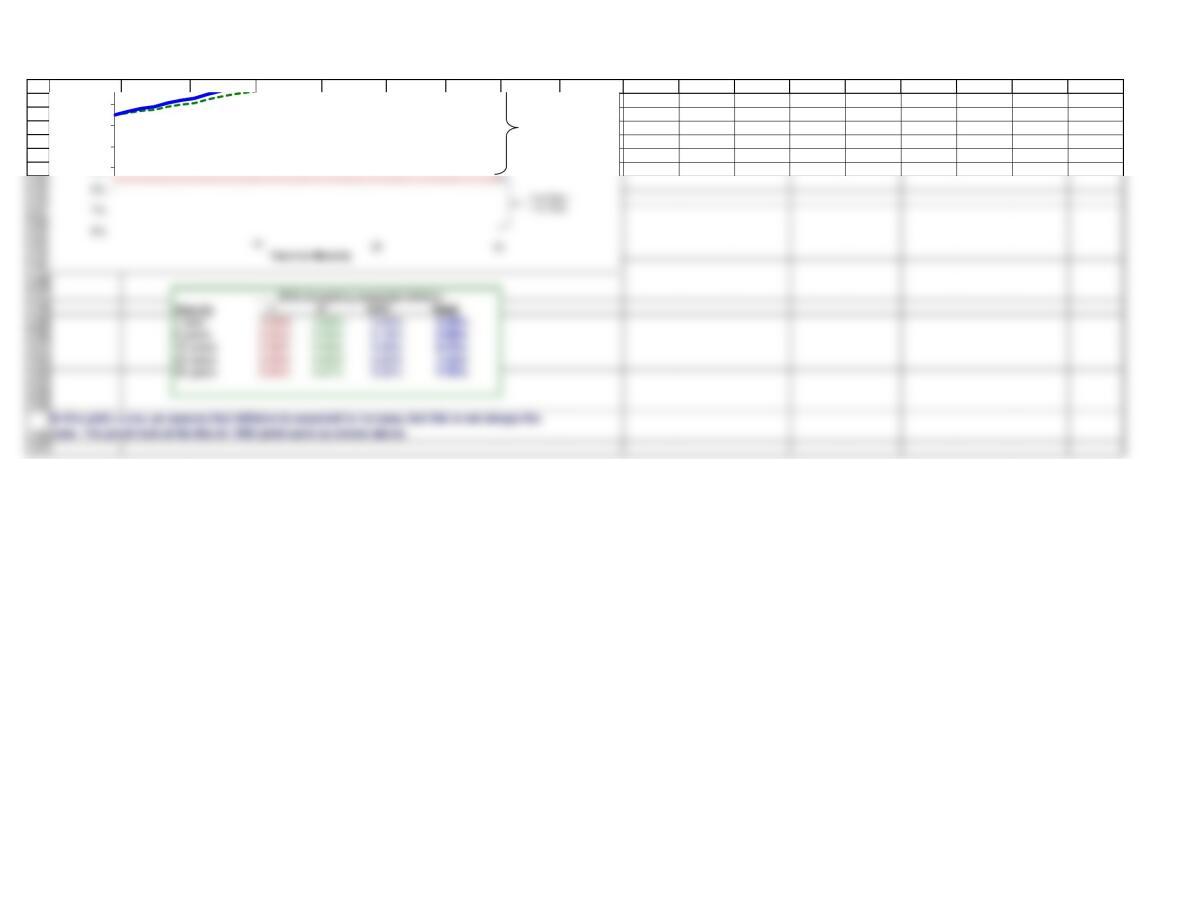
THE TERM STRUCTURE OF INTEREST RATES (Section 6-4)
Maturity (yrs) Mar-80 Feb-00 May-18
114.0% 6.2% 2.3%
Interest rates can easily be observed. All it requires is reading the newspaper, watching
television, or surfing the internet. However, it is not so easy to see the factors that determine
market interest rates, and the extent to which they shape interest rates. Naturally, the
determination of interest rates is a macroeconomic question that has numerous contributing
factors. However, in an effort to simplify the composition of interest rates, we will look at
nominal interest rates being composed of five driving forces, as outlined here:
Here r* represents the real risk-free rate of interest, IP is the inflation premium, DRP is the
default risk premium, LP is the liquidity premium, and MRP is the maturity risk premium.
Together, these five factors determine the nominal interest rate, denoted by r.
The term structure describes the relationship between long-term and short-term interest rates.
Graphically, this relationship can be shown in what is known as the yield curve. In practice, the
yield curve is relatively easy to obtain. It is published daily in a variety of online and print news
sources. However, the “building block approach” to generating a yield curve is more
complicated. We will see that later when we build our own yield curve.
Before jumping into the creation of our own yield curve, let’s look at some historical interest
rate data and draw some historical yield curves. Here is some interest rate data from March
1980, February 2000, and May 2018.
Chapter 6. Interest Rates
35
36
37
38
39
40
41
42
43
44
55
56
57
58
59
60
61
64
65
66
A B C D E F G H I J K L M N O P Q R
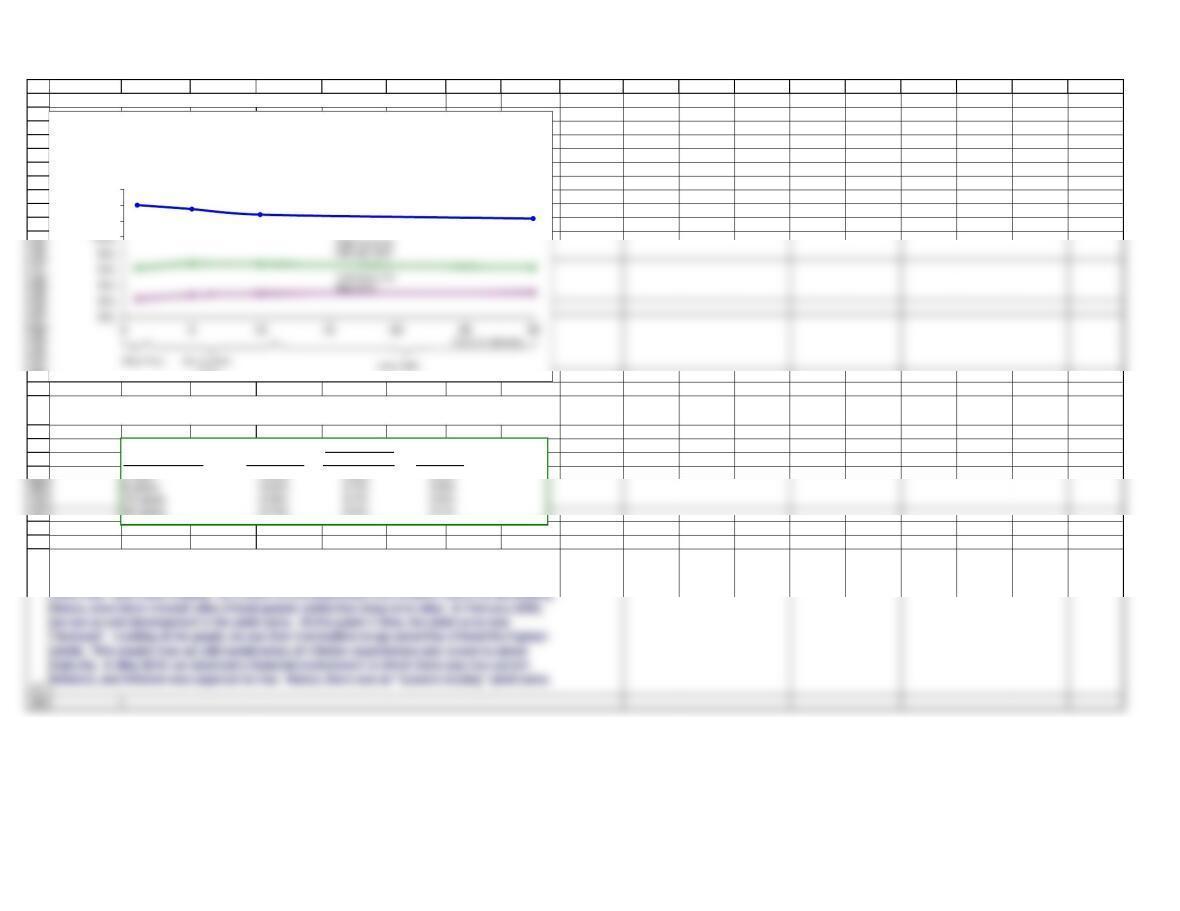
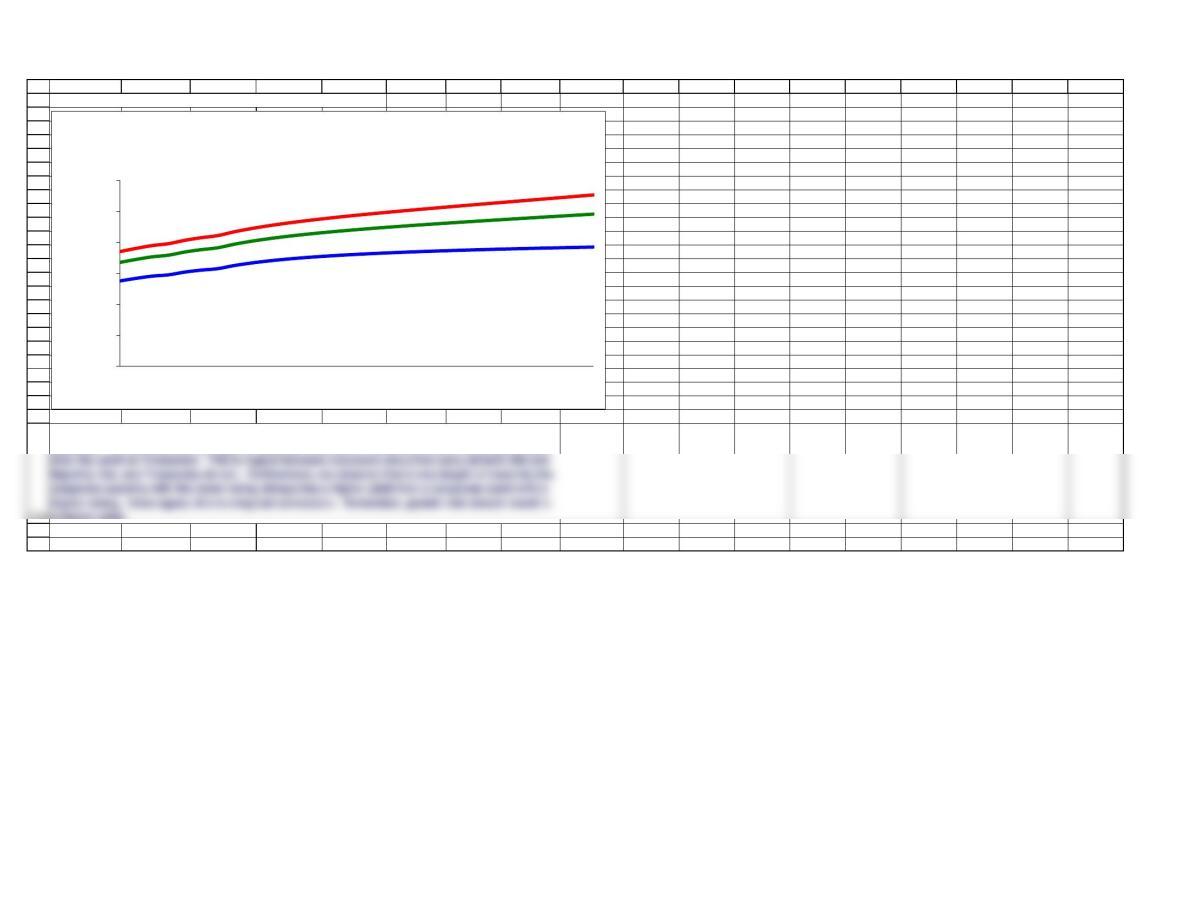
Figure 6.4 U.S. Treasury Bond Interest Rates on Different Dates
Then, we reproduce the data from the graph in this table, to make it look like it might have
appeared in the newspaper.
Looking at these three historical yield curves, we see that they paint very different landscapes of
the financial environment at those times. In the March 1980 yield curve, we see that the yield
12%
14%
16%
Interest Rate
(%)
Term
Yield Curve for
March 1980
Interest Rates
Term to Maturity March 1980 February 2000 May 2018
1 year 14.0% 6.2% 2.3%
30 years 12.3% 6.3% 3.1%
69
70
71
72
76
77
78
79
80
81
82
83
87
88
A B C D E F G H I J K L M N O P Q R
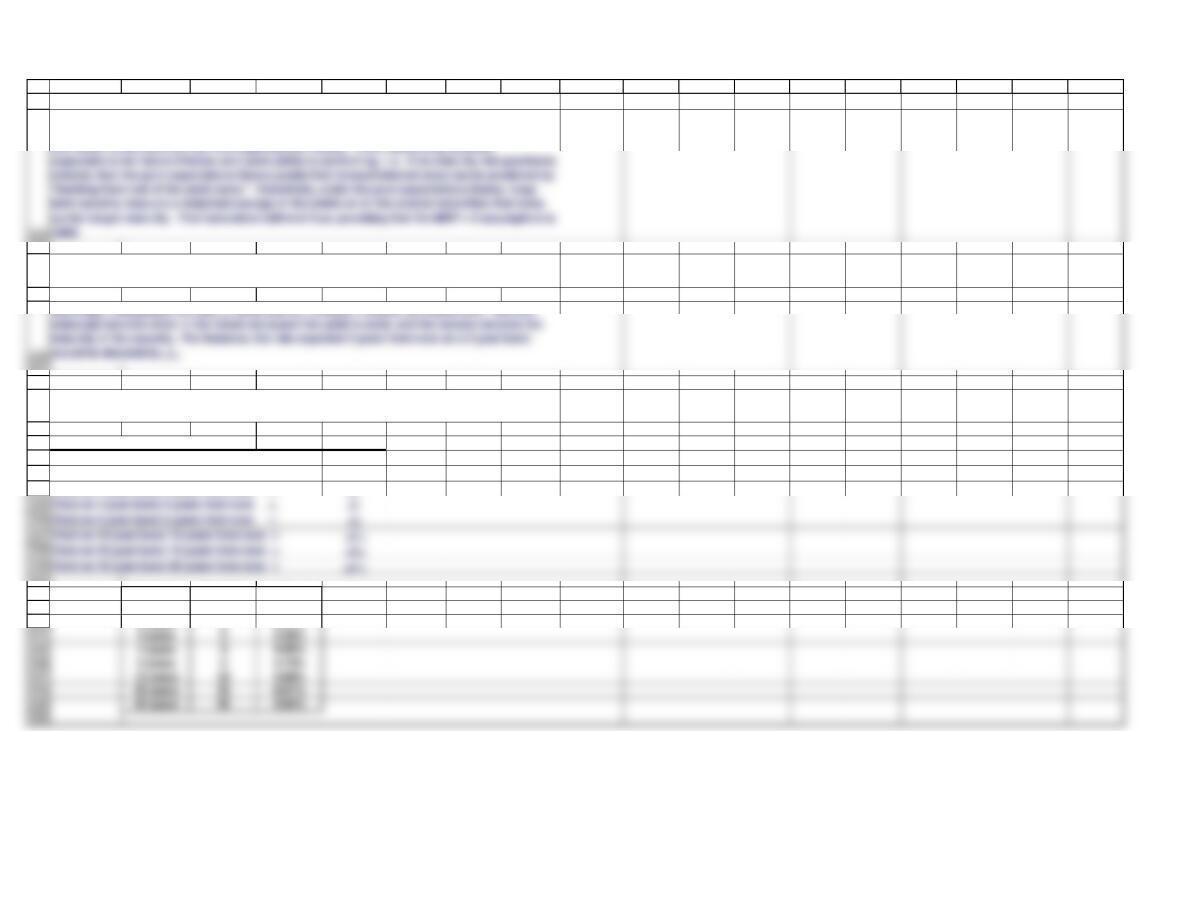
WHAT DETERMINES THE SHAPE OF THE YIELD CURVE? (Section 6-5)
Our Hypothetical Yield Curve
Setting up the yield curve
INPUT DATA
Real risk-free rate 2.50%
Expected inflation of 3% for the next 3years.
Now, we want to put all of these elements together. The second column shows the expected
real risk-free rate of interest (constant at 2.5%). The third column shows the inflation premium
(determined by the stated inflation expectations). The fourth column shows the maturity risk
premium (determined from the formula outlined above).
Now that we have experimented with historical interest rate data, we will move on and create our
own yield curve. This yield curve will be based upon whatever assumptions we feel like setting.
First, we will assume that the real risk-free rate of interest is 2.5%. Furthermore, we expect
inflation to be 3% for the next three years, 4% for the next four years, and 5% thereafter. That
89
90
91
100
101
102
103
104
105
117
118
122
123
124
125
126
127
A B C D E F G H I J K L M N O P Q R
YIELD CURVE INFORMATION
Years to
Maturity
Real Risk-
Free Rate
(r*)
Inflation
Premium
(IP)
Maturity
Risk
Premium
(MRP)
Treasury
Yield
92.50% 3.89% 0.27% 6.66%
10 2.50% 4.00% 0.28% 6.78%
11 2.50% 4.09% 0.30% 6.89%
12 2.50% 4.17% 0.32% 6.98%
IP 4 = ($C$83*$E$83+$C$84*(A95-$E$83))/A95
13 2.50% 4.23% 0.33% 7.06%
14 2.50% 4.29% 0.35% 7.13% Substituting numbers, we get:
26 2.50% 4.62% 0.49% 7.61%
27 2.50% 4.63% 0.50% 7.63% Again substituting numbers, we find that:
This, too, looks like a weighted average of inflation, which is what we wanted to get.
Figure 6.5(a) Illustratvie Treasury Yield Curve CALCULATING MATURITY RISK PREMIUMS
This simply uses the formula previously stated and requires all relative addressing,
so that the formula can be input into the 1-year maturity bond, and AutoFill down.
account previous inflation expectations along with new expectations. Hence, the formula for
the fourth year’s inflation premium would be:
The table above gives us all of the components for our Treasury yield curve. Recall, we have
said that Treasury securities are subject to two kinds of risk premiums, the inflation premium
and the maturity risk premium. Just as we “built” Treasury yields in the table, we can “build” a
yield curve based upon these expectations.
When Inflation Is Expected To Increase
133
134
135
136
137
138
A B C D E F G H I J K L M N O P Q R
3%
4%
5%
6%
7%
Inflation
Premium
158
159
160
161
162
163
164
165
166
167
168
199
169
170
171
178
179
180
181
190
191
192
193
194
195
200
A B C D E F G H I J K L M N O P Q R
What If Inflation Is Expected To Decrease?
Real risk free rate 2.5%
Expected inflation of 5.0% for the next 3years.
Expected inflation of 4.0% for the next 4years.
Expected inflation of 3.0% thereafter.
Years to
Maturity
Real Risk-
Free Rate
(r*)
Inflation
Premium
(IP)
Maturity
Risk
Premium
(MRP)
Treasury
Yield
12.50% 5.00% 0.00% 7.50%
22.50% 4.95% 0.07% 7.52%
92.50% 4.11% 0.27% 6.88%
10 2.50% 4.00% 0.28% 6.78%
11 2.50% 3.91% 0.30% 6.71%
12 2.50% 3.83% 0.32% 6.65%
21 2.50% 3.48% 0.44% 6.41%
22 2.50% 3.45% 0.45% 6.40%
23 2.50% 3.43% 0.46% 6.39%
24 2.50% 3.42% 0.47% 6.39%
25 2.50% 3.40% 0.48% 6.38%
26 2.50% 3.38% 0.49% 6.37%
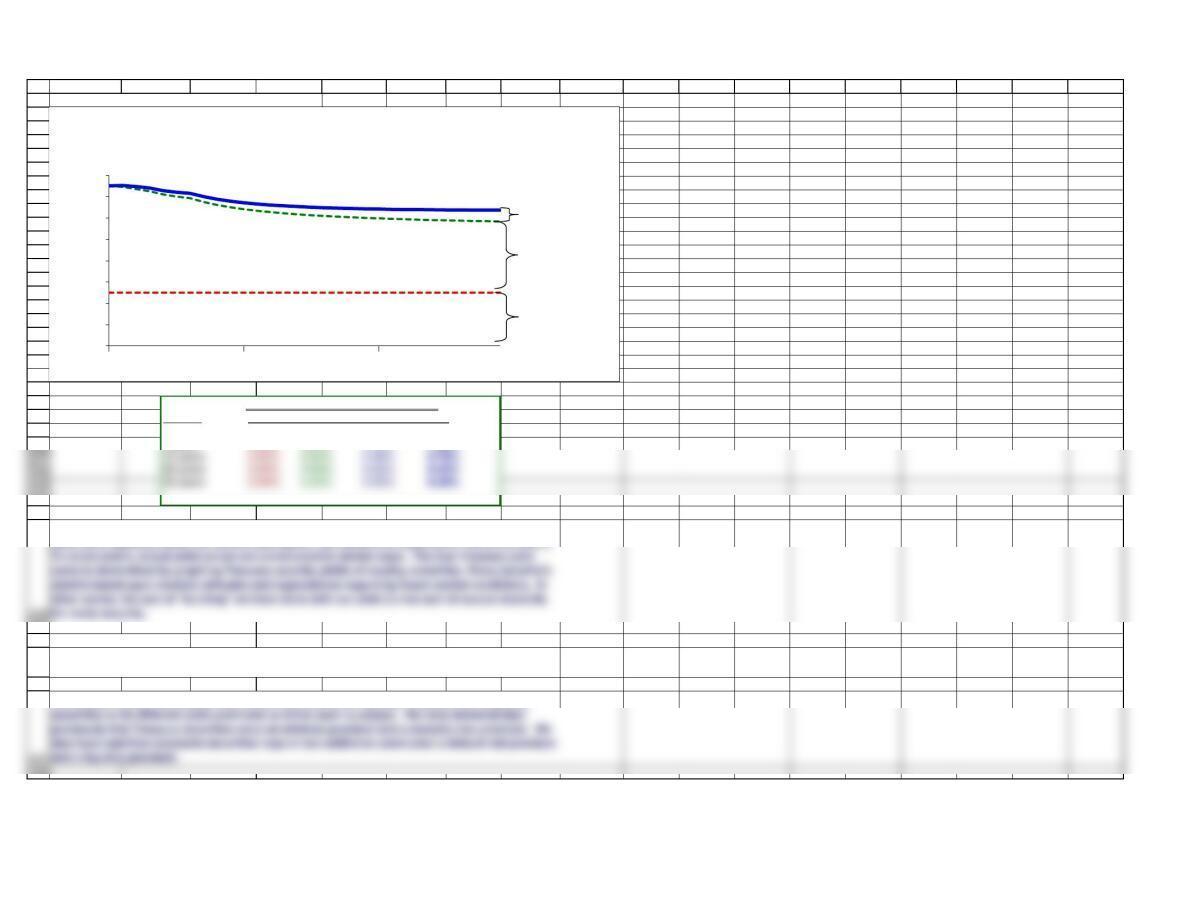
Our methodology for creating this yield curve‘s data will be exactly the same as above. In fact,
we will use all of the same formulas.
Now, we will construct a similar yield curve, except we will change inflation expectations.
Instead of increasing inflation, we will have decreasing inflation. We will assume that: inflation
is expected to be 5% for the next 3 years, 4% for the following 4 years, and 3% thereafter. All of
our other previous assumptions will be upheld.
201
202
203
204
205
206
207
208
209
210
211
212
213
214
215
216
217
218
219
220
221
222
223
224
225
226
230
231
233
234
235
236
238
A B C D E F G H I J K L M N O P Q R
Figure 6.5(b) Illustratvie Treasury Yield Curve
CORPORATE BONDS
To this point, we have constructed two yield curves based upon hypothetical data. The first
yield curve operates under the simple assumption that inflation is expected to rise in the future.
The answer is yes. Remember, that the primary difference between Treasury and corporate
So far, we have addressed the yield curve construction for Treasury securities, but can
corporate bonds also be demonstrated in yield curve fashion?
0%
1%
2%
3%
4%
5%
6%
7%
8%
Interest Rate
(%)
Years to Maturity
When Inflation Is Expected To Decrease
Real Risk-
Free Rate
Inflation
Premium
Maturity Risk
Premium
20
30
10
With decreasing expected inflation
Maturity r* IP MRP Yield
1 year 2.50% 5.00% 0.00% 7.50%
5 years 2.50% 4.60% 0.18% 7.28%
239
240
241
242
243
244
245
246
261
247
249
250
251
252
253
254
255
256
A B C D E F G H I J K L M N O P Q R
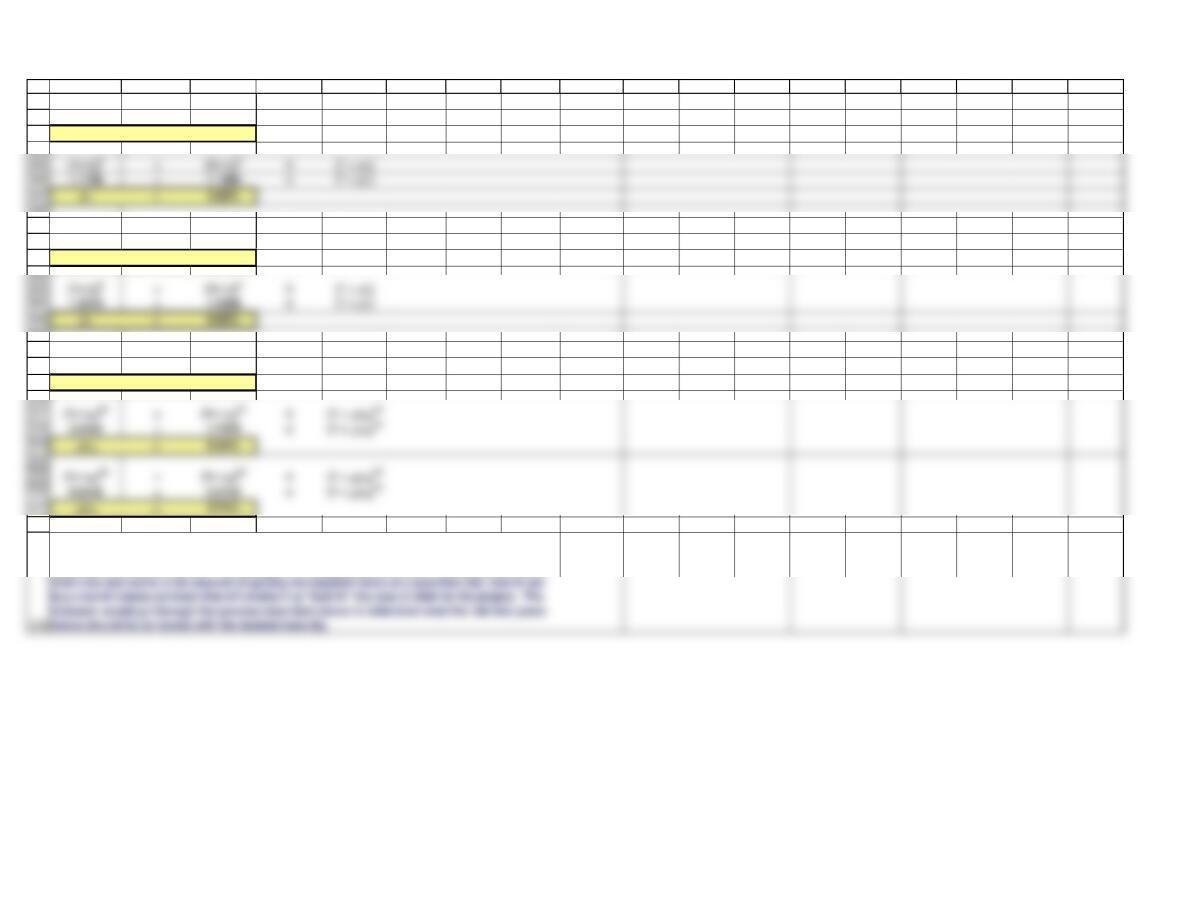
Corporate Bond Yield Spread: DRP + LP
Bond
Rating
Corporate
Spread:
DRP + LP
AAA 1.05%
AA 1.20%
A 1.55%
BBB 1.90%
DRPt + LPt = Corporate spread * (1.02)(t−1)
Real risk-free rate 2.50%
Expected inflation of 3% for the next 3years.
This tells us the average spreads of corporate securities with various bond ratings. We will use
this data as the starting point for our corporate yield curves. Naturally, the first question that
The construction of corporate yields is a process of beginning with the appropriate Treasury
With all of that having been said, we can step forward and try to construct corporate yield
curves.
262
271
272
273
274
275
281
282
283
284
285
293
A B C D E F G H I J K L M N O P Q R
Years to
Maturity
Real Risk-
Free Rate
(r*)
Inflation
Premium
(IP)
Maturity
Risk
Premium
(MRP)
Treasury
Yield
AA-Rated
DRP + LP
AA-Rated
Bond
Yield
BBB-
Rated
DRP + LP
BBB-Rated
Bond Yield
92.50% 3.89% 0.27% 6.66% 1.41% 8.06% 2.23% 8.88%
10 2.50% 4.00% 0.28% 6.78% 1.43% 8.22% 2.27% 9.06%
11 2.50% 4.09% 0.30% 6.89% 1.46% 8.36% 2.32% 9.21%
12 2.50% 4.17% 0.32% 6.98% 1.49% 8.48% 2.36% 9.35%
13 2.50% 4.23% 0.33% 7.06% 1.52% 8.59% 2.41% 9.47%
19 2.50% 4.47% 0.41% 7.39% 1.71% 9.10% 2.71% 10.10%
20 2.50% 4.50% 0.42% 7.42% 1.75% 9.17% 2.77% 10.19%
21 2.50% 4.52% 0.44% 7.46% 1.78% 9.24% 2.82% 10.28%
22 2.50% 4.55% 0.45% 7.49% 1.82% 9.31% 2.88% 10.37%
23 2.50% 4.57% 0.46% 7.52% 1.86% 9.38% 2.94% 10.46%
294
295
296
297
298
299
300
301
302
303
304
305
306
307
308
309
310
311
312
313
314
315
316
317
318
319
320
A B C D E F G H I J K L M N O P Q R
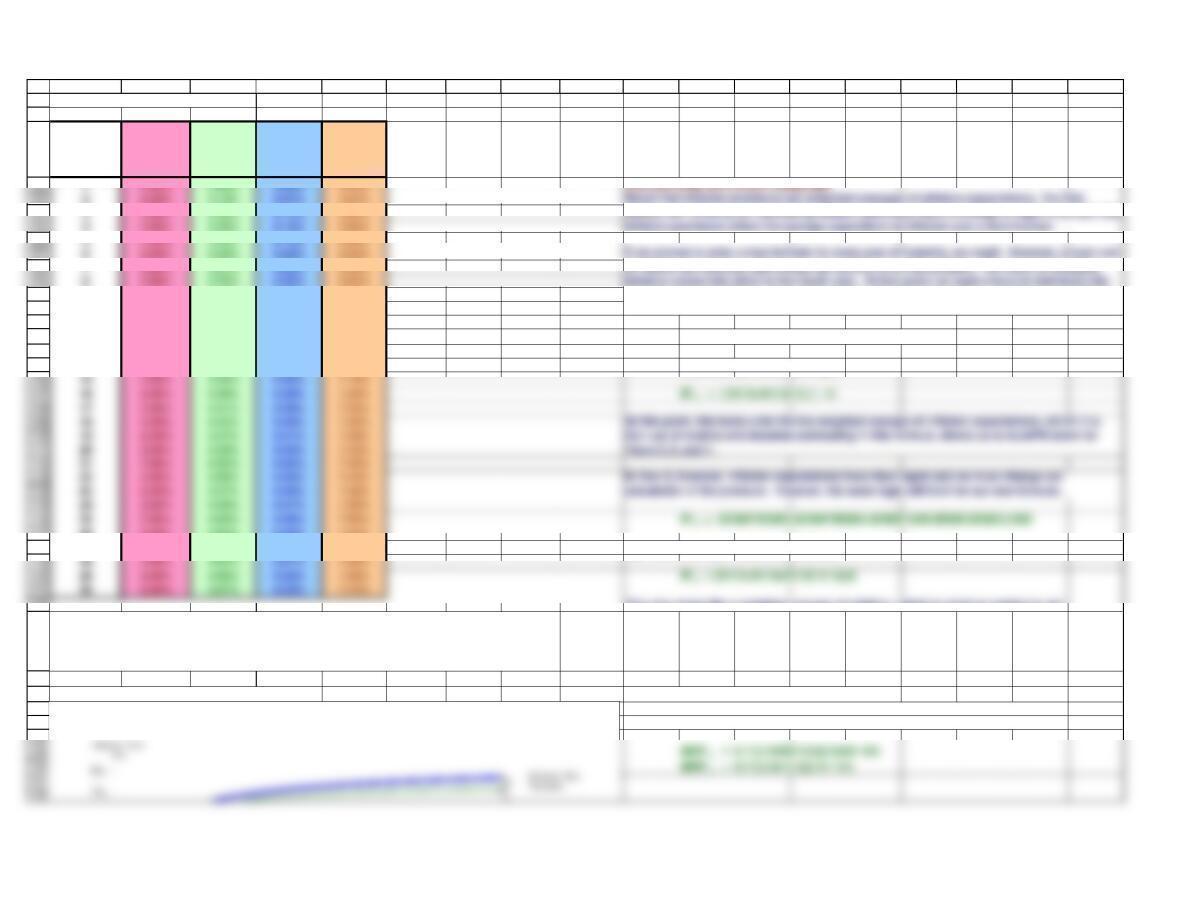
Figure 6.6 Illustrative Corporate and Treasury Yield Curves
Looking at the yield curve we have constructed, we see a relationship that we should have
expected. We see that at any length of maturity, the yield on corporate bonds is always greater
a higher yield.
0%
2%
4%
6%
8%
10%
12%
Interest Rate
(%)
Years to Maturity
10
AA-Rated Bond
Treasury Bond
BBB-Rated Bond
20
30
321
323
324
325
327
328
329
330
331
4r1
5r5
332
333
334
340
341
342
343
A B C D E F G H I J K L M N O P Q R
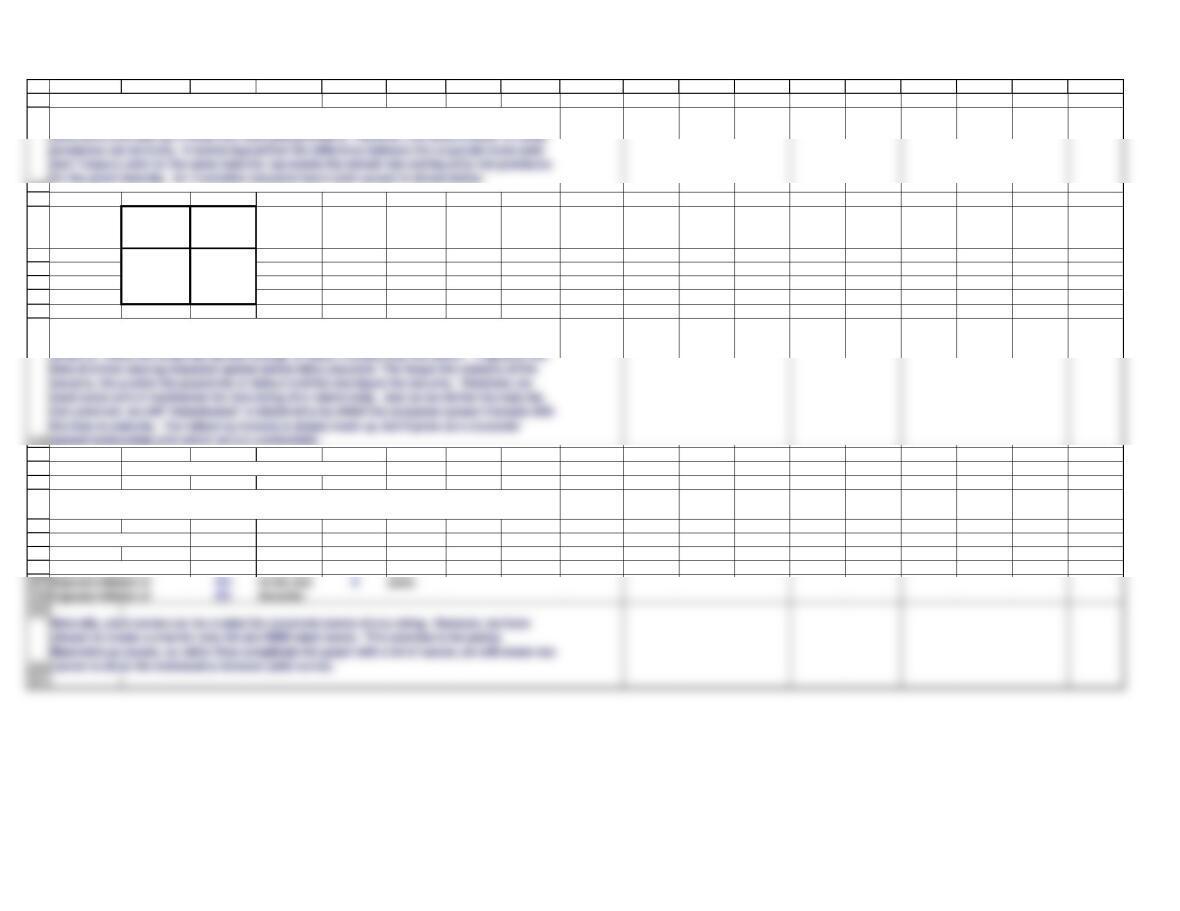
USING THE YIELD CURVE TO ESTIMATE FUTURE INTEREST RATES (Section 6-6)
PROBLEM
Symbol:
Yield on 1-year bond 1 year from now =
1r1
Yield on 1-year bond 2 years from now =
2r1
Yield on 1-year bond 3 years from now =
3r1
Maturity Maturity Yield
1 year 1 5.02%
2 years 2 5.31%
Expected forward rates, in words:
Assuming that expectations theory holds, use the yield information below to back out the
following forward rates from the yield curve.
The shape of the yield curve depends primarily on two key factors: (1) expectations about future
inflation and (2) perceptions about the relative riskiness of securities of different maturities. The
first factor is the basis for the Pure Expectations Theory. If the relationship between
For instance, if the yield on a 1-year bond is 5% and that on a 2-year bond is 5.5%, the rate on a
1-year bond one year from now should be 6%, because (1.055)2 = (1.05)(1.06).
(1+ r5)5 = (1+ r4)4x (1 + 4r1)
4r1= 6.05%
(1+ r20)20 = (1+ r10)10 x (1 + 10r10)10
(1+ r30)30 = (1+ r20)20 x (1 + 20r10)10
351
352
353
354
358
359
360
361
366
367
368
369
378
A B C D E F G H I J K L M N O P Q R
(1+ r2)2 = (1 + r1) x (1 + 1r1)
1.1090 = 1.0502 x
(1 + 1r1)
1r1= 5.60%
(1+ r4)4 = (1+ r3)3x (1 + 3r1)
1.2459 = 1.1736 x
(1 + 3r1)
3r1= 6.16%
(1+ r10)10 = (1+ r5)5x (1 + 5r5)5
1.7375 = 1.3213 x
(1 + 5r5)5
5r5= 5.63%
The data used to construct the yield curve are readily available, and forward rates can be
calculated as shown above. Bond traders and corporate borrowers can use this information for
hedging in the futures market. For example, if a company plans to build a new plant two years
(1+ r3)3 = (1+ r2)2x (1 + 2r1)
2r1= 5.82%
1
2
3
4
5
6
A B C D E F G H
SECTION 6-2 12/12/2018
SOLUTIONS TO SELF-TEST QUESTIONS
Inflation 2.0%
5a. If inflation during the last 12 months was 2% and the interest rate during that period was 5%,
what was the real rate of interest?
Inflation 4.0%
1
2
3
4
5
6
A B C D E F G H
SECTION 6-3 12/12/2018
SOLUTIONS TO SELF-TEST QUESTIONS
r* 2.0%
7a. Assume that the real risk-free rate is r* = 2% and the average expected inflation rate is 3%
for each future year. The DRP and LP for Bond X are each 1%, and the applicable MRP is 2%.
What is Bond X’s interest rate?
1
2
3
11
12
13
A B C D E F G H
SECTION 6-6 12/12/2018
SOLUTIONS TO SELF-TEST QUESTIONS
5a. Assume the interest rate on a 1-year T-bond is currently 7% and the rate on a 2-year bond
5b. What would the forecast be if the maturity risk premium on the 2-year bond was 0.5%
versus zero for the 1-year bond?