Solution 12/7/2012
Chapter: 6
Problem: 15
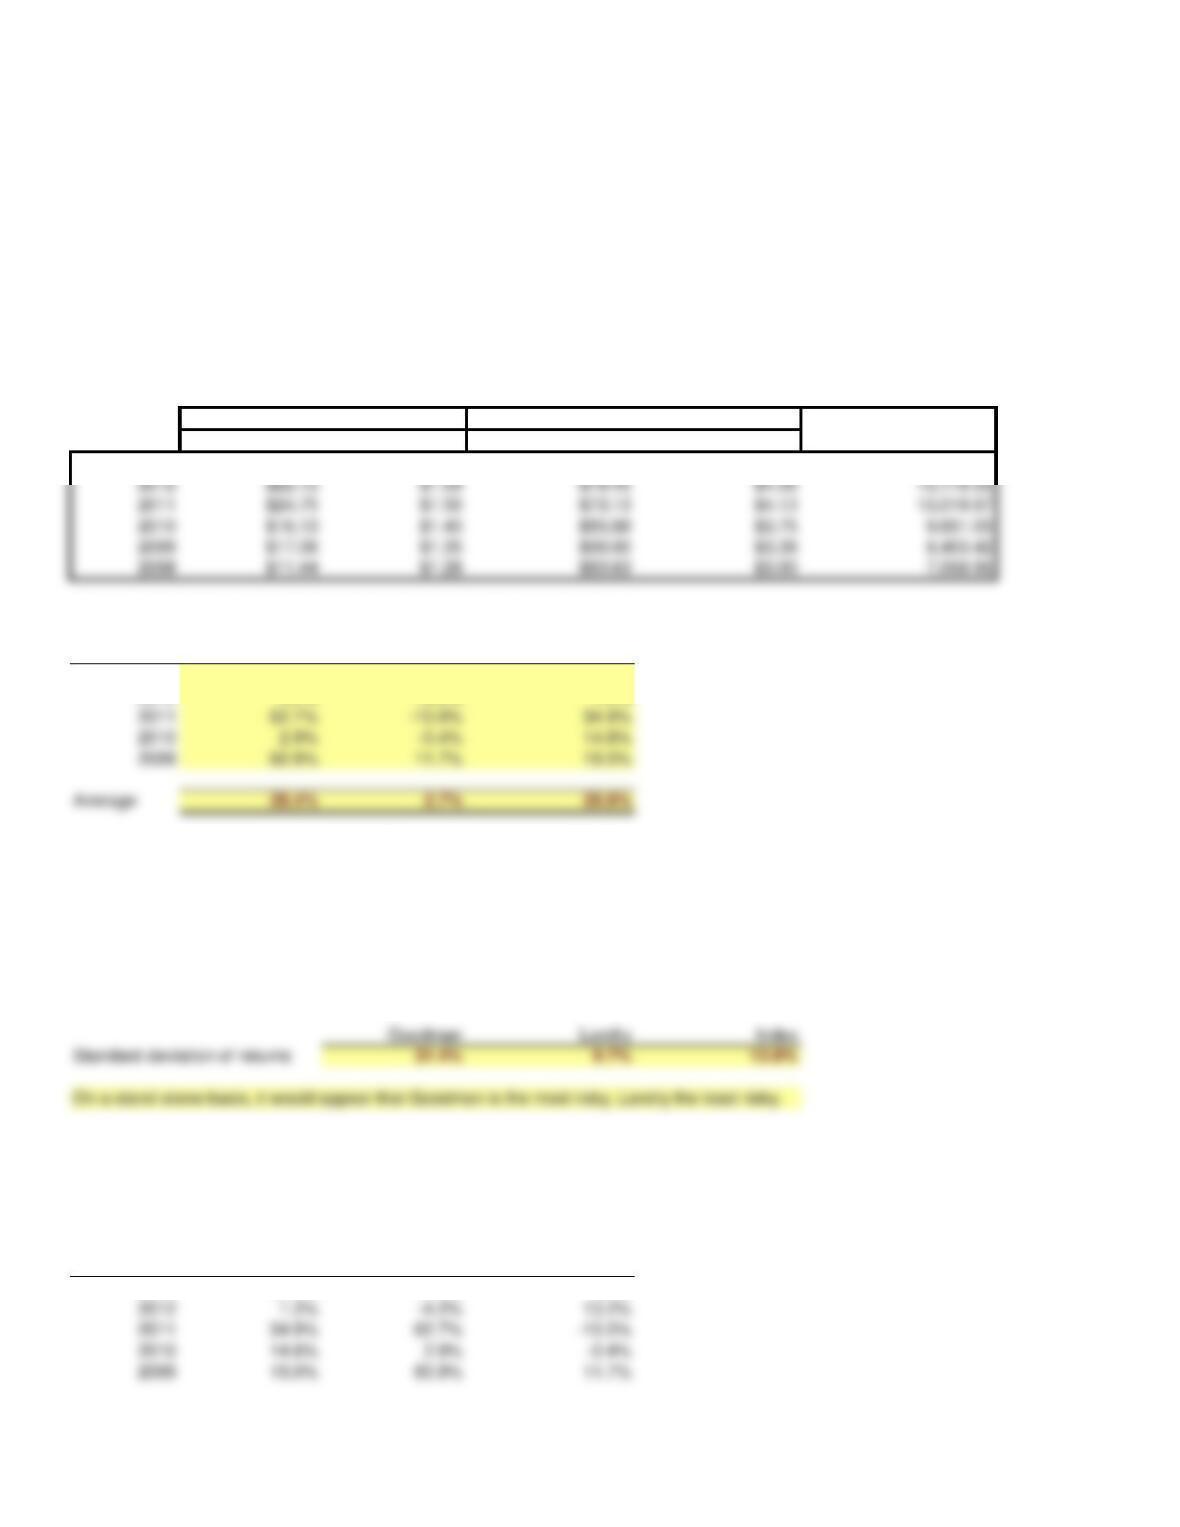
Data as given in the problem are shown below:
Market Index
Year Stock Price Dividend Stock Price Dividend Includes Divs.
2013 $25.88 $1.73 $73.13 $4.50 17,495.97
We now calculate the rates of return for the two companies and the index:
Goodman Landry Index
2013 24.8% -1.0% 32.8%
2012 -4.2% 13.2% 1.2%
Use the function wizard to calculate the standard deviations.
Year Index Goodman Landry
2013 32.8% 24.8% -1.0%
b. Calculate the standard deviation of the returns for Goodman, Landry, and the Market Index. (Hint: Use the
sample standard deviation formula given in the chapter, which corresponds to the STDEV function in Excel.)
Landry Incorporated
Goodman Industries
a. Use the data given to calculate annual returns for Goodman, Landry, and the Market Index, and then calculate
average returns over the five-year period. (Hint: Remember, returns are calculated by subtracting the beginning
price from the ending price to get the capital gain or loss, adding the dividend to the capital gain or loss, and
dividing the result by the beginning price. Assume that dividends are already included in the index. Also, you
cannot calculate the rate of return for 2008 because you do not have 2007 data.)
Note: To get the average, you could get the column sum and divide by 5, but you could also use the function wizard, fx.
Click fx, then statistical, then Average, and then use the mouse to select the proper range. Do this for Goodman and then
copy the cell for the other items.
c. Construct a scatter diagram graph that shows Goodman’s and Landry’ returns on the vertical axis and the
Market Index’s returns on the horizontal axis.
It is easiest to make scatter diagrams with a data set that has the X-axis variable in the left
column, so we reformat the returns data calculated above and show it just below.
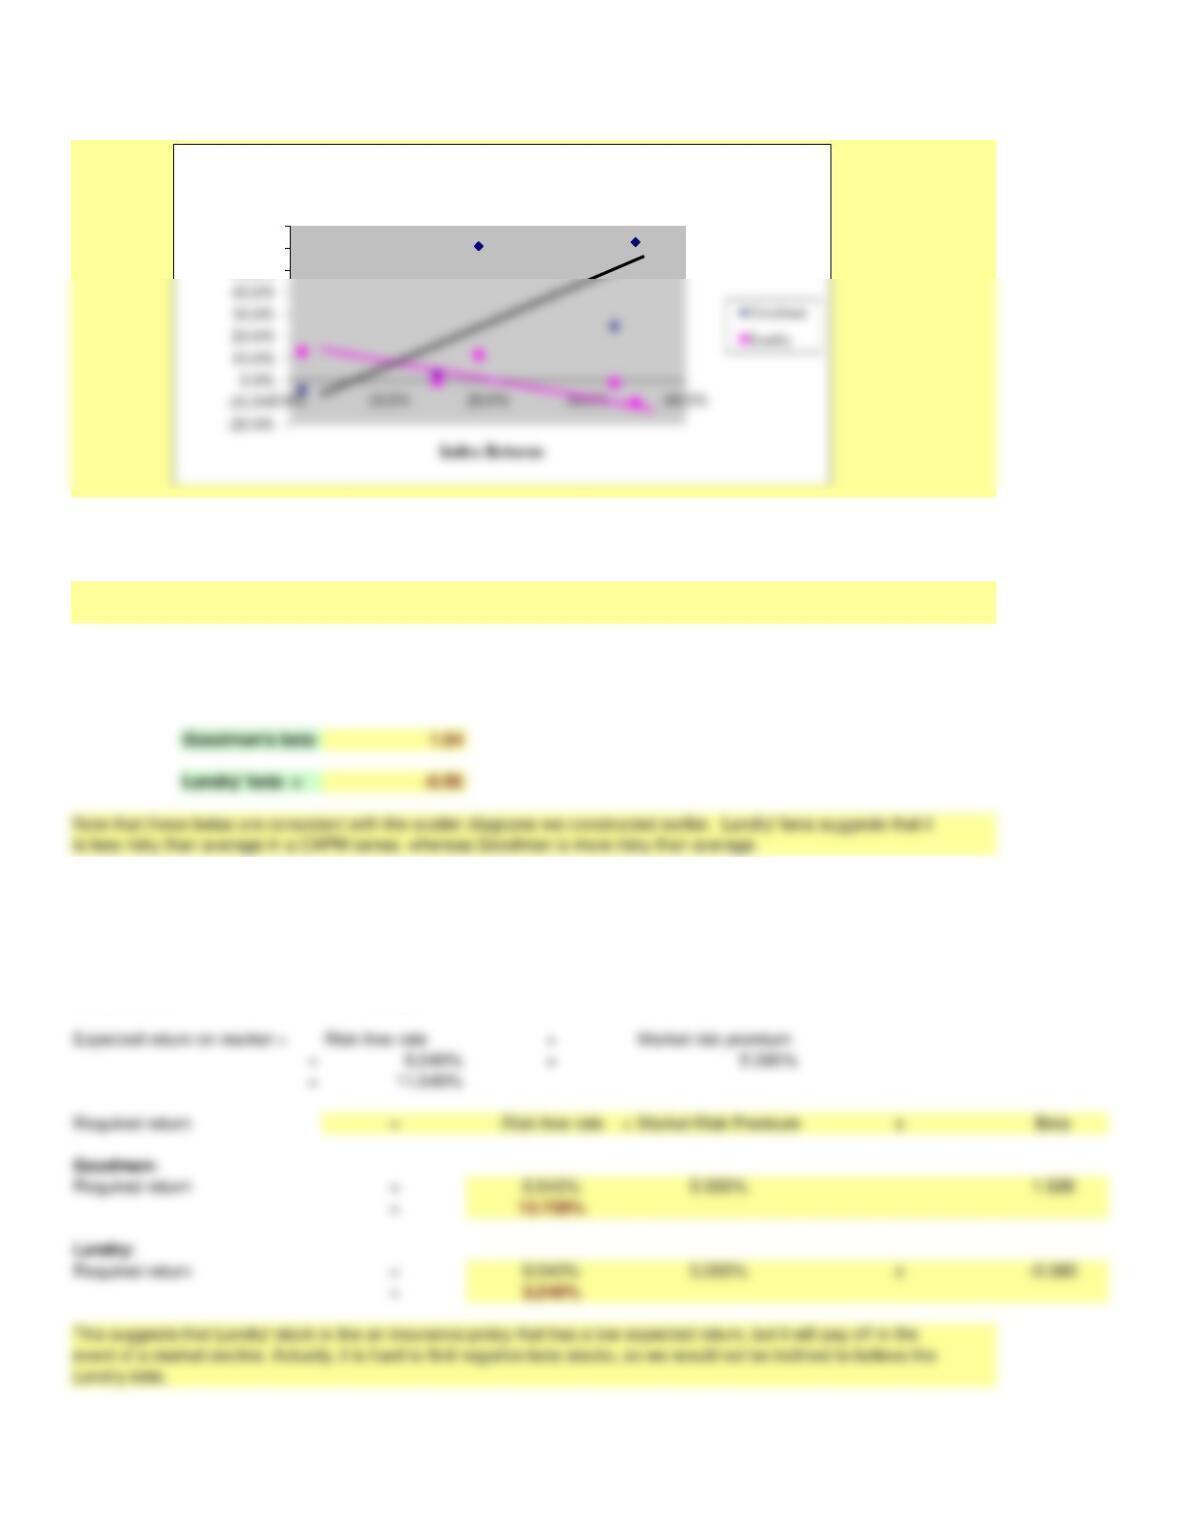
It is clear that Goodman moves with the market and Landry moves counter to the market. So, Goodman has a positive
beta and Landry a negative one.
Market risk premium (RPM) = 5.000%
Risk-free rate = 6.040%
To make the graph, we first selected the range with the returns and the column heads, then clicked the chart wizard, then
choose the scatter diagram without connected lines. That gave us the data points. We then used the drawing toolbar to
make free-hand (“by eye”) regression lines, and changed the lines color and weights to match the dots.
d. Estimate Goodman’s and Landry’s betas as the slopes of regression lines with stock returns on the vertical
axis (y-axis) and market return on the horizontal axis (x-axis). (Hint: use Excel’s SLOPE function.) Are these
betas consistent with your graph?
e. The risk-free rate on long-term Treasury bonds is 6.04%. Assume that the market risk premium is 5%. What is the expected
return on the market? Now use the SML equation to calculate the two companies’ required returns.
50.0%
60.0%
70.0%
Stocks’ Returns
Stock Returns Vs. Index
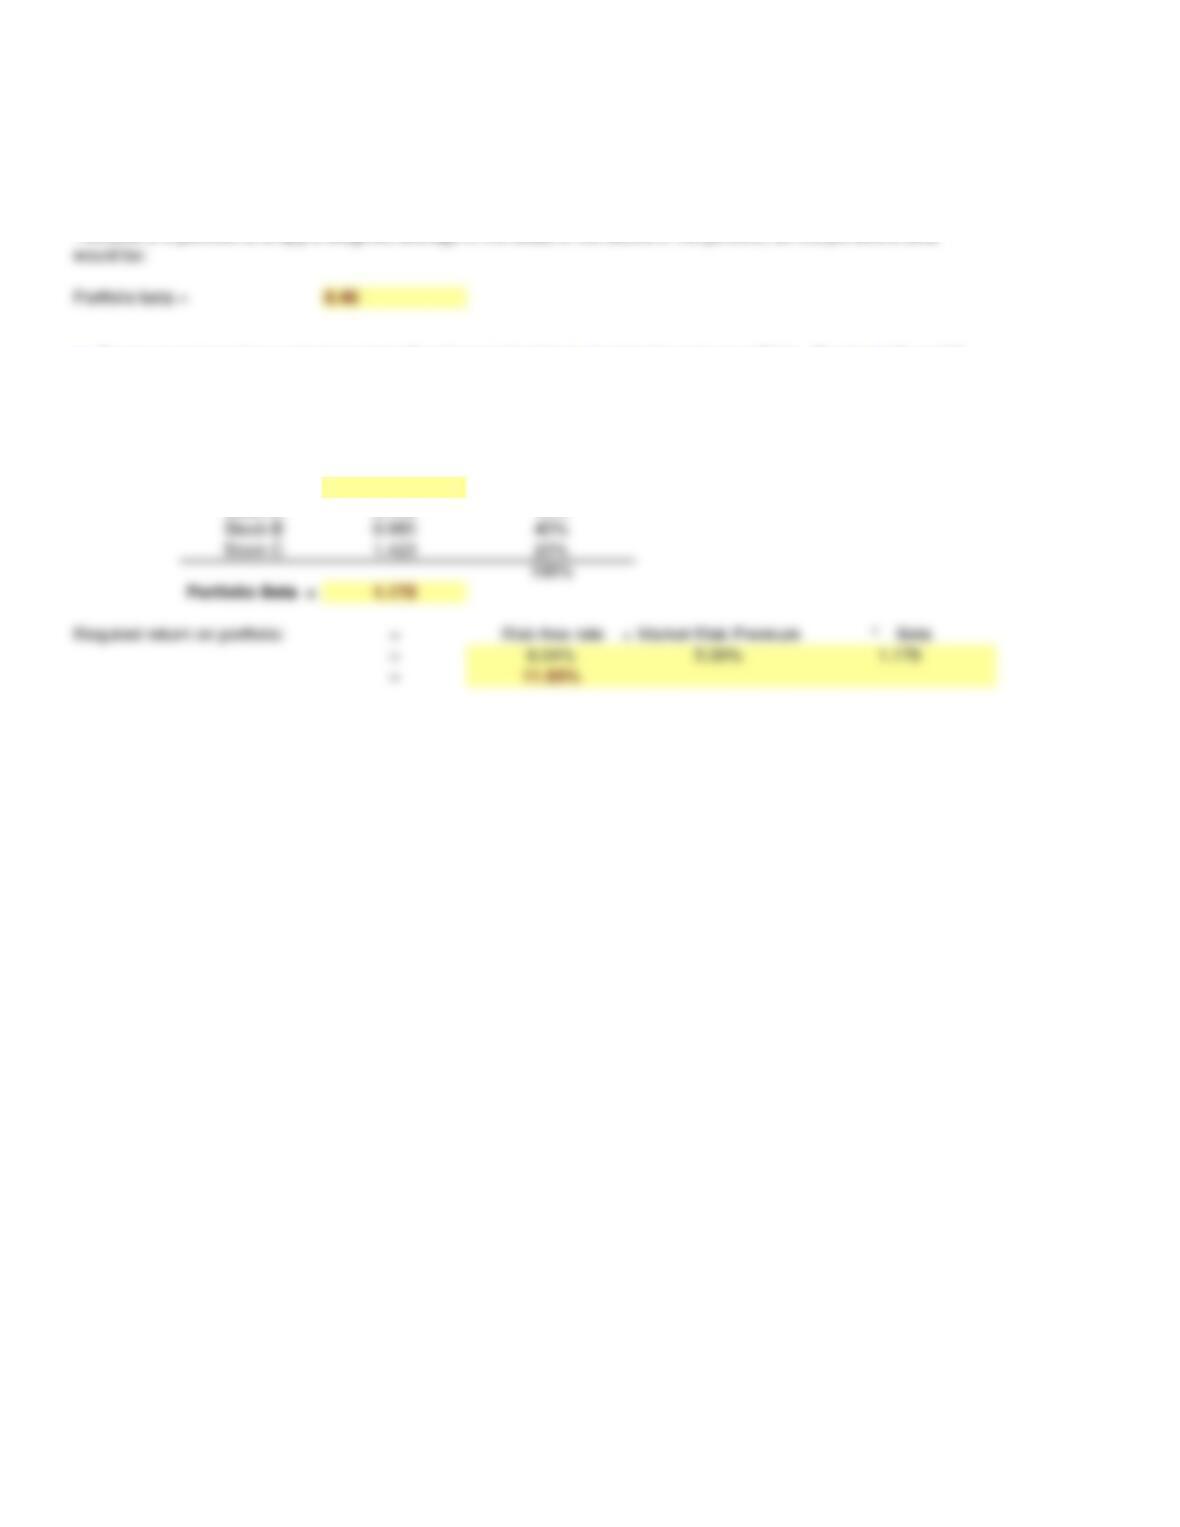
The beta of a portfolio is simply a weighted average of the betas of the stocks in the portfolio, so this portfolio’s beta
Beta Portfolio Weight
Goodman 1.538 25%
Stock A 0.769 15%
f. If you formed a portfolio that consisted of 50% Goodman stock and 50% Landry stock, what would be its beta
and its required return?
g. Suppose an investor wants to include Goodman Industries’ stock in his or her portfolio. Stocks A, B, and C
are currently in the portfolio, and their betas are 0.769, 0.985, and 1.423, respectively. Calculate the new
portfolio’s required return if it consists of 25% of Goodman, 15% of Stock A, 40% of Stock B, and 20% of Stock C.