06 Case model 12/9/2018
PART E
INPUT DATA
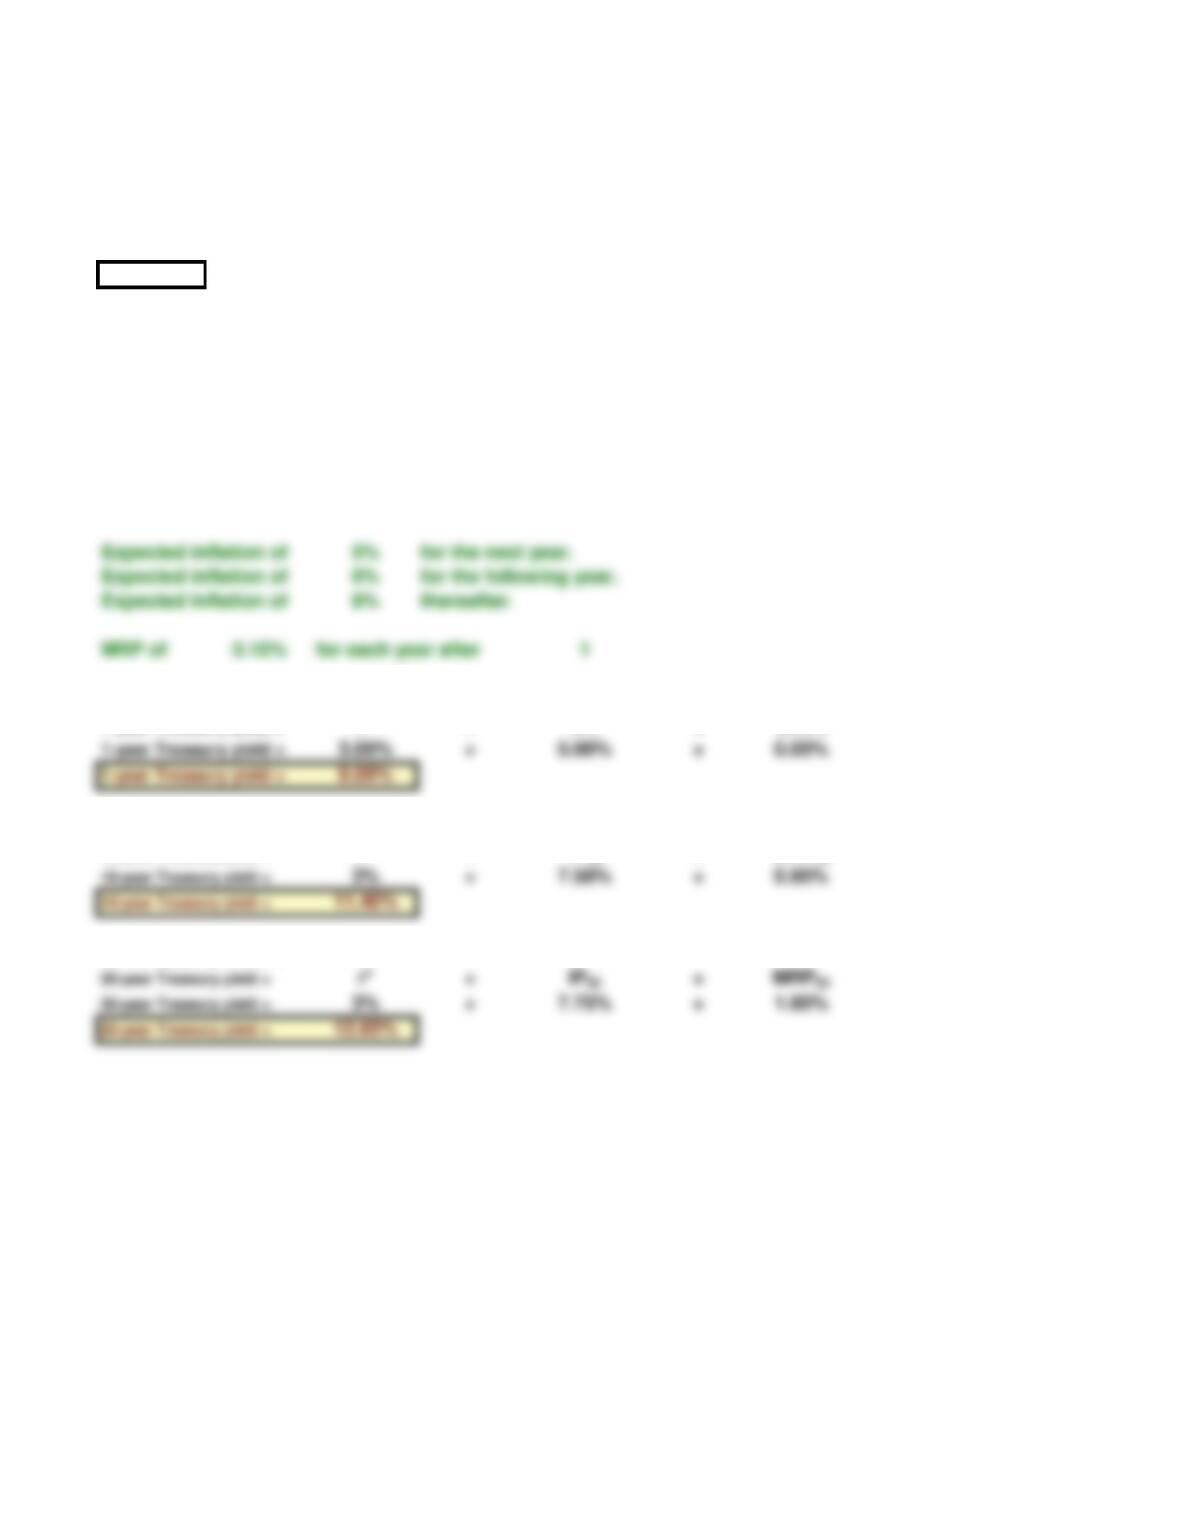
Real risk-free rate 3%
Maturity (in years) = 1
1-year Treasury yield = r* +
IP1+ MRP1
Maturity (in years) = 10
10-year Treasury yield = r* +
IP10 + MRP10
IP20 + MRP20
Maturity (in years) = 20
Chapter 6. Interest Rates
9/12/2022 17:14
This spreadsheet model is designed to be used in conjunction with the chapter’s integrated case and the
related PowerPoint slide presentation.
Suppose most investors expect the inflation rate to be 5% next year, 6% the following year, and 8%
thereafter. The real risk-free rate is 3%. The maturity risk premium is zero for bonds that mature in 1 year
or less and 0.1% for 2-year bonds; then the MRP increases by 0.1% per year thereafter for 20 years, after
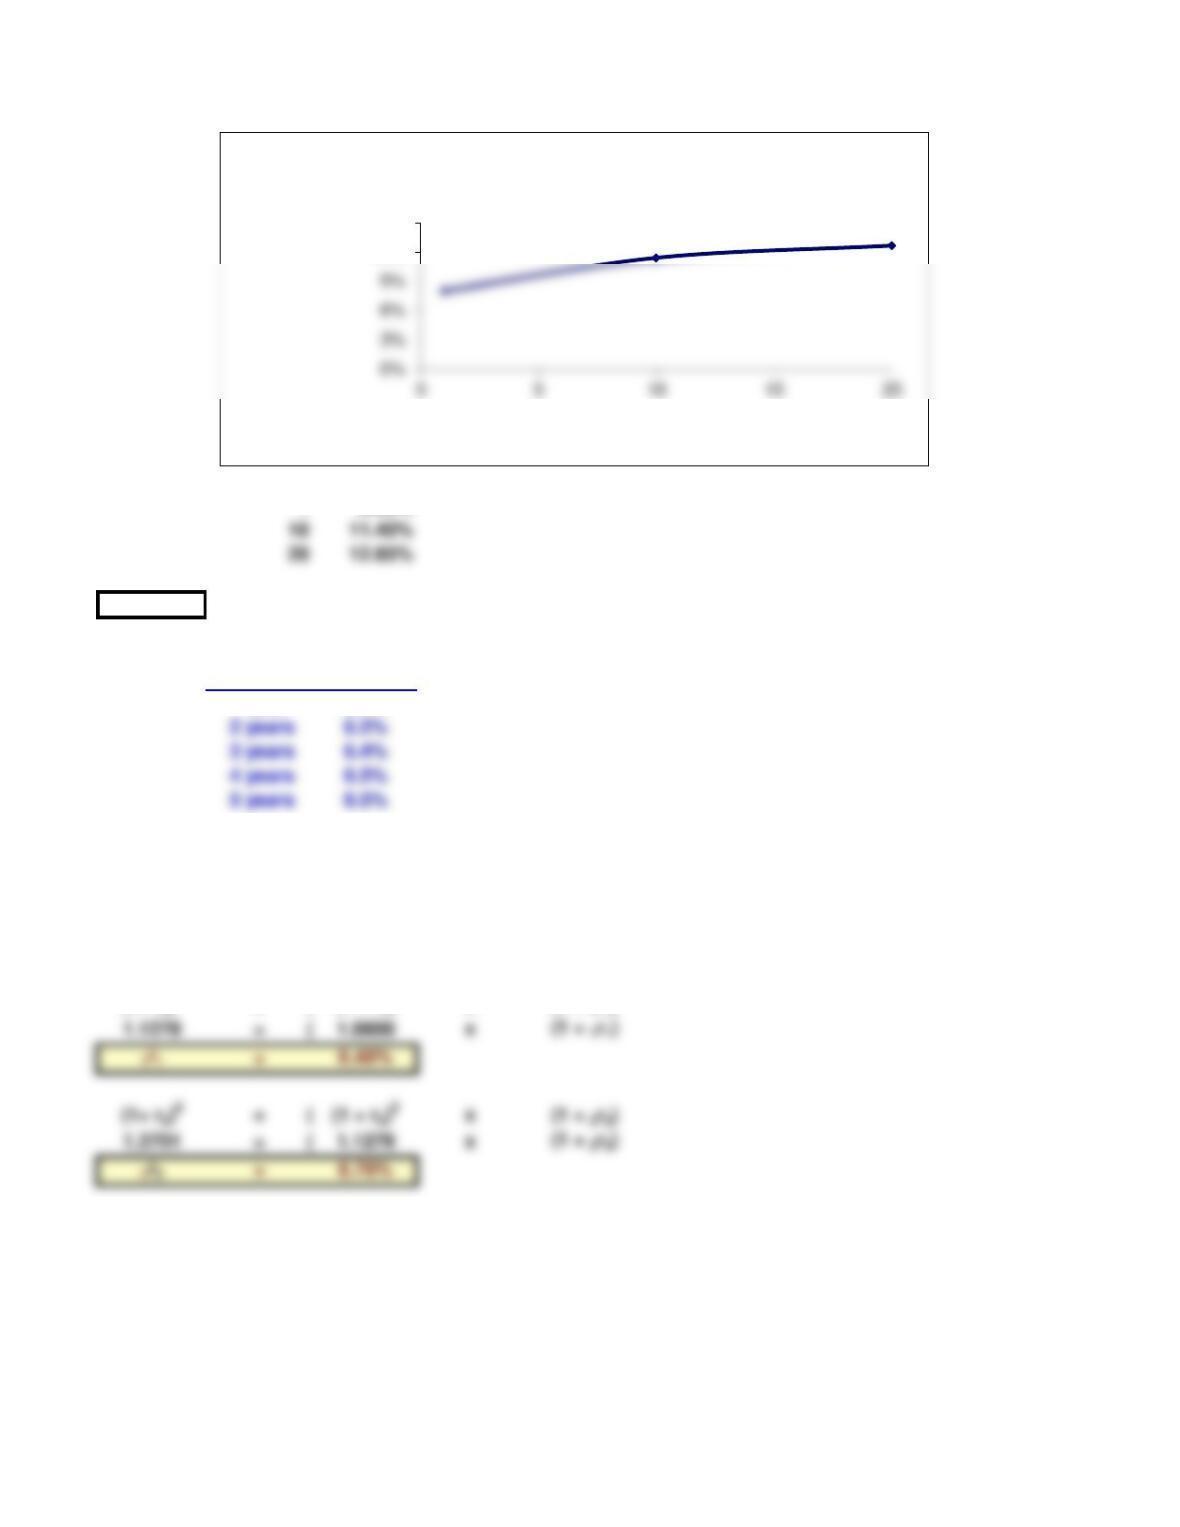
which it is stable. What is the interest rate on 1-, 10-, and 20-year Treasury bonds? Draw a yield curve
with these data. What factors can explain why this constructed yield curve is upward sloping?
1 8.00%
PART H
Maturity Yield
1 year 6.0%
(1+ r2)2
= (
(1 + r1) x (1 + 1r1)
(1+ r5)5
= (
Assume that the pure expectations theory of the term structure is correct. (This implies that you can use
the yield curve provided to “back out” the market’s expectations about future interest rates.) What does
the market expect will be the interest rate on 1-year securities one year from now? What does the market
expect will be the interest rate on 3-year securities two years from now? Calculate the yields using
geometric averages.
Suppose that you observe the following term structure for Treasury securities:
12%
15%
Interest rate
Years to maturity
Yield Curve