CHAPTER 6
TRACKING THE U.S. ECONOMY
SOLUTIONS TO END OF CHAPTER PROBLEMS
1. The expenditure approach adds up the total spending on new production, while the income
approach adds up all of the income earned by the resource suppliers in producing flour. The value
2.
a. GDP = C + Igross + G + (X−M) = 200 + 40 + 50 + (30− 40) = $280 billion
3.
a. $1.4 trillion = 500 (new residential construction) + 800 (new physical capital) + 100 (net
4. The circular flow model summarizes the flow of income and spending through the economy.
Saving, net taxes, and imports leak from the circular flow. These leakages equal the
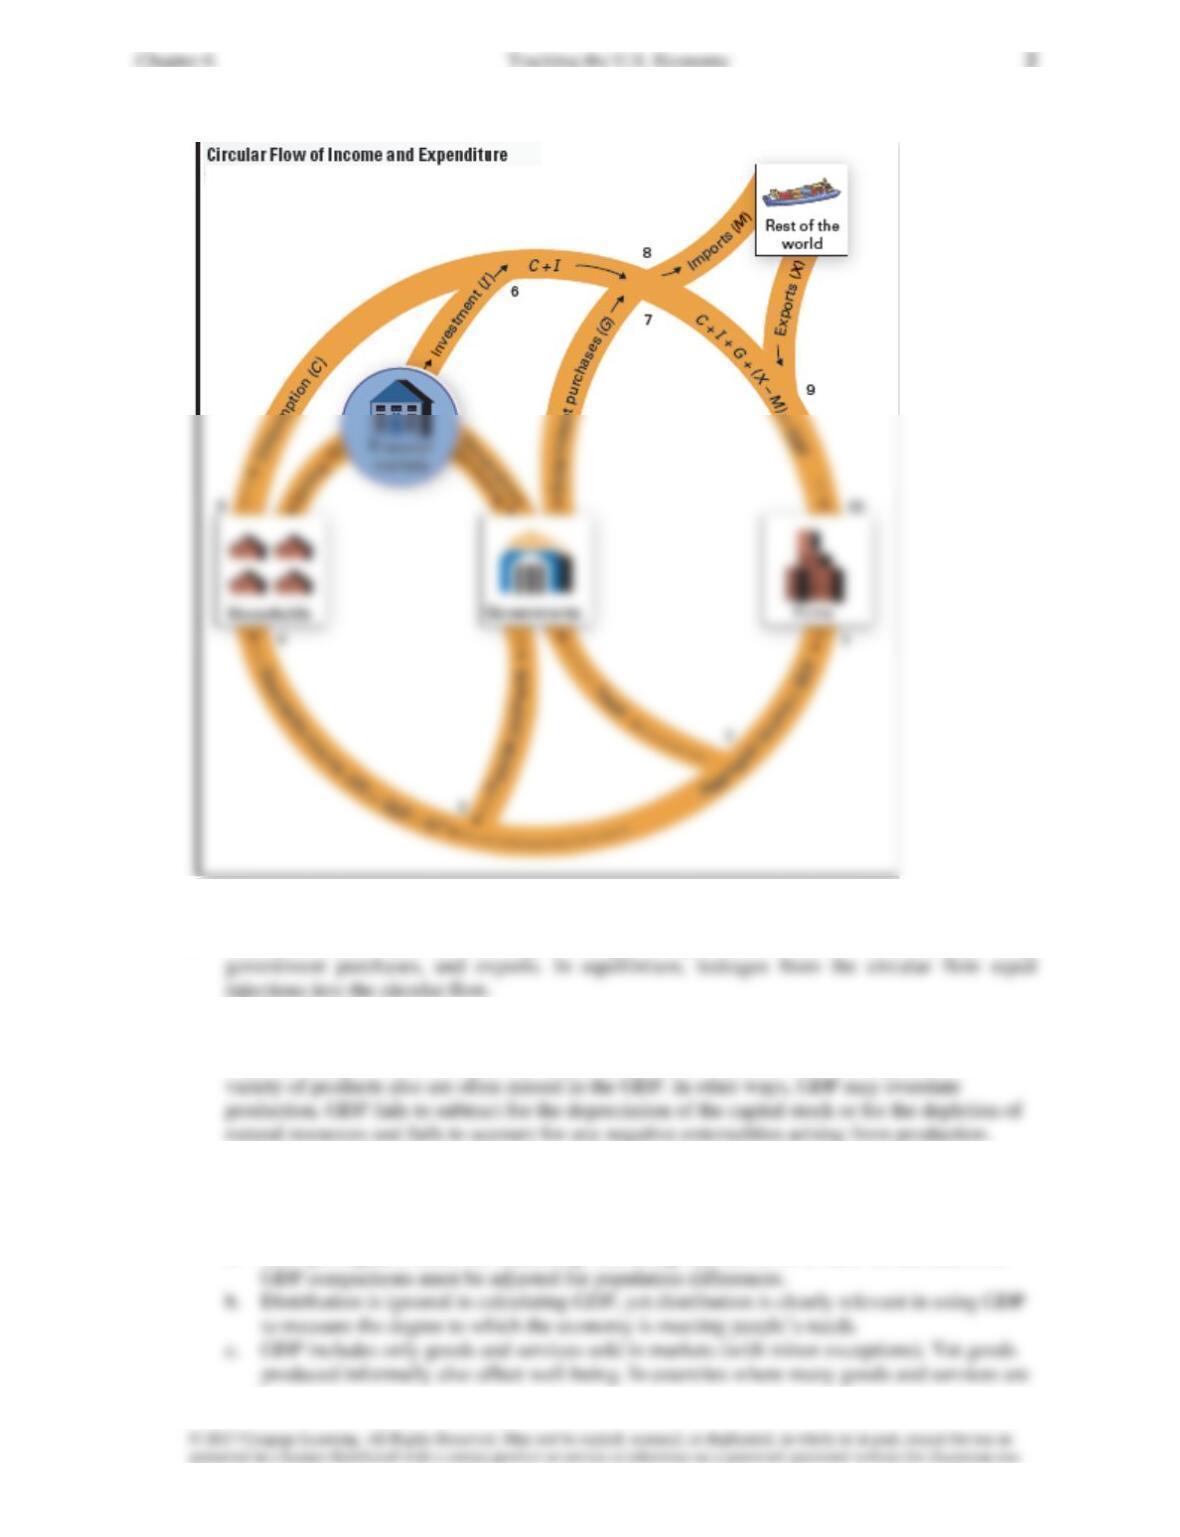
5. Leakages include net taxes, saving, and imports. Injections consist of investment spending,
6. GDP reflects market production in a given period, usually a year. Most household production
and the underground economy are not captured by GDP. Improvements in the quality and
7. This question highlights some of the problems that accompany the indiscriminate use of GDP
comparisons across countries or over long periods to compare welfare levels.
a. GDP per capita is better for measuring well-being than the level of GDP is, and therefore
Chapter 6 Tracking the U.S. Economy 3
8. Current expenditures now equal $346.75 for Twinkies, $625.00 for fuel oil, and $180.00 for
9. A price index always equals 100 in the base year.
a. 20.0 percent