
A n s w e r s t o t h e R e v i e w Q u i z z e s
Page 134 (page 542 in Economics)
1. What is economic growth and how do we calculate its rate?
2. What is the relationship between the growth rate of real GDP and the growth rate of real GDP
per person?
3. Use the Rule of 70 to calculate the growth rate that leads to a doubling of real GDP per person in
20 years.
Page 137 (page 545 in Economics)
1. What has been the average growth rate of U.S. real GDP per person over the past 100 years? In
which periods was growth most rapid and in which periods was it slowest?
2. Describe the gaps between real GDP per person in the United States and in other countries. For
which countries is the gap narrowing? For which is it widening? For which is it the same?
Some rich countries are catching up with the United States, but the gaps between the United States and
6
ECONOMIC
GROWTH**
C h a p t e r

78 C H A P T E R 6
3. Compare the growth rates in Hong Kong, Korea, Singapore, Taiwan, China, and the United
States. In terms of real GDP per person, how far is China behind these others?
Since 1960, income per person in the nations of Hong Kong, Singapore, Korea, Taiwan, and China have
Page 143 (page 551 in Economics)
1. What is the aggregate production function?
2. What determines the demand for labor, the supply of labor, and labor market equilibrium?
The demand for labor is the relationship between the quantity of labor demanded and the real wage
rate. A fall in the real wage rate increases the quantity of labor demanded because of diminishing
3. What determines potential GDP?
4. What are the two broad sources of potential GDP growth?
5. What are the effects of an increase in the population on potential GDP, the quantity of labor, the
real wage rate, and potential GDP per hour of labor?
6. What are the effects of an increase in labor productivity on potential GDP, the quantity of labor,
the real wage rate, and potential GDP per hour of labor?

E C O N O M I C G R O W T H 79
Page 145 (page 553 in Economics)
1. What are the preconditions for labor productivity growth?
2. Explain the influences on the pace of labor productivity growth.
Once the preconditions for growth are in place, the sources of labor productivity growth are: physical
Page 151 (page 559 in Economics)
1. What is the key idea of classical growth theory that leads to the dismal outcome?
The “dismal outcome” in classical theory is the conclusion that in the long run real GDP per person
2. What, according to neoclassical growth theory, is the fundamental cause of economic growth?
3. What is the key proposition of new growth theory that makes economic growth persist?

80 C H A P T E R 6
A n s w e r s t o t h e S t u d y P l a n Pr o b l e m s a n d A p p l i c a t i o ns
1. Brazil’s real GDP was 1,180 trillion reais in 2013 and 1,202 trillion reais in 2014. Brazil’s
population was 198 million in 2013 and 200 million in 2014. Calculate
a. The growth rate of real GDP.
b. The growth rate of real GDP per person.
Brazil’s population grew at [(200 million − 198 million)/198 million] 100, which is 1.0 percent. Brazil’s
c. The approximate number of years it takes for real GDP per person in Brazil to double if the
2014 growth rate of real GDP and the population growth rate are maintained.
2. China’s real GDP per person was 13,165 yuan in 2013 and 14,088 yuan in 2014. India’s real GDP
per person was 49,516 rupees in 2013 and 51,521 rupees in 2014. By maintaining their current
growth rates, which country will be the first to double its standard of living?
China’s growth rate of real GDP per person is [(16,010 yuan − 15,040 yuan)/15,040 yuan] 100, which
3. China was the largest economy for centuries because everyone had the same type of economy—
subsistence—and so the country with the most people would be economically biggest. Then the
Industrial Revolution sent the West on a more prosperous path. Now the world is returning to a
common economy, this time technology- and information-based, so once again population
triumphs.
a. Why was China the world’s largest economy until 1890?
GDP equals GDP per person multiplied by the number of people. Until 1890 most people in the world
b. Why did the United States surpass China in 1890 to become the world’s largest economy?
E C O N O M I C G R O W T H 81
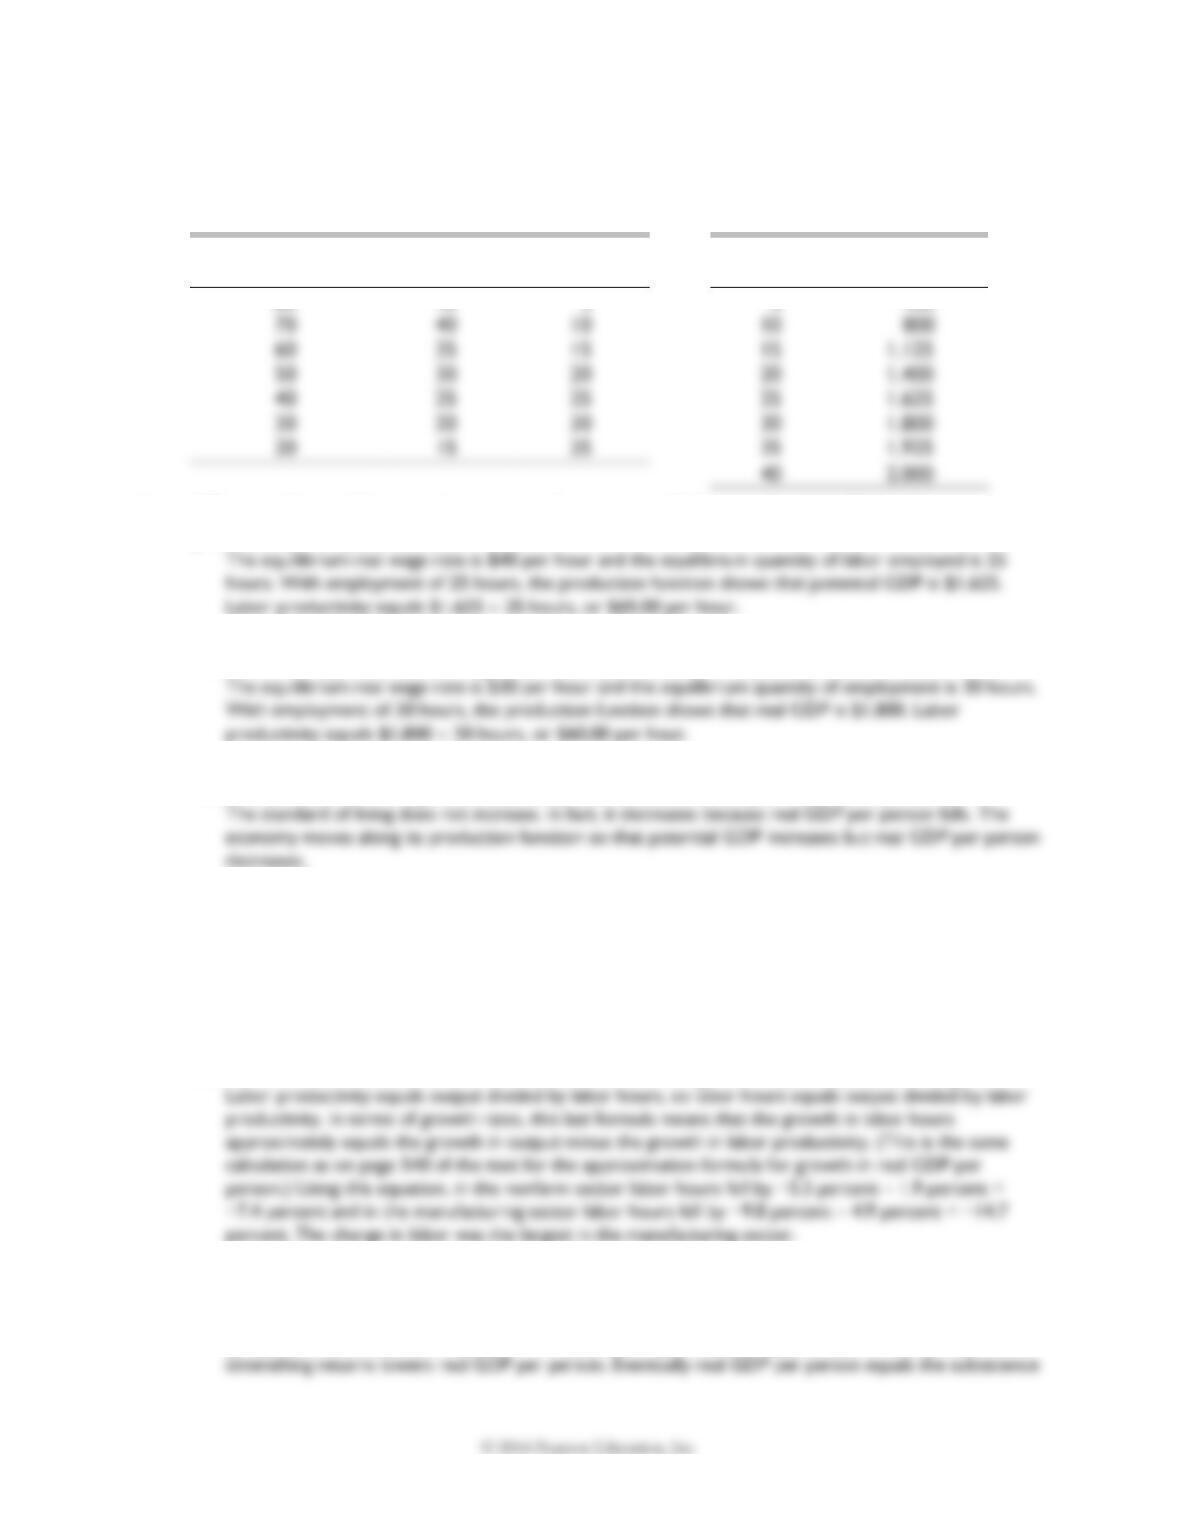
Use the following tables to work Problems 4 to 6.
The first table describes an economy’s labor market in 2014 and the second table describes its
production function in 2014.
Real wage rate
(dollars per hour)
Labor hours
supplied
Labor hours
demanded
Labor
(hours)
Real GDP
(2009 dollars)
80
45
5
5
425
60
35
50
30
30
20
20
15
4. What are the equilibrium real wage rate, the quantity of labor employed in 2014, labor
productivity, and potential GDP in 2014?
5. In 2015, the population increases and labor hours supplied increase by 10 at each real wage rate.
What are the equilibrium real wage rate, labor productivity, and potential GDP in 2015?
6. In 2015, the population increases and labor hours supplied increase by 10 at each real wage rate.
Does the standard of living in this economy increase in 2015? Explain why or why not.
7. Labor Productivity on the Rise
The BLS reported the following data for the year ended June 2009: In the nonfarm sector, output
fell 5.5 percent as labor productivity increased 1.9 percent—the largest increase since 2003—but
in the manufacturing sector, output fell 9.8 percent as labor productivity increased by 4.9
percent—the largest increase since the first quarter of 2005.
Source: bls.gov/news.release, August 11, 2009
In both sectors, output fell while labor productivity increased. Did the quantity of labor (aggregate
hours) increase or decrease? In which sector was the change in the quantity of labor larger?
8. Explain the processes that will bring the growth of real GDP per person to a stop according to
a. Classical growth theory.
According to the classical theory, population growth continues at a rapid pace as long as real GDP per
person exceeds the subsistence level. With population growth, the supply of labor increases and

82 C H A P T E R 6

E C O N O M I C G R O W T H 83
Answers to Additional Problems and Applications
9. In 2014 China’s real GDP is growing at 7 percent a year and its population is growing at 0.5
percent a year. If these growth rates continue, in what year will China’s real GDP per person be
twice what it is in 2014?
10. Mexico’s real GDP was 13,405 trillion pesos in 2013 and 13,805 trillion pesos in 2014. Mexico’s
population was 118.4 million in 2013 and 119.5 million in 2014. Calculate
a. The growth rate of real GDP.
Between 2013 and 2014 this growth rate equals [(13,805 trillion pesos − 13,405 trillion pesos)/13,405
11. South Africa’s real GDP was 1,900 billion rand in 2011 and 1,970 billion rand in 2012. South
Africa’s population was 50.5 million in 2011 and 51.0 million in 2012. Calculate
a. The growth rate of real GDP.
The growth rate of real GDP between 2011 and 2012 equals [(1,970 billion rand − 1,900 billion
b. The growth rate of real GDP per person.
South Africa’s population growth rate is equal to [(51.0 million − 50.5 million)/50.5 million] 100,
12. The New World Order
While gross domestic product growth is picking up a bit in emerging market economies, it is
picking up even more in the advanced economies. Real GDP in the emerging market economies is
forecasted to grow at 5.4% in 2015 up from 4.9% in 2012. In the advanced economies, real GDP is
expected to grow at 2.3% in 2015 up from 1.4% in 2012. The difference in growth rates means
that the large spread between emerging market economies and advanced economies of the past
40 years will continue for many more years.
Source: World Economic Outlook, January, 2014
Do growth rates over the past few decades indicate that gaps in real GDP per person around the
world are shrinking, growing, or staying the same? Explain.
13. If a large increase in investment increases labor productivity, explain what happens to
a. Potential GDP.
b. Employment.
14. If a severe drought decreases labor productivity, explain what happens to
a. Potential GDP.
b. Employment.
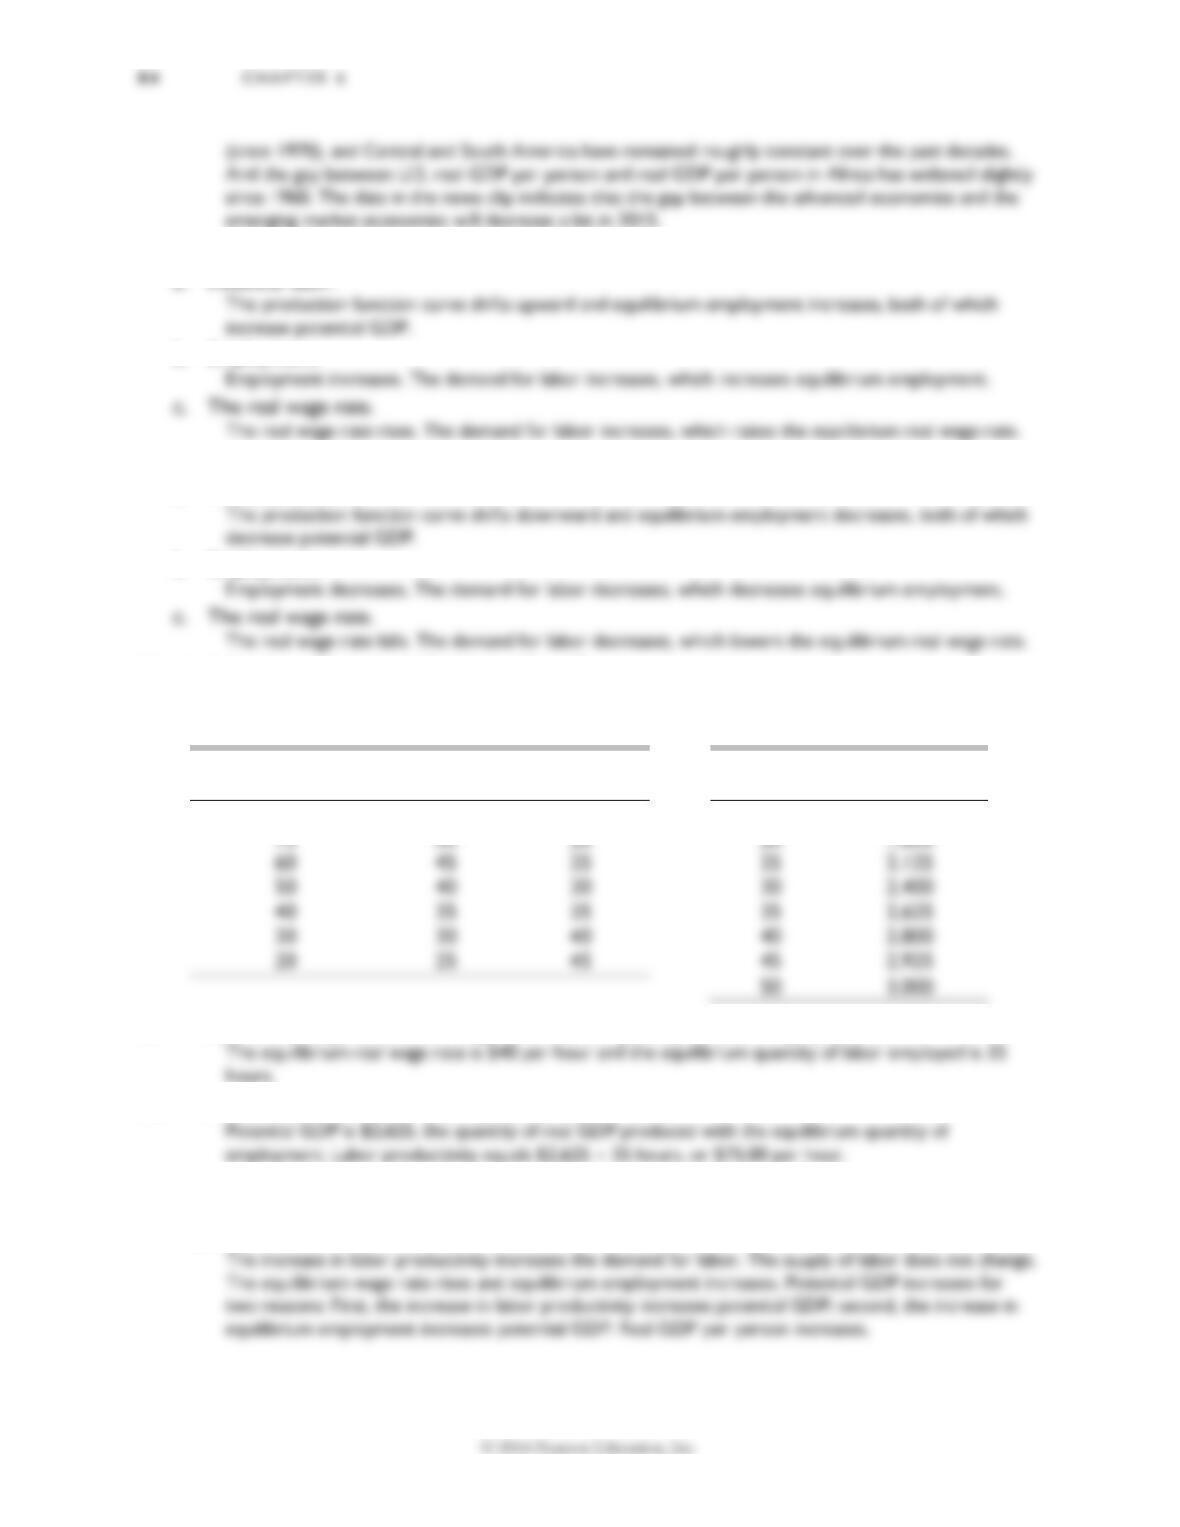
Use the following tables to work Problems 15 to 17.
The first table describes an economy’s labor market in 2014 and the second table describes its
production function in 2014.
Real wage rate
(dollars per hour)
Labor hours
supplied
Labor hours
demanded
Labor
(hours)
Real GDP
(2009 dollars)
80
55
15
15
1,425
60
45
25
25
2,125
50
40
30
30
2,400
30
30
40
40
2,800
20
25
45
45
2,925
15. What are the equilibrium real wage rate and the quantity of labor employed in 2014?
16. What are labor productivity and potential GDP in 2014?
17. Suppose that labor productivity increases in 2014.What effect does the increased labor
productivity have on the demand for labor, the supply of labor, potential GDP, and real GDP per
person?

18. India’s Economy Hits the Wall
Just six months ago, India was looking good. Annual growth was 9%, consumer demand was huge,
and foreign investment was growing. But now most economic forecasts expect growth to slow to
7%—a big drop for a country that needs to accelerate growth. India needs urgently to upgrade its
infrastructure and education and health-care facilities. Agriculture is unproductive and needs
better technology. The legal system needs to be strengthened with more judges and courtrooms.
Source: BusinessWeek, July 1, 2008
Explain five potential sources for faster economic growth in India suggested in this news clip.
19. The Productivity Watch
According to former Federal Reserve chairman Alan Greenspan, IT investments in the 1990s
boosted productivity, which boosted corporate profits, which led to more IT investments, and so
on, leading to a nirvana of high growth.
Source: Fortune, September 4, 2006
Which of the growth theories that you’ve studied in this chapter best corresponds to the
explanation given by Mr. Greenspan?
20. Is faster economic growth always a good thing? Argue the case for faster growth and the case for
slower growth. Then reach a conclusion on whether growth should be increased or slowed.
21. Why Canada’s Industry Leaders Need to Embrace the Technology Mindset
We are at a tipping point where technology— from software to hardware and everything in
between—is weaving its way into all that we do and is about to touch every industry. Every day,
we are reminded how quickly things are changing from connected cars, to wearable devices, to
manufacturing. Just look at the rapid advance in China’s economy and standard of living driven in
large part by an innovative spirit unleashed in the late 1990s.
Source: Financial Post, July 11, 2014
Explain which growth theory best describes the news clip.
The new growth theory stresses the role of innovation and the birth of new firms and the death of old

86 C H A P T E R 6
Economics in the News
22. After you have studied Economics in the News on pp. 152–153 (560–561 in Economics), answer the
following questions.
a. How do economic growth rates of South Africa and Botswana compare?
b. For South Africa to grow faster, how would the percentage of GDP invested in new capital need
to change?
c. If South Africa is able to achieve a growth rate of 8 percent per year, in how many years will
real GDP have doubled?
d. Describe the policies proposed by the author of the news article and explain how they might
change labor productivity.
There are a variety of proposals designed to increase labor productivity. These proposals include (1)
reforming labor laws by removing the automatic extension of collective bargaining agreements across
e. What is the source of Botswana’s growth success story and what must South Africa do to
replicate that success?
E C O N O M I C G R O W T H 87
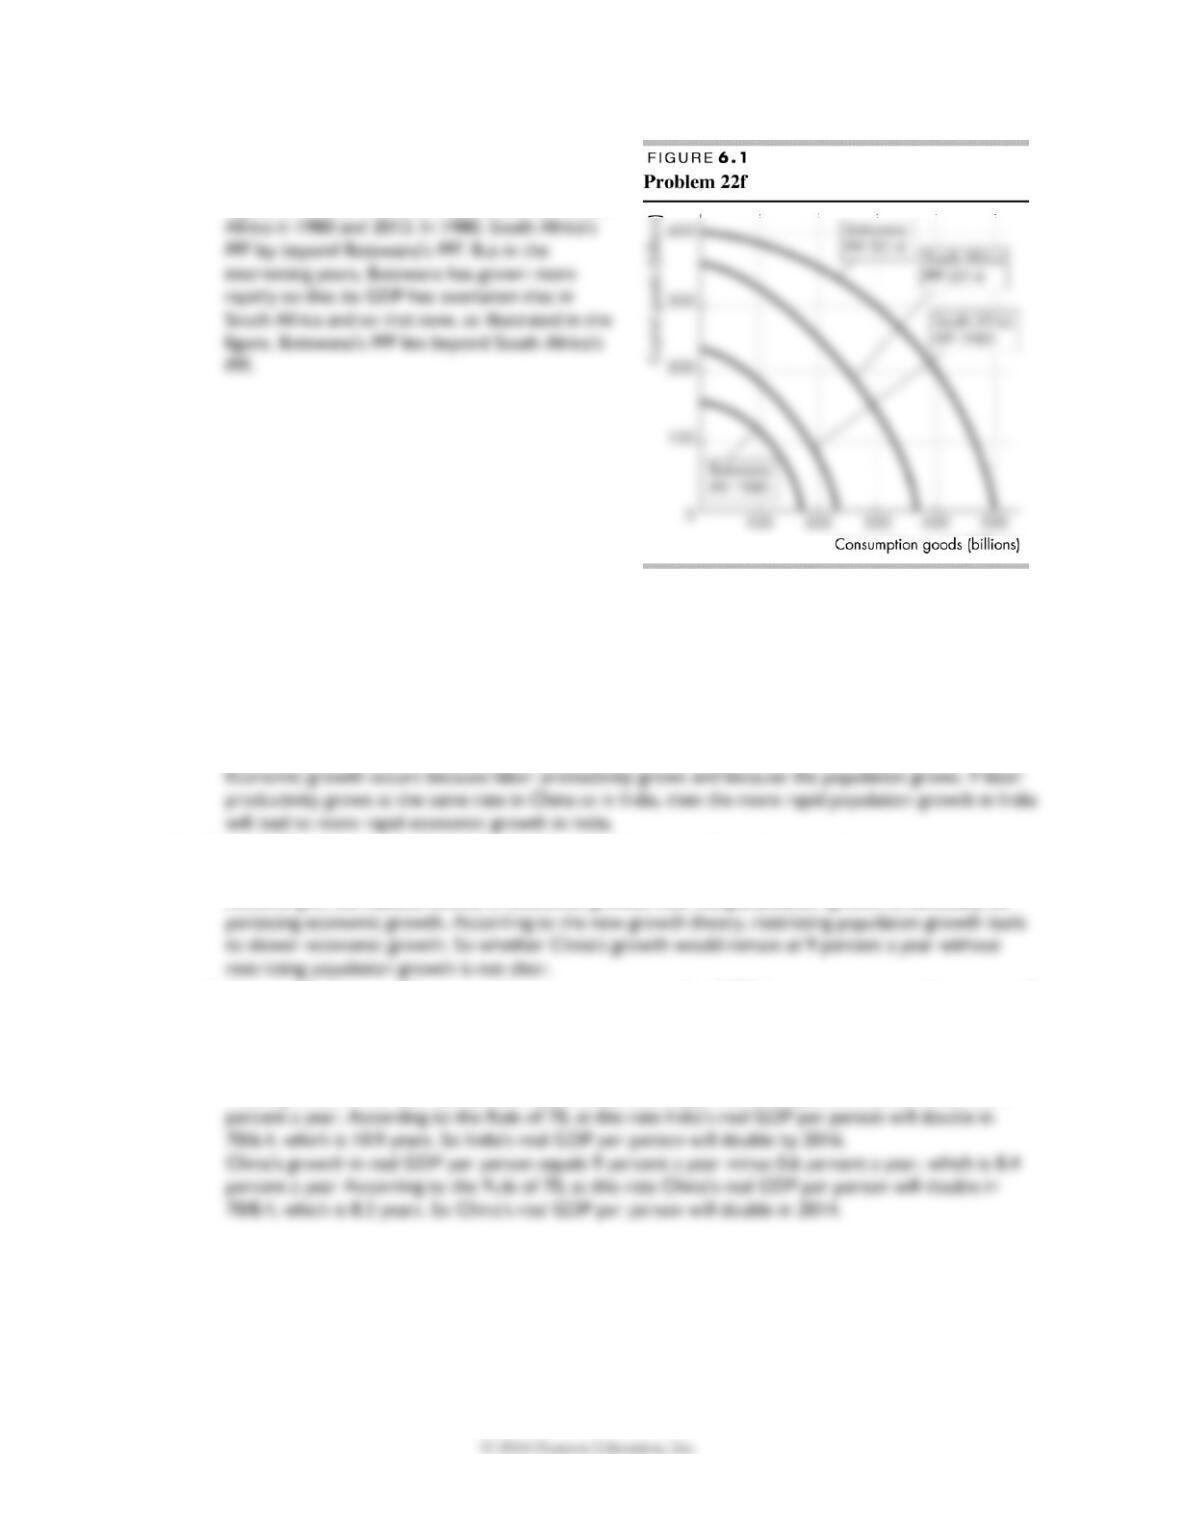
f. Draw a PPF graph to show what has happened
in Botswana and South Africa since 1980.
Figure 6.1 shows the PPFs of Botswana and South
23. Make Way for India—The Next China
China grows at around 9 percent a year, but its one-child policy will start to reduce the size of
China’s working-age population within the next 10 years. India, by contrast, will have an increasing
working-age population for another generation at least.
Source: The Independent, March 1, 2006
a. Given the expected population changes, do you think China or India will have the greater
economic growth rate? Why?
b. Would China’s growth rate remain at 9 percent a year without the restriction on its population
growth rate?
According to the classical theory of economic growth, restricting population growth is necessary for
c. India’s population growth rate is 1.6 percent a year, and in 2005 its economic growth rate was 8
percent a year. China’s population growth rate is 0.6 percent a year, and in 2005 its economic
growth rate was 9 percent a year. In what year will real GDP per person double in each
country?
India’s growth in real GDP per person equals 8 percent a year minus 1.6 percent a year, which is 6.4