Mishkin • Instructor’s Manual for The Economics of Money, Banking, and Financial Markets, Twelfth Edition 92
Chapter 6
ANSWERS TO QUESTIONS
1. If junk bonds are “junk,” then why do investors buy them?
2. Which should have the higher risk premium on its interest rates, a corporate bond with a
Moody’s Baa rating or a corporate bond with a C rating? Why?
3. Do you think that a U.S. Treasury bill will have a risk premium that is higher than, lower
than, or the same as that of a similar security (in terms of maturity and liquidity) issued by
the government of Colombia?
4. In the fall of 2008, AIG, the largest insurance company in the world at the time, was at risk
of defaulting due to the severity of the global financial crisis. As a result, the U.S.
government stepped in to support AIG with large capital injections and an ownership stake.
How would this affect, if at all, the yield and risk premium on AIG corporate debt?
The risk of default would significantly decrease demand for AIG corporate debt, resulting in
5. Risk premiums on corporate bonds are usually anticyclical; that is, they decrease during
business cycle expansions and increase during recessions. Why is this so?
During business cycle booms, fewer corporations go bankrupt and there is less default risk on

6. Just before the collapse of the subprime mortgage market in 2007, the most important credit-
rating agencies rated mortgage-backed securities with Aaa and AAA ratings. Explain how it
was possible that a few months into 2008, the same securities had the lowest possible ratings.
Should we always trust credit-rating agencies?
Historically, mortgage-backed securities were considered low-risk assets, since homeowners
had the highest incentives to pay their mortgages (otherwise they might lose their home).
7. The U.S. Treasury offers some of its debt as Treasury Inflation Indexed Securities, or TIIS
(more commonly known as TIPS, an acronym for Treasury Inflation Protected Securities), in
which the price of bonds is adjusted for inflation over the life of the debt instrument. TIPS
bonds are traded on a much smaller scale than nominal U.S. Treasury bonds of equivalent
maturity. What can you conclude about the liquidity premiums of TIPS versus nominal U.S.
bonds?
Since TIPS (TIIS) bonds are traded much more lightly than their nominal counterparts, demand for
8. Predict what will happen to interest rates on a corporation’s bonds if the federal government
guarantees today that it will pay creditors if the corporation goes bankrupt in the future.
What will happen to the interest rates on Treasury securities?
9. Predict what would happen to the risk premiums of municipal bonds if the federal
government guarantees today that it will pay creditors if municipal governments default on
their payments. Do you think that it will then make sense for municipal bonds to be exempt
from income taxes?
If the federal government decides to guarantee payments on all municipal bonds, then these
bonds will effectively be default free. This characteristic will make them very desirable

10. During 2008, the difference in yield (the yield spread) between three-month AA-rated
financial commercial paper and three-month AA-rated nonfinancial commercial paper
steadily increased from its usual level of close to zero, spiking to over a full percentage point
at its peak in October 2008. What explains this sudden increase?
The global financial crisis hit financial companies very suddenly and very hard, creating
11. If the income tax exemption on municipal bonds were abolished, what would happen to the
interest rates on these bonds? What effect would the change have on interest rates on U.S.
Treasury securities?
12. Prior to 2008, mortgage lenders required a house inspection to assess a home’s value, and
often used the same one or two inspection companies in the same geographical market.
Following the collapse of the housing market in 2008, mortgage lenders required a house
inspection, but this inspection was arranged through a third party. How does the pre-2008
scenario illustrate a conflict of interest similar to the role that credit-rating agencies played
in the global financial crisis?
Credit rating agencies had a conflict of interest that was said to contribute to the crisis in that
the rating agencies had an incentive to provide overly optimistic ratings to clients whom they
13. “According to the expectations theory of the term structure, it is better to invest in one-year
bonds, reinvested over two years, than to invest in a two-year bond if interest rates on one-
year bonds are expected to be the same in both years.” Is this statement true, false, or
uncertain?
False. The expectations theory of the term structure implies that, with a $1 investment in one-
period bonds over two years, the expected return is given as 1,
e
ii which equals 2it assuming
14.
I
f bo
n
were
theo
ry
hold
s
(a)
U
this
w
t
r
e
e
t
e
e
e
15.
Supp
6%,
a
indi
ff
beha
v
Inve
s
p
e
p
t
e
n
t
u
n
u
r
m
r
m
e
n
t
n
h
t
h
c
16.
I
f a
y
abou
abou
n
d investors
previously,
p
ry
of the ter
m
s
.
U
nder the ex
p
w
ill increase
o
se the inte
r
a
nd 6%, res
p
ff
erent with
r
v
ior of Inve
s
s
tor A, even
y
ield curve l
o
t the movem
t the marke
t
decide that
3
p
redict wha
t
m
structure h
o
p
ectations th
e
the deman
d
r
est rates on
p
ectively. In
v
egard to ho
l
s
tors A and
B
though she
r
o
oks like the
ent o
f
futur
e
’
s predictio
n
30
–
y
ear bon
d
t
will happe
n
o
lds and (b)
e
ory of the t
e
d
for bonds
o
one-, five-,
v
estor A ch
o
l
ding five- a
n
B
?
r
eceives a l
o
one shown
e
short-term
n
s for the in
f
d
s are no lo
n
n
to the yiel
d
the segmen
t
e
rm structur
e
o
f other mat
u
and ten-
y
ea
r
o
oses to hol
d
n
d ten-
y
ear
b
o
wer expect
e
i
n the figur
e
interest rat
e
f
lation rate
i
n
ger as desi
r
d
curve, assu
m
t
ed markets
t
e
, if 30-year
u
rities, since
r
US Treas
u
d
only one-
ye
bonds. How
e
d return, cl
e
e
below, wh
a
e
s? What mi
g
i
n the future
r
able an inv
e
m
ing (a) the
t
heory of the
bonds beco
m
they are vi
e
u
ry bonds ar
e
e
ar bonds,
a
w
can you ex
p
e
arly prefer
s
a
t is the mar
k
g
ht the yiel
d
?
e
stment as th
expectation
s
term struct
u
m
e less desi
r
e
wed as per
f
e
currently
3
a
nd Investor
p
lain the
s
to hold sho
k
et predicti
n
d
curve indi
c
e
y
s
u
re
r
able,
f
ect
3
%,
B is
rt-
n
g
c
ate
17.
I
f a
y
abou
abou
The
s
rates
e
o
e
n
o
r
n
r
t
r
t
d
d
s
k
o
s
o
18.
I
f yie
p
rem
theo
r
If yi
e
y
ield curve l
o
t the movem
t the marke
t
s
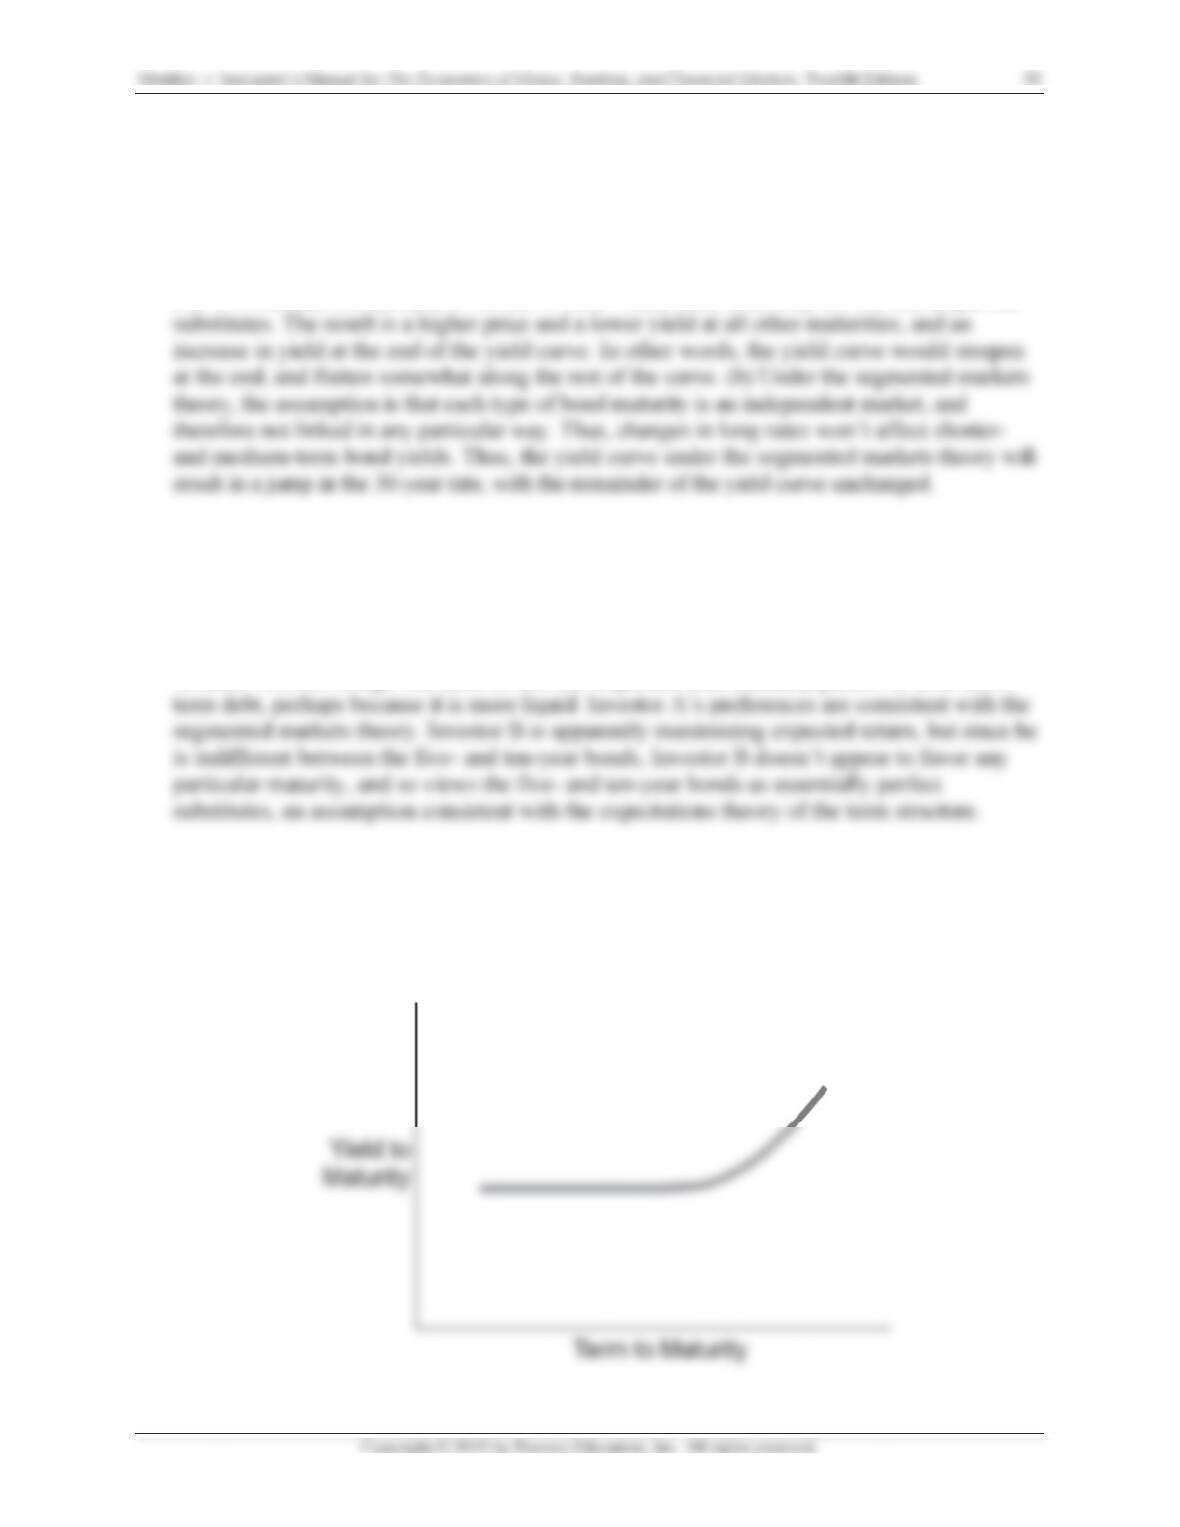
teep upwar
d
are expecte
d
ld curves, o
n
iums in the
t
r
y?
e
ld curves o
n
o
oks like the
ent of futur
e
’
s predictio
n
d
-sloping yi
e
d
to rise mo
d
n
average,
w
t
erm structu
n
average w
e
one shown
e
short-term
n
s for the in
f
e
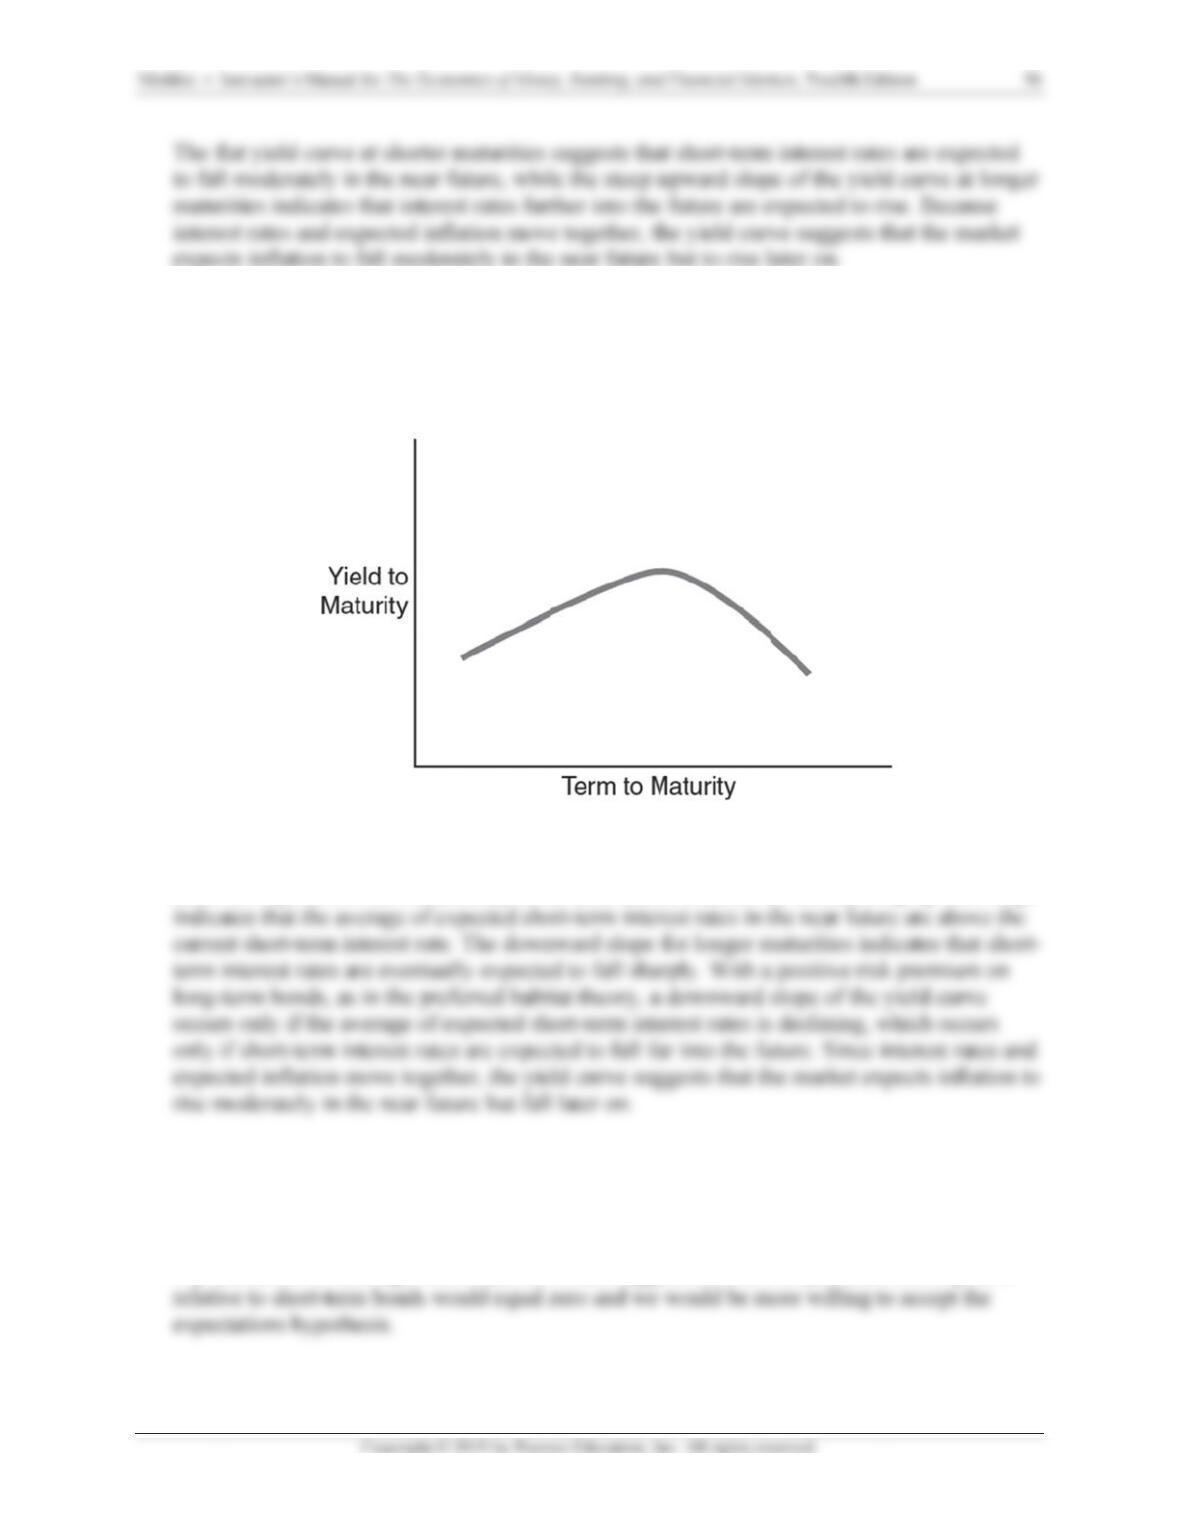
ld curve at
d
erately in t
h
w
ere flat, wh
re? Would
y
e
re flat, this
i
n the figur
e
interest rat
e
f
lation rate
i
shorter mat
u
h
e near futu
r
at would thi
s
y
ou be more
would sugg
e
e
below, wh
a
e
s? What mi
g
i
n the future
u
rities sugg
e
r
e because t
h
i
s say about
or less will
i
e
st that the
r
a
t is the mar
k
g
ht the
y
iel
d
?
e
sts that sho
r
h
e initial, st
e
the liquidit
y
i
ng to accep
t
r
isk premiu
m
k
et predicti
n
d
curve indi
c
r
t-term inter
e
e
ep upward
s
y
(term)
t
the expect
a
m
on long-te
r
n
g
c
ate
e
st
s
lope
a
tions
r
m
r
t
e
t
r
r
n
e
t
e
h
h
v
e
r
v
r
t
e

19. If the yield curve suddenly became steeper, how would you revise your predictions of interest
rates in the future?
20. If expectations of future short-term interest rates suddenly fell, what would happen to the
slope of the yield curve?
21. Following a policy meeting on March 19, 2009, the Federal Reserve made an announcement
that it would purchase up to $300 billion of longer-term Treasury securities over the following
six months. What effect might this policy have on the yield curve?
If the Federal Reserve purchases a significant amount of longer-term treasury debt, this will
ANSWERS TO APPLIED PROBLEMS
22. In 2010 and 2011, the government of Greece risked defaulting on its debt due to a severe
budget crisis. Using bond market graphs, compare the effects on the risk premium between
U.S. Treasury debt and comparable-maturity Greek debt.
As the risk of default by the Greek government increased, this reduced the demand for Greek
23. Assuming the expectations theory is the correct theory of the term structure, calculate the
interest rates in the term structure for maturities of one to five years, and plot the resulting
yield curves for the following paths of one-year interest rates over the plot the resulting
yield curves for the following paths of one-year interest rates over the next five years:
a. 5%, 6%, 7%, 6%, 5%

Mishkin • Instructor’s Manual for The Economics of Money, Banking, and Financial Markets, Twelfth Edition 98
(a) The yield to maturity would be 5% for a one-year bond, 6% for a two-year bond, 6.33%
for a three-year bond, 6.5% for a four-year bond, and 6.6% for a five-year bond. (b) The
24. Assuming the expectations theory is the correct theory of the term structure, calculate the
interest rates in the term structure for maturities of one to five years, and plot the resulting
yield curves for the following paths of one-year interest rates over the next five years:
a. 5%, 6%, 7%, 6%, 5%
How would your yield curves change if people preferred shorter-term bonds over longer-
term bonds?
25. The table below shows current and expected future one-year interest rates, as well as current
interest rates on multiyear bonds. Use the table to calculate the liquidity premium for each
multiyear bond.
Year One-Year
Bond Rate
Multiyear
Bond Rate
1 2% 2%
2 3% 3%

Mishkin • Instructor’s Manual for The Economics of Money, Banking, and Financial Markets, Twelfth Edition 99
The liquidity premium for a given year is the current rate on a multiyear horizon bond minus
the average of expected one year interest rates over that horizon. Thus, the liquidity
premiums for each year are given as:
l
11 = 2 – 2/1 = 0%.
ANSWERS TO DATA ANALYSIS PROBLEMS
1. Go to the St. Louis Federal Reserve FRED database and find data on Moody’s Aaa
corporate bond yield (AAA) and Moody’s Baa corporate bond yield (BAA). Download the
data into a spreadsheet.
a. Calculate the spread (difference) between the Baa and Aaa corporate bond yields for the
most recent month of data available. What does this difference represent?
The Baa yield for June 2017 was 4.37%, and the Aaa yield that month was 3.68%. Thus,
b. Calculate the spread again, for the same month but one year prior, and compare the
result to your answer to part (a). What do your answers say about how the risk premium
has changed over the past year?
One year prior in June 2016, the Baa yield was 4.53% and the Aaa yield was 3.50%,
c. Identify the month of highest and lowest spreads since the beginning of the year 2000.
How do these spreads compare to the most current spread data available? Interpret the
results.
Since the year 2000, the highest credit spread occurred in December 2008, at 3.38
percentage points, and the lowest occurred in January 2000 at 0.55 percentage points. The
2. Go to the St. Louis Federal Reserve FRED database, and find daily yield data on the
following U.S. treasuries securities: one-month (DGS1MO), three-month (DGS3MO), six-
month (DGS6MO), one-year (DGS1), two-year (DGS2), three-year (DGS3), five-year
(DGS5), seven-year (DGS7), 10-year (DGS10), 20-year (DGS20), and 30-year (DGS30).
Download the last full year of data available into a spreadsheet.
Mishkin •
a.
C
a
a
s
l
T
b.
D
C
d
yi
T
c
u
s
c
e
t
n
c
e
n
y
a
m
t
b
c
h
t
b
h
s
p
e
e
o
I
nstructor’s Ma
n
C
onstruct a
y
v
ailable, an
d
c
ross all th
e
l
ope say ab
o
T
he yield cu
r
D
etermine th
e
C
onstruct yi
e
da
y on which
i
eld curve a
s
T
he most rec
e
u
rve below
s
n
ual for The Ec
o
y
ield curve
by
d
for the sa
m
e
maturities.
o
ut potential
r
ve is shown
e
date of th
e
e
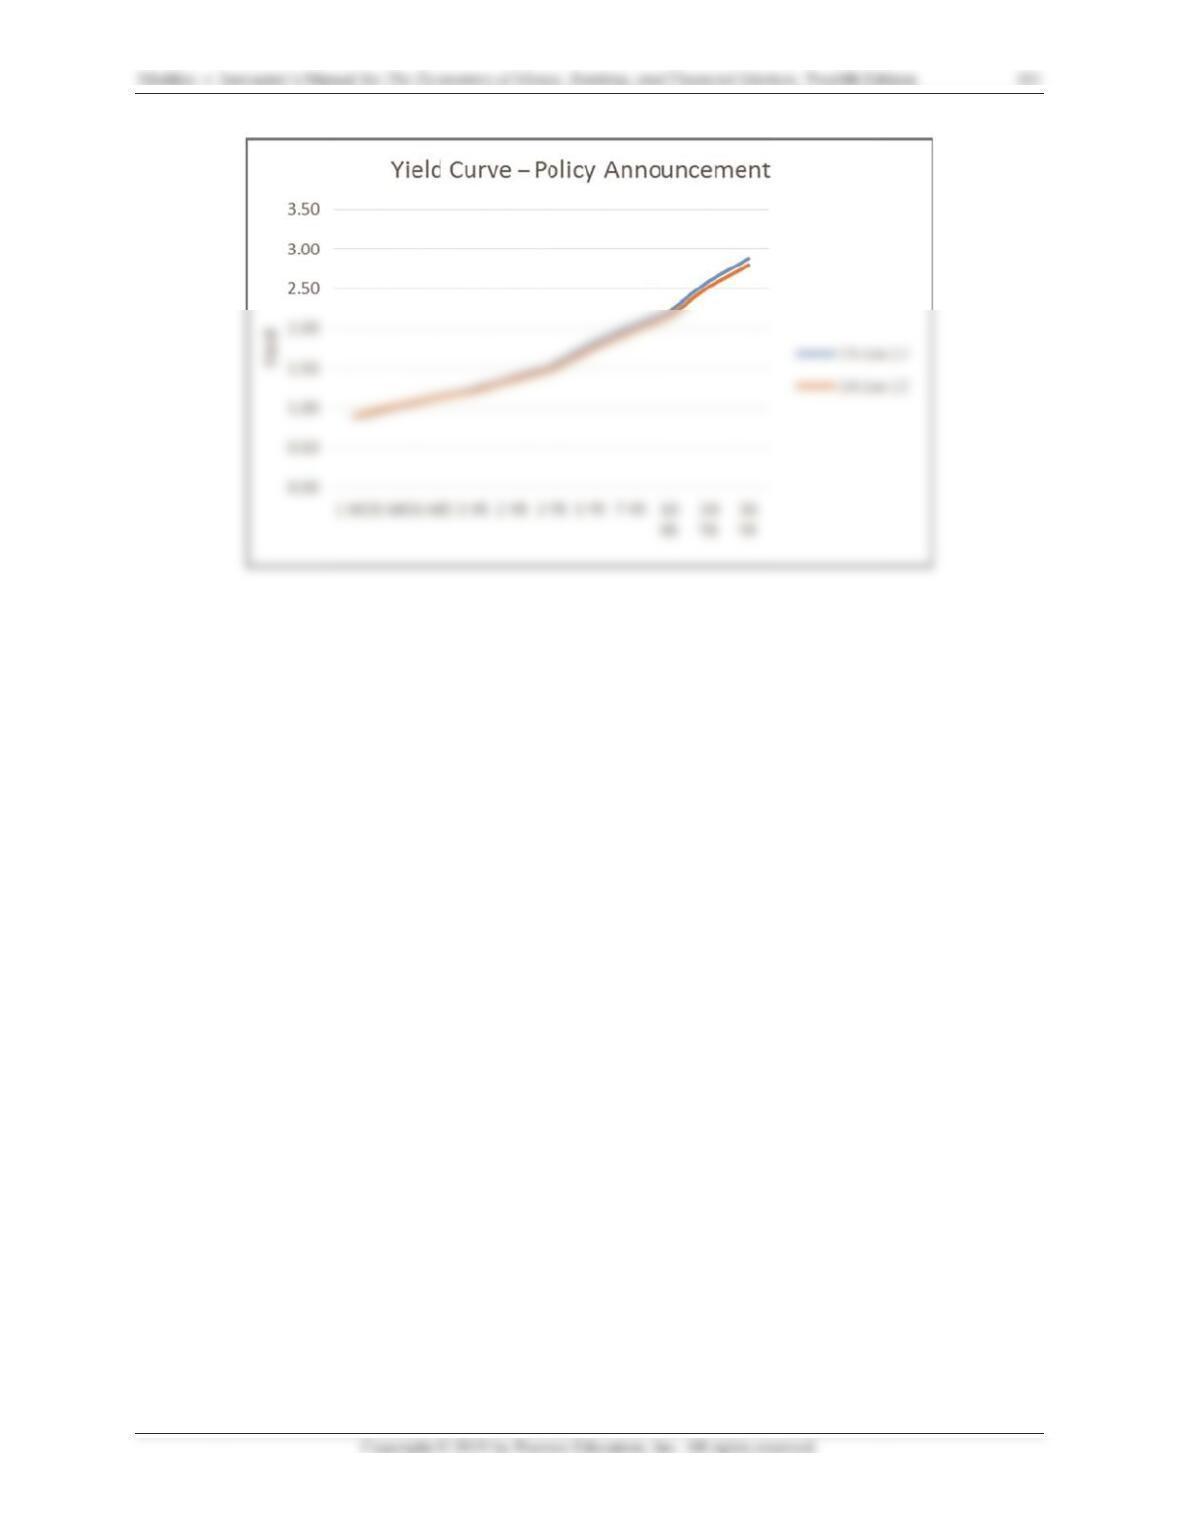
ld curves fo
r
the policy
s
s
a result of
e
nt FOMC
m
s
hows yield
s
o
nomics of Mon
e
by
creating
a
m
e day (or a
s
How do the
changes in
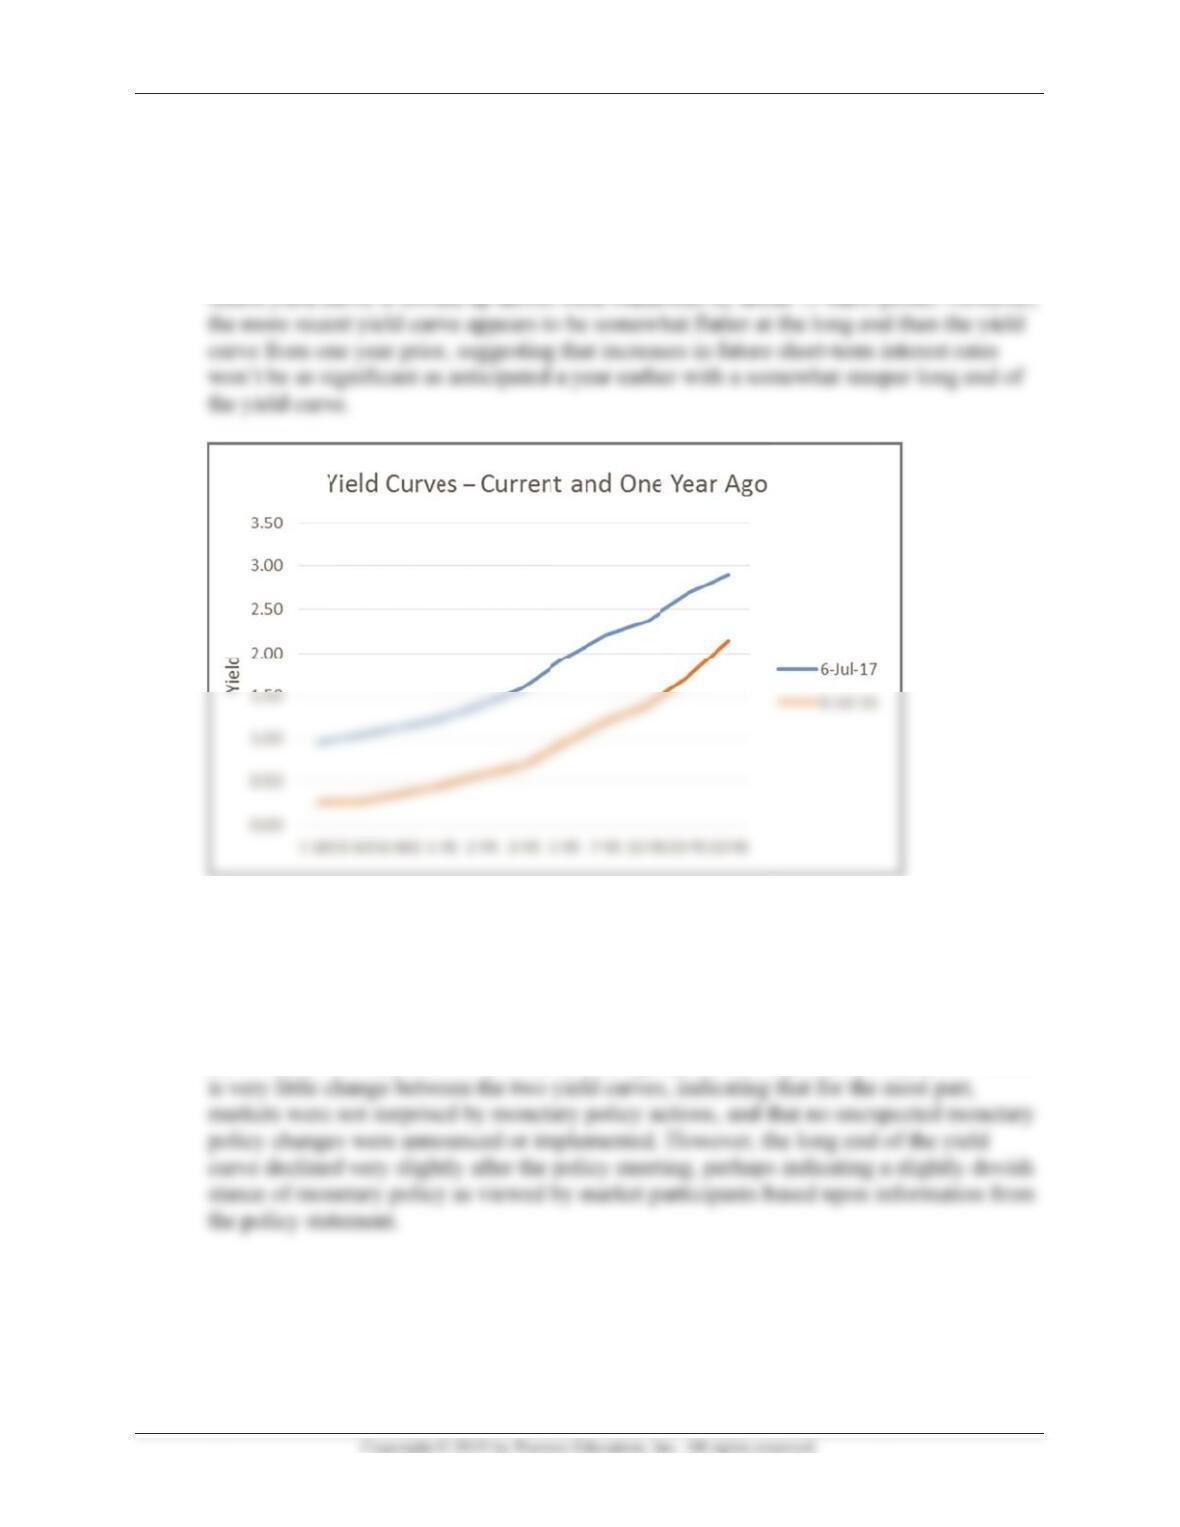
below, for
J
e
most recen
t
r
both the d
a
s
tatement w
a
the policy s
t
m
eeting poli
c
s
for the en
d
e
y, Banking, an
d
a
line graph
f
s
close to th
yield curve
s
economic c
o
J
uly 6, 2017
t
Federal O
p
a
y before th
e
a
s released.
t
atement?
Ho
c
y statemen
t
d
of trading
d
d
Financial Mar
k
f
or the most
e same day
a
s
compare?
o
nditions?
, and July 6
,
p
en Market
C
e
policy stat
e
Was there a
n
H
ow might th
i
t
occurred o
n
d
ay on that
d
k
ets, Twelfth E
d
t
recent day
o
a
s possible)
What does
t
,
2016. In g
e
Committee
p
e
ment was
r
n
y significa
n
is be explai
n
n June 14,
2
d
ay, and the
d
ition
o
f data
one year p
r
t
he changin
g
e
neral, the
m
p
olicy state
m
r
eleased an
d
n
t change in
n
ed?
2
017. The yi
e
day prior. T
100
r
ior,
g
m
ore
m
ent.
d
the
the
e
ld
here