Chapter 06 – Consumer Behavior (+ Appendix)
6A-1
Chapter 06 Consumer Behavior (+ Appendix)
QUESTIONS
1.What information is embodied in a budget line? What shifts occur in the budget line when
money income (a) increases and (b) decreases? What shifts occur in the budget line when the
price of the product shown on the vertical axis (c) increases and (d) decreases? LO6
Answer: A budget line shows all the combinations of any two products that a consumer
can purchase, given the prices of the products and the consumer’s income.
2.What information is contained in an indifference curve? Why are such curves (a) downsloping
and (b) convex to the origin? Why does total utility increase as the consumer moves to
indifference curves farther from the origin? Why can’t indifference curves intersect? LO6
Answer: Every point on an indifference curve shows some combination of two products
that will give equal utility to a consumer; that is, each combination of the two products
has the same level of total utility. Indifference curves are:
Chapter 06 – Consumer Behavior (+ Appendix)
6A-2
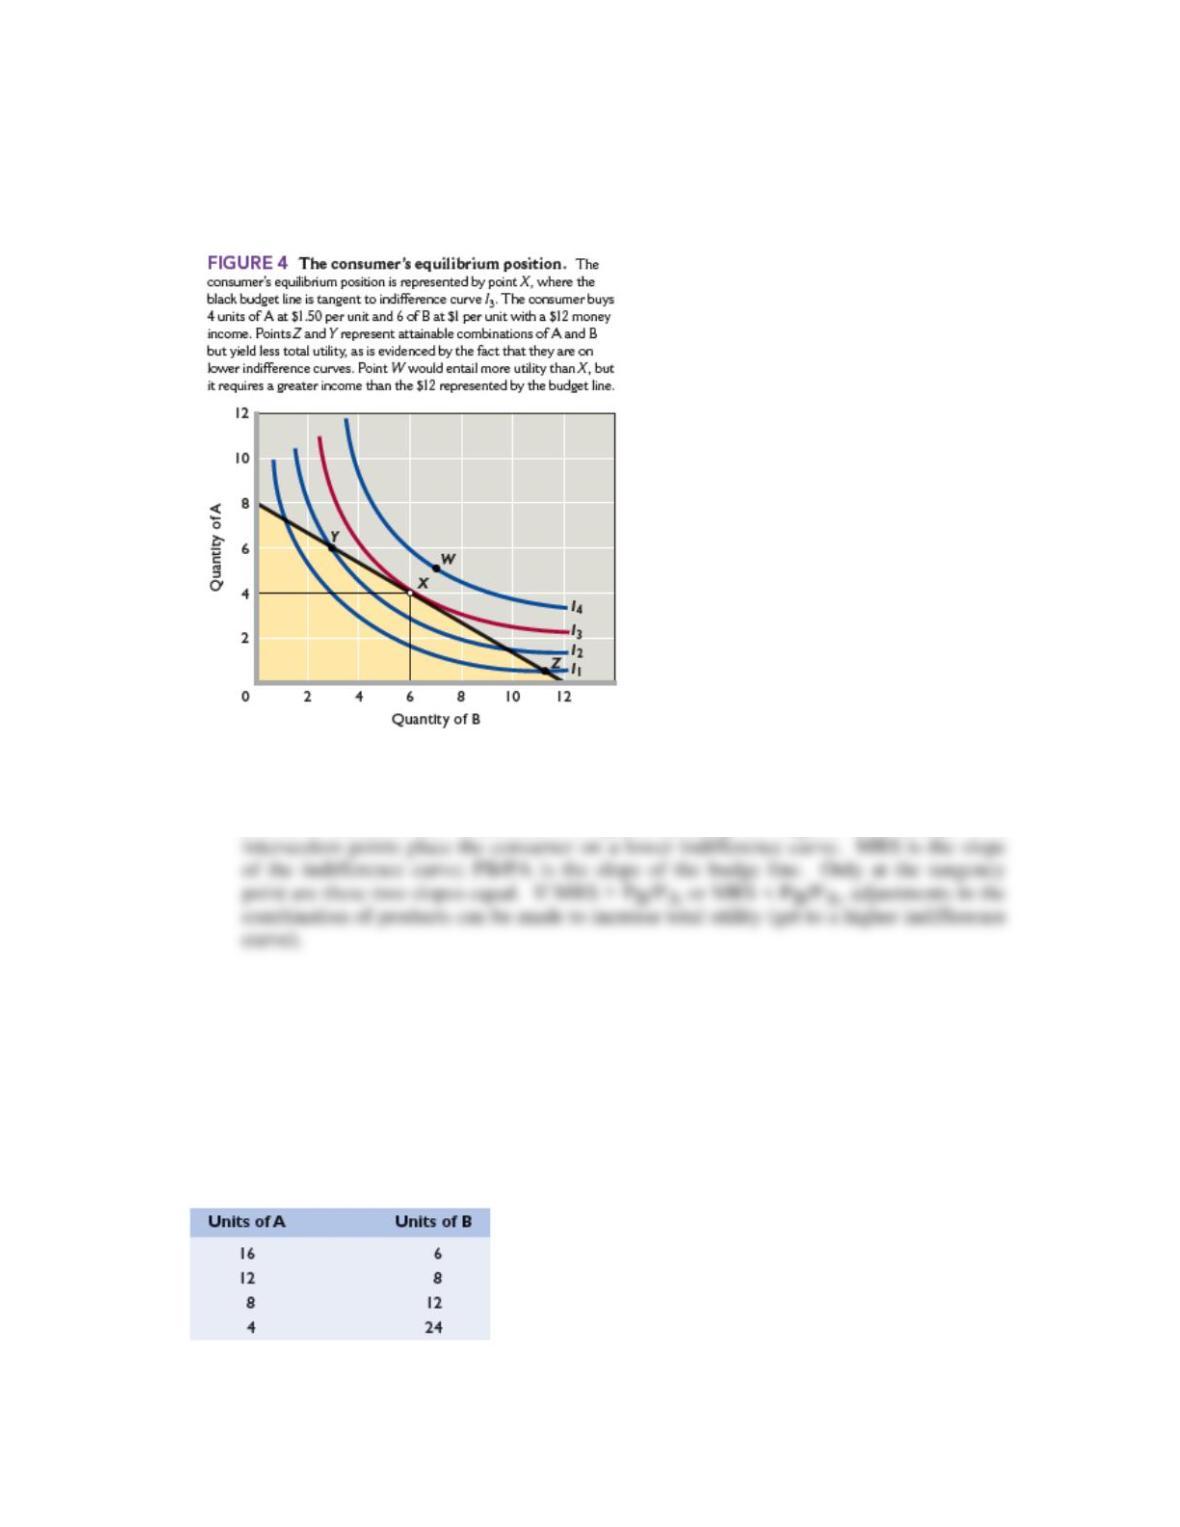
3. Using Figure 4, explain why the point of tangency of the budget line with an indifference curve
is the consumer’s equilibrium position. Explain why any point where the budget line intersects an
indifference curve is not equilibrium. Explain: “The consumer is in equilibrium where MRS=
PB/PA.” LO6
Answer: The tangency point places the consumer on the highest attainable indifference
curve; it identifies the combination of goods yielding the highest total utility. All
PROBLEMS
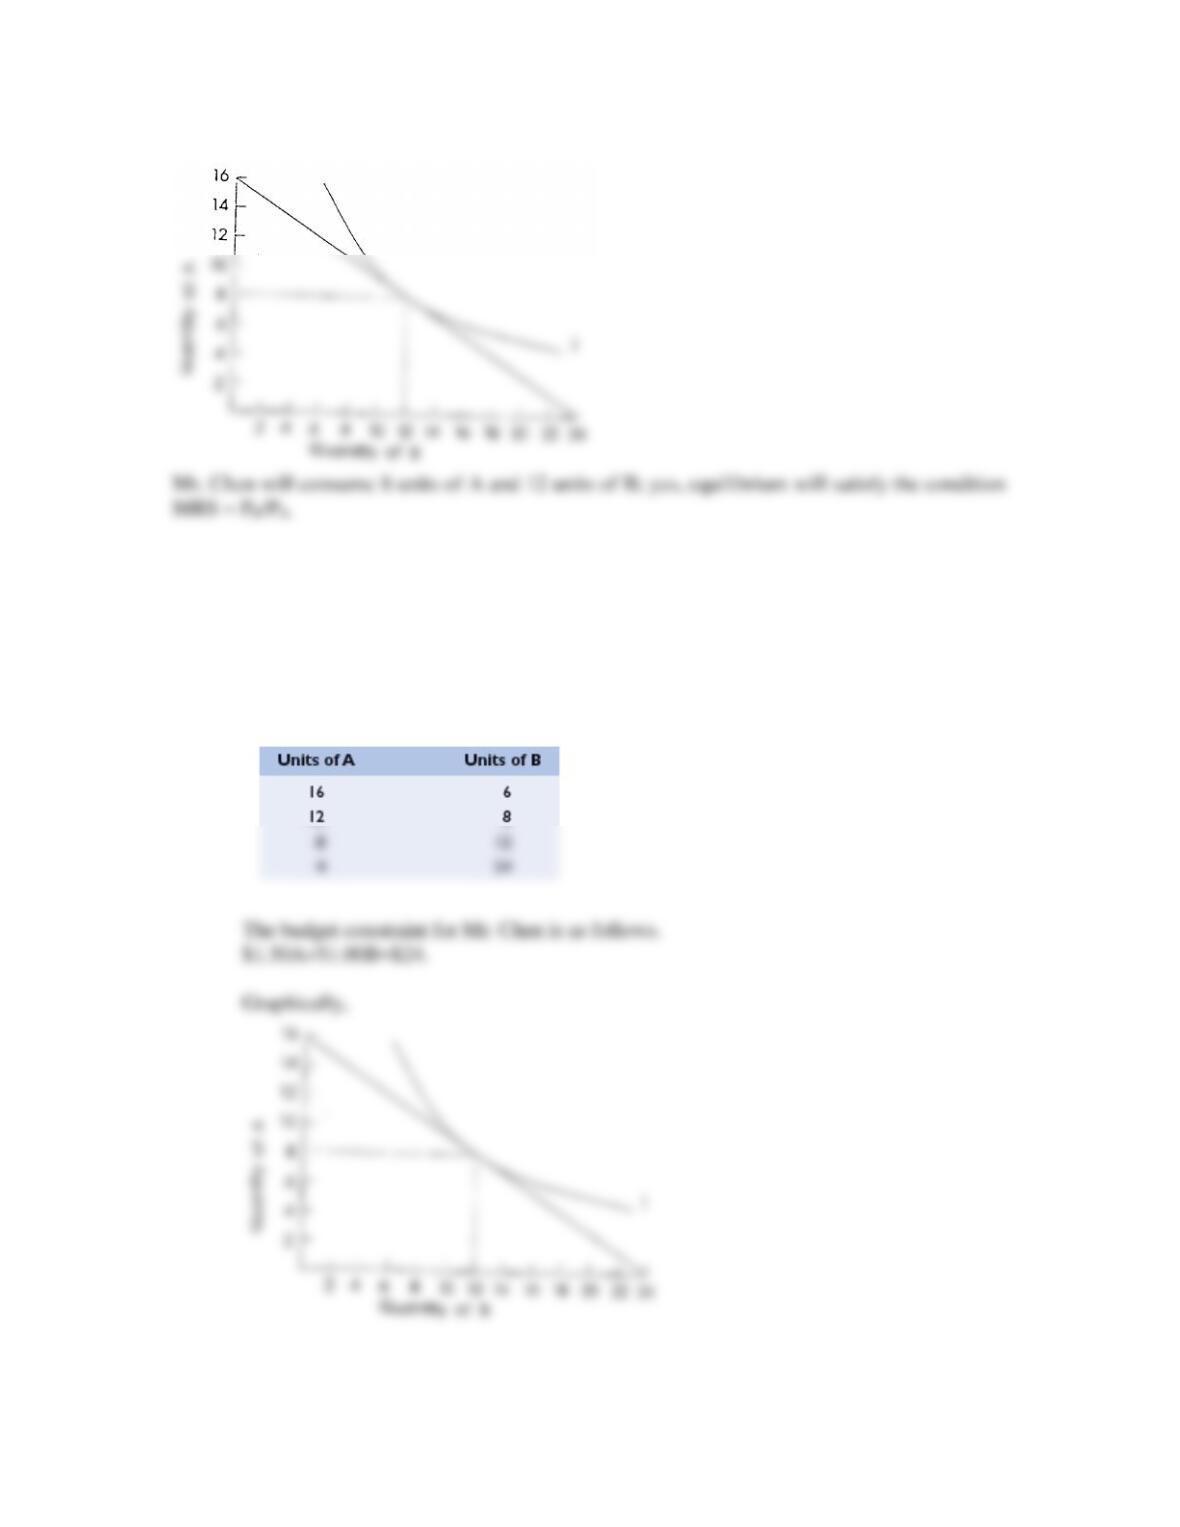
1.Assume that the data in the accompanying table give an indifference curve for Mr. Chen. Graph
this curve, putting A on the vertical axis and B on the horizontal axis. Assuming that the prices of
A and B are $1.50 and $1, respectively, and that Mr. Chen has $24 to spend, add his budget line
to your graph. What combination of A and B will Mr. Chen purchase? Does your answer meet the
MRS =PB/PA rule for equilibrium? LO6
Chapter 06 – Consumer Behavior (+ Appendix)
6A-3
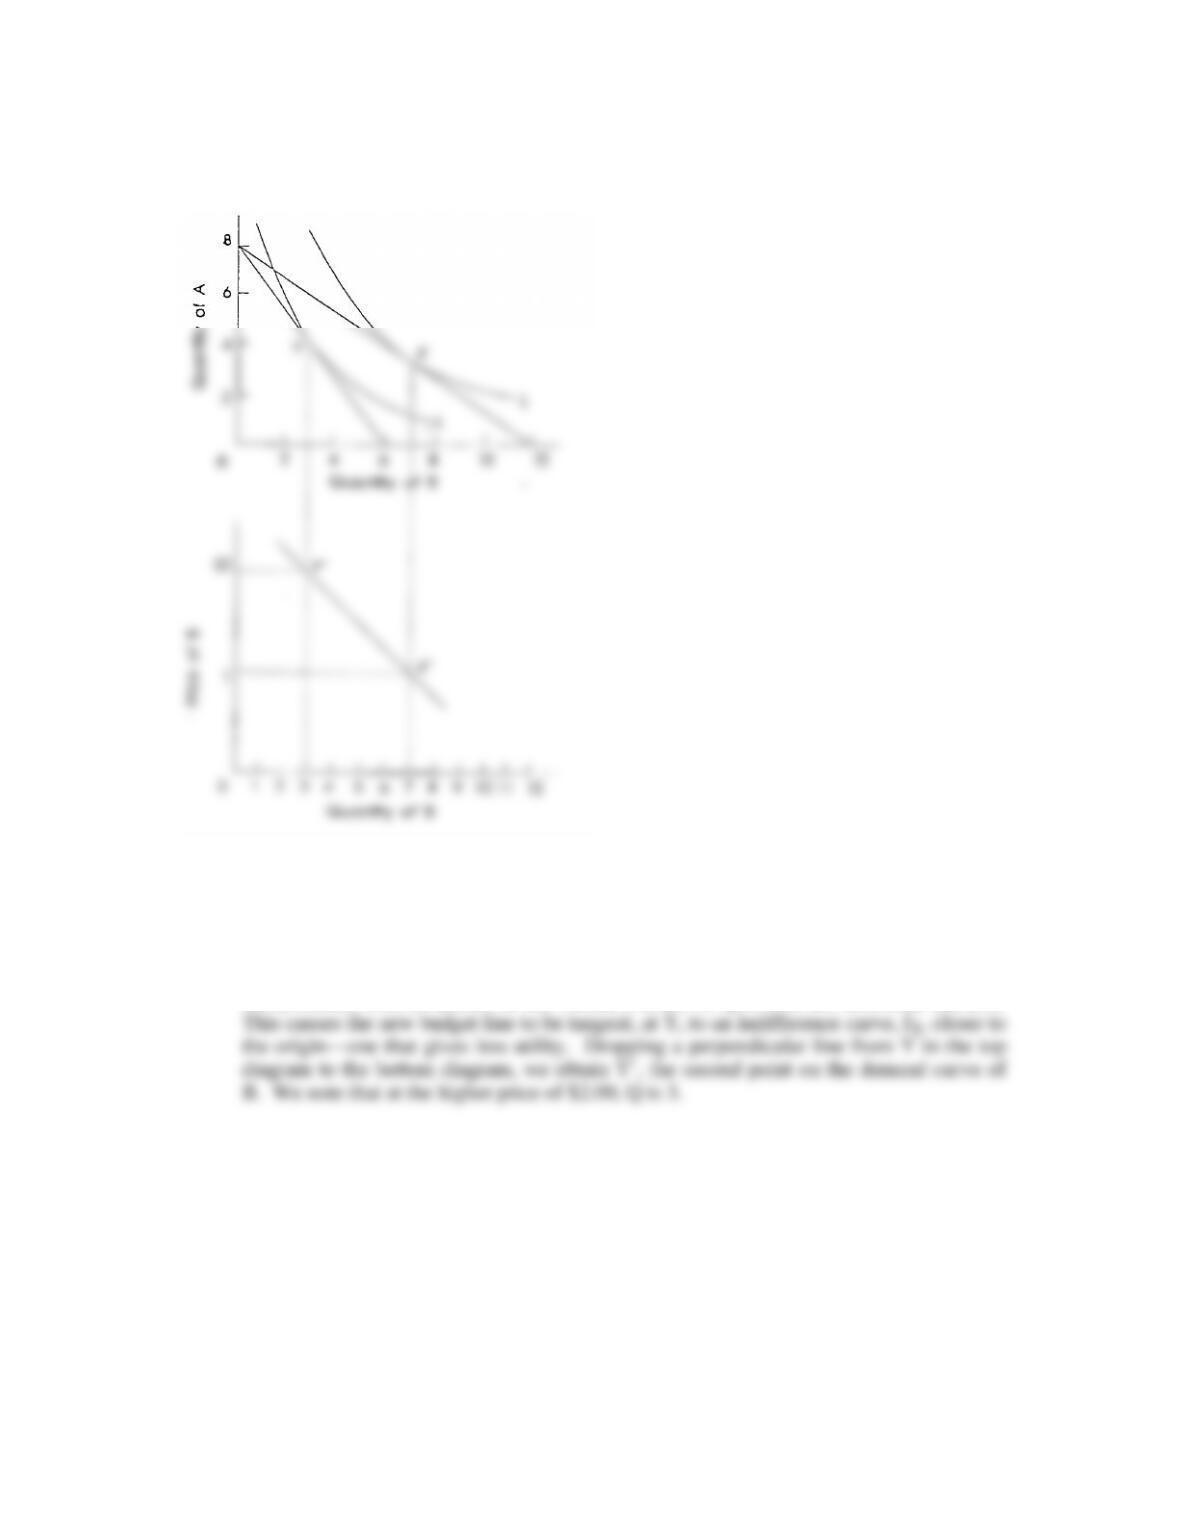
Answer: The budget constraint for Mr. Chen is $24.
Feedback: Consider the following example. Assume that the data in the accompanying
table give an indifference curve for Mr. Chen. Graph this curve, putting A on the vertical
axis and B on the horizontal axis. Assuming that the prices of A and B are $1.50 and $1,
respectively, and that Mr. Chen has $24 to spend, add his budget line to your graph. What
combination of A and B will Mr. Chen purchase? Does your answer meet the MRS
=PB/PA rule for equilibrium?
Chapter 06 – Consumer Behavior (+ Appendix)
6A-4
Combination 16 units of A and 6 units of B: Substituting these values into the budget
constraint
$1.50×16 + $1.00×6 = $30 > $24 (not affordable) Cannot be optimal bundle.
Combination 12 units of A and 8 units of B: Substituting these values into the budget
constraint
$1.50×12 + $1.00×8 = $26 > $24 (not affordable) Cannot be optimal bundle.
Chapter 06 – Consumer Behavior (+ Appendix)
6A-5
2. Explain graphically how indifference analysis can be used to derive a demand curve. LO6
Answer:
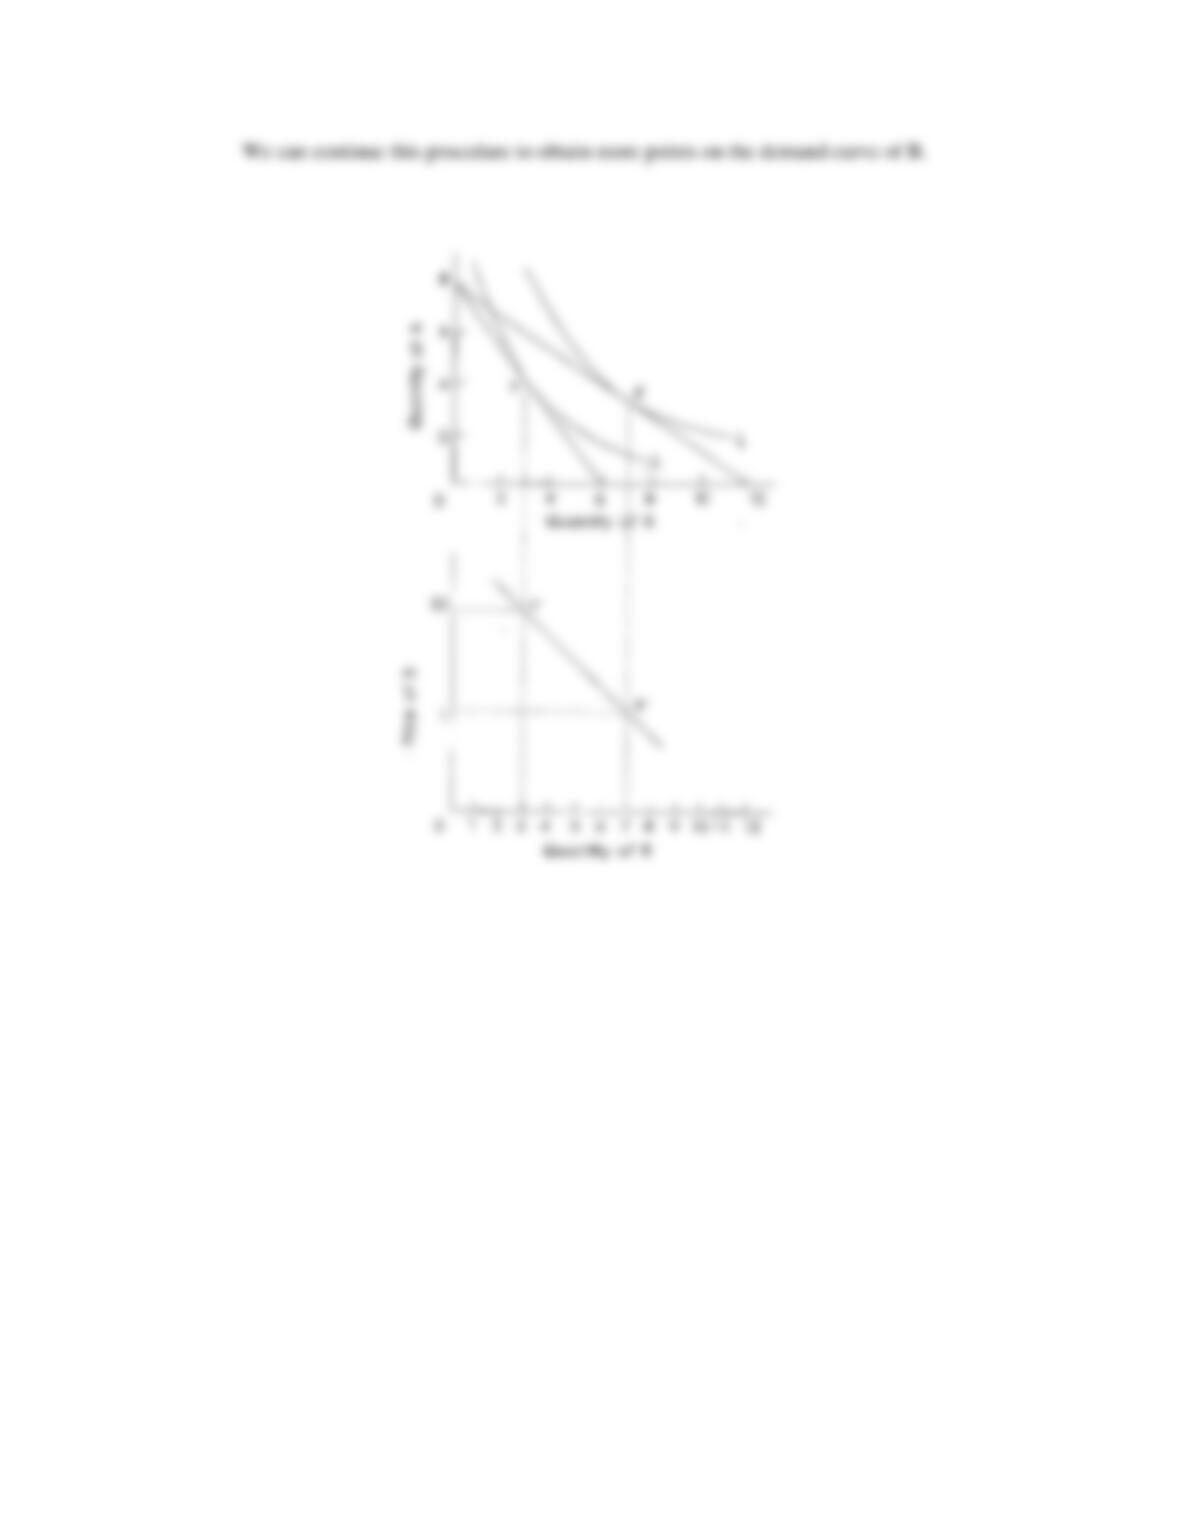
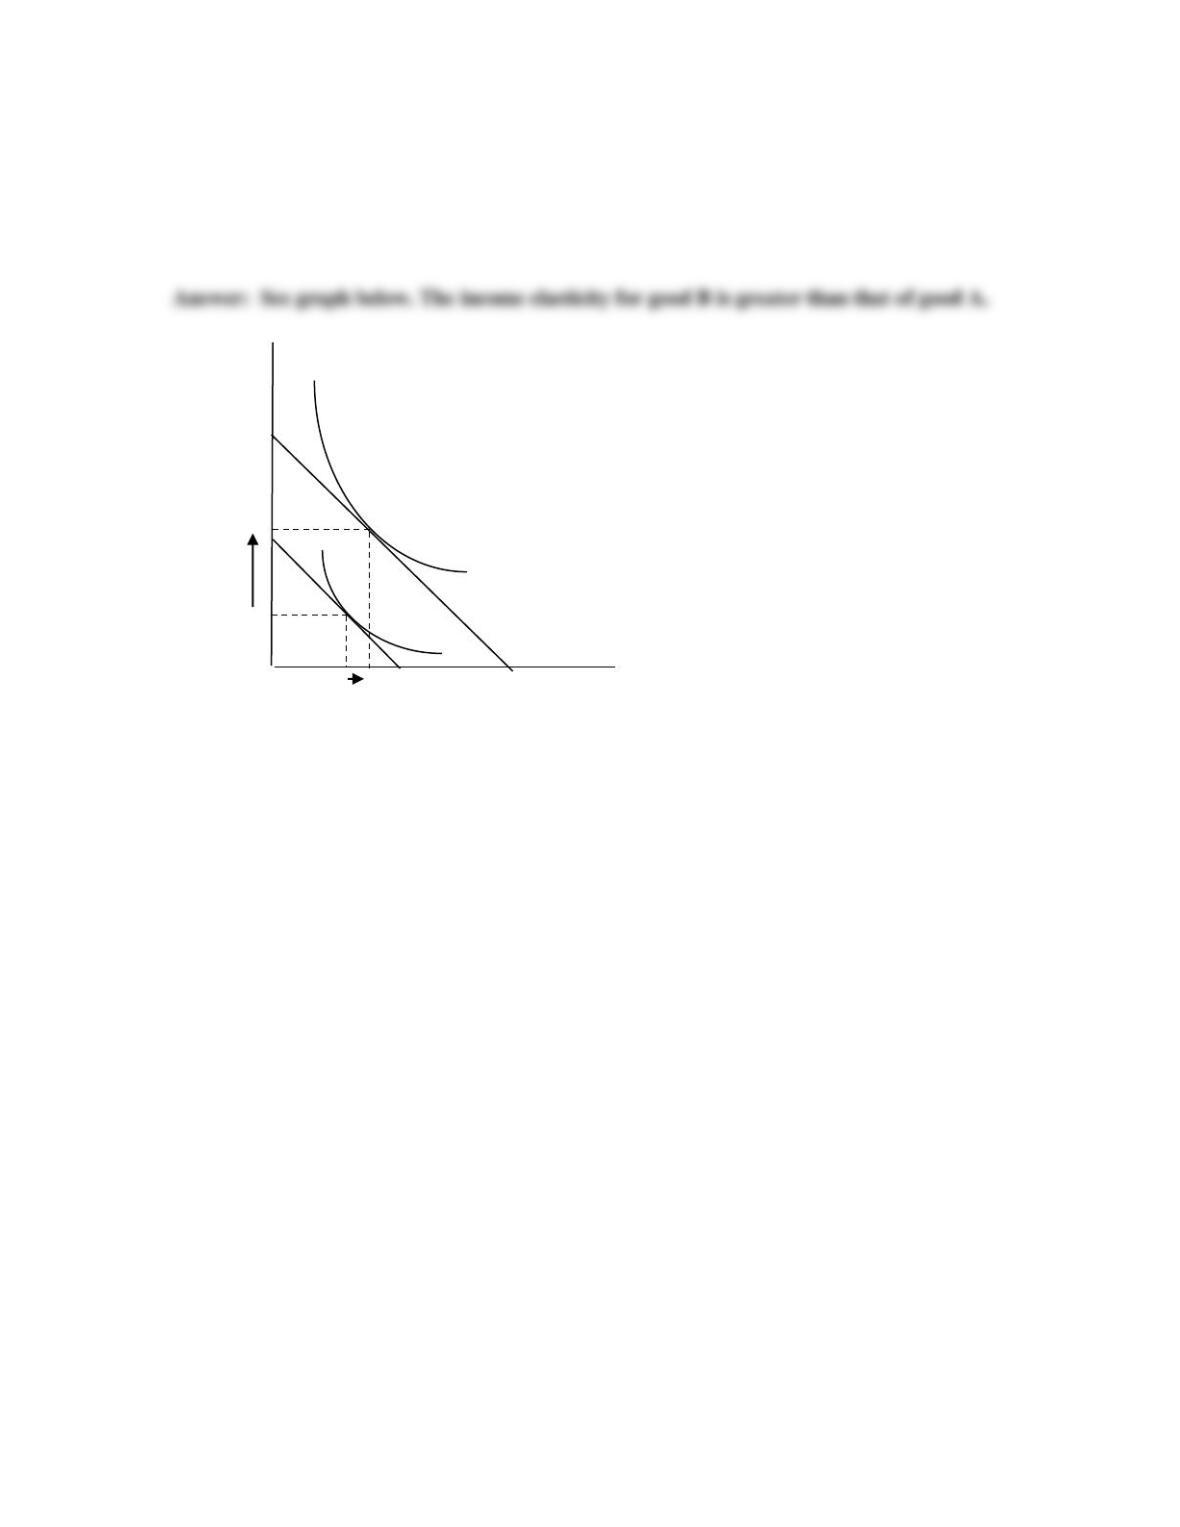
Feedback: In the top graph appearing below, the initial equilibrium is at X, where the
budget line is tangent to indifference curve I2. Money income is $12; the price of A is
$1.50 and the price of B is $1.00. Dropping a perpendicular from X in the top diagram to
the bottom diagram, we obtain X’, a point on the demand curve of B. We note that at the
price of $1.00, Q is 7.
We now assume that the price of B rises to $2.00, causing the budget line to fan to the
left (inwards) from its anchor on the vertical (A) axis to Q of 6 on the horizontal (B) axis.
Chapter 06 – Consumer Behavior (+ Appendix)
6A-6
Chapter 06 – Consumer Behavior (+ Appendix)
6A-7
3. ADVANCED ANALYSIS First, graphically illustrate a doubling of income without price
changes in the indifference curve model. Next, on the same graph, show a situation in which the
person whose indifference curves you are drawing buys considerably more of good B than good
A after the income increase. What can you conclude about the relative coefficients of the income
elasticity of demand for goods A and B (Chapter 4)? LO6
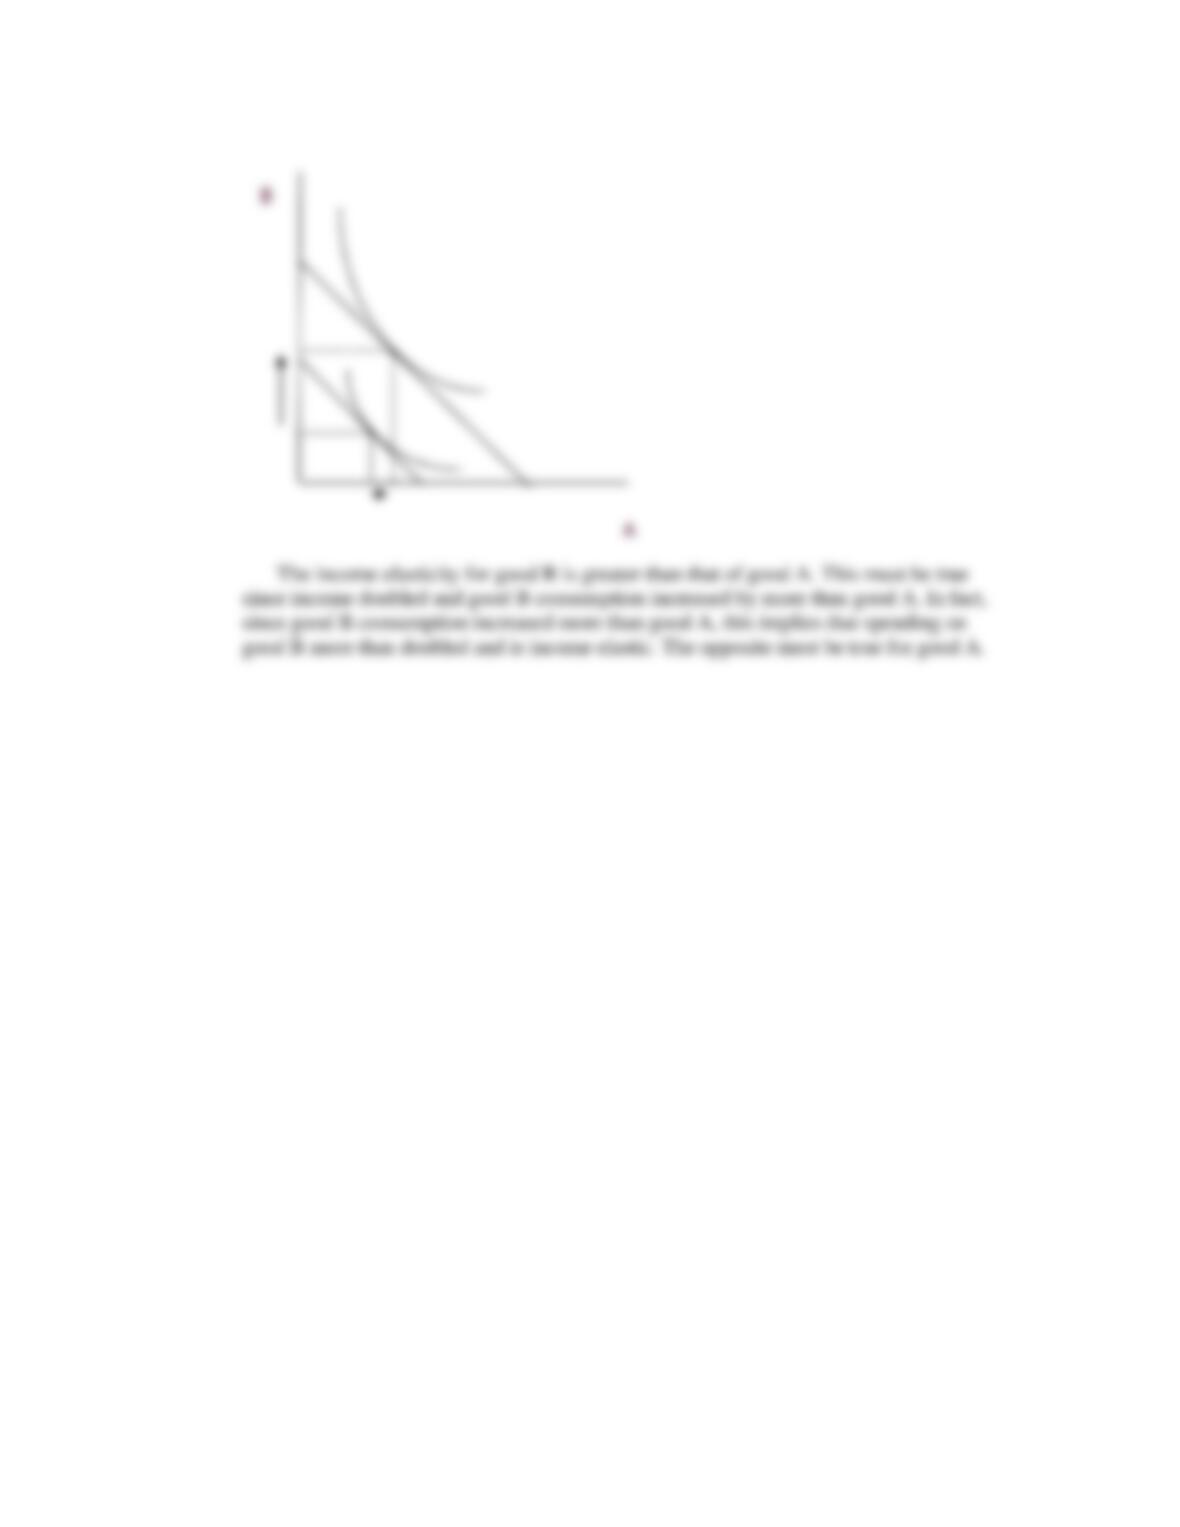
Feedback: Consider the following example. First, graphically illustrate a doubling of
income without price changes in the indifference curve model. Next, on the same graph,
show a situation in which the person whose indifference curves you are drawing buys
considerably more of good B than good A after the income increase. What can you
conclude about the relative coefficients of the income elasticity of demand for goods A
and B (Chapter 4)?
B
A
Chapter 06 – Consumer Behavior (+ Appendix)
6A-8