CHAPTER 6: LONG–RUN ECONOMIC GROWTH
LEARNING OBJECTIVES
I. Goals of Chapter 6
A. Identify forces that determine the growth rate of an economy
1. Changes in productivity are key
TEACHING NOTES
I. The Sources of Economic Growth (Sec. 6.1)
A. Production function Y = AF(K, N) (6.1)
1. Decompose into growth rate form
ΔY/Y = ΔA/A + aKΔK/K + aNΔN/N (6.2)
2. The terms aK and aN are the elasticities of output with respect to the
B. Growth accounting
1. Four steps in breaking output growth into its causes (productivity
growth, capital input growth, labour input growth) (Table 6.2)
a. Get data on ΔY/Y, ΔK/K and ΔN/N, adjusting for quality changes
Numerical Problems 1 and 2 are growth accounting exercises.
2. Application: Growth accounting and the East Asian “miracle”
a. The East Asian “tigers” (Hong Kong, Singapore, South Korea,
and Taiwan) have all grown over 7% per year for 25 years

Long–Run Economic Growth 95
(2) Pre-1956 growth was less, and post-1980 growth was less
(3) Productivity growth has declined
(a) 1926–1956: 2.7%
5. The Post-1973 Slowdown in Productivity Growth
a. Measurement problems: inadequate accounting for quality
improvements
b. Technological depletion and slow commercial adaptation:
Policy Application
Paul Krugman, “The Myth of Asia’s Miracle,” Foreign Affairs, Nov/Dec 1994, pp. 62–78,
provides a readable summary of Alwyn Young’s work on growth accounting in Asia. He
Theoretical Application
Growth accounting provides the basis for the real business cycle (RBC) model of the
96 Chapter 6
Data Application
Michael Denny et al in “Productivity in Manufacturing industries, Canada, Japan, and
the U.S. 1953-86: Was the ‘productivity slowdown’ reversed?” Canadian Journal of
II. Growth Dynamics: The Neoclassical Growth Model (Sec. 6.2)
A. Three basic questions about growth
1. What’s the relationship between the long-run standard of living and the
B. Setup of the model
1. Basic assumptions and variables
a. Population and work force grow at same rate n
2. The production function
a. Yt = AtF(Kt,Nt) (6.4)
Numerical Problem 5, 6, and Analytical Problem 6 work with the per-worker production
function.
3. Steady states
a. Steady state: yt, ct, and kt, are constant over time
b. Gross investment must
(1) Replace worn out capital, dKt
(2) Expand so the capital stock grows as the economy grows,
Long–Run Economic Growth 97
4. Reaching the steady state
a. Suppose saving is proportional to current income: St = sYt (6.9),
where s is the saving rate which is between 0 and 1
b. Equating saving to investment gives sYt = (n + d)Kt (6.10)
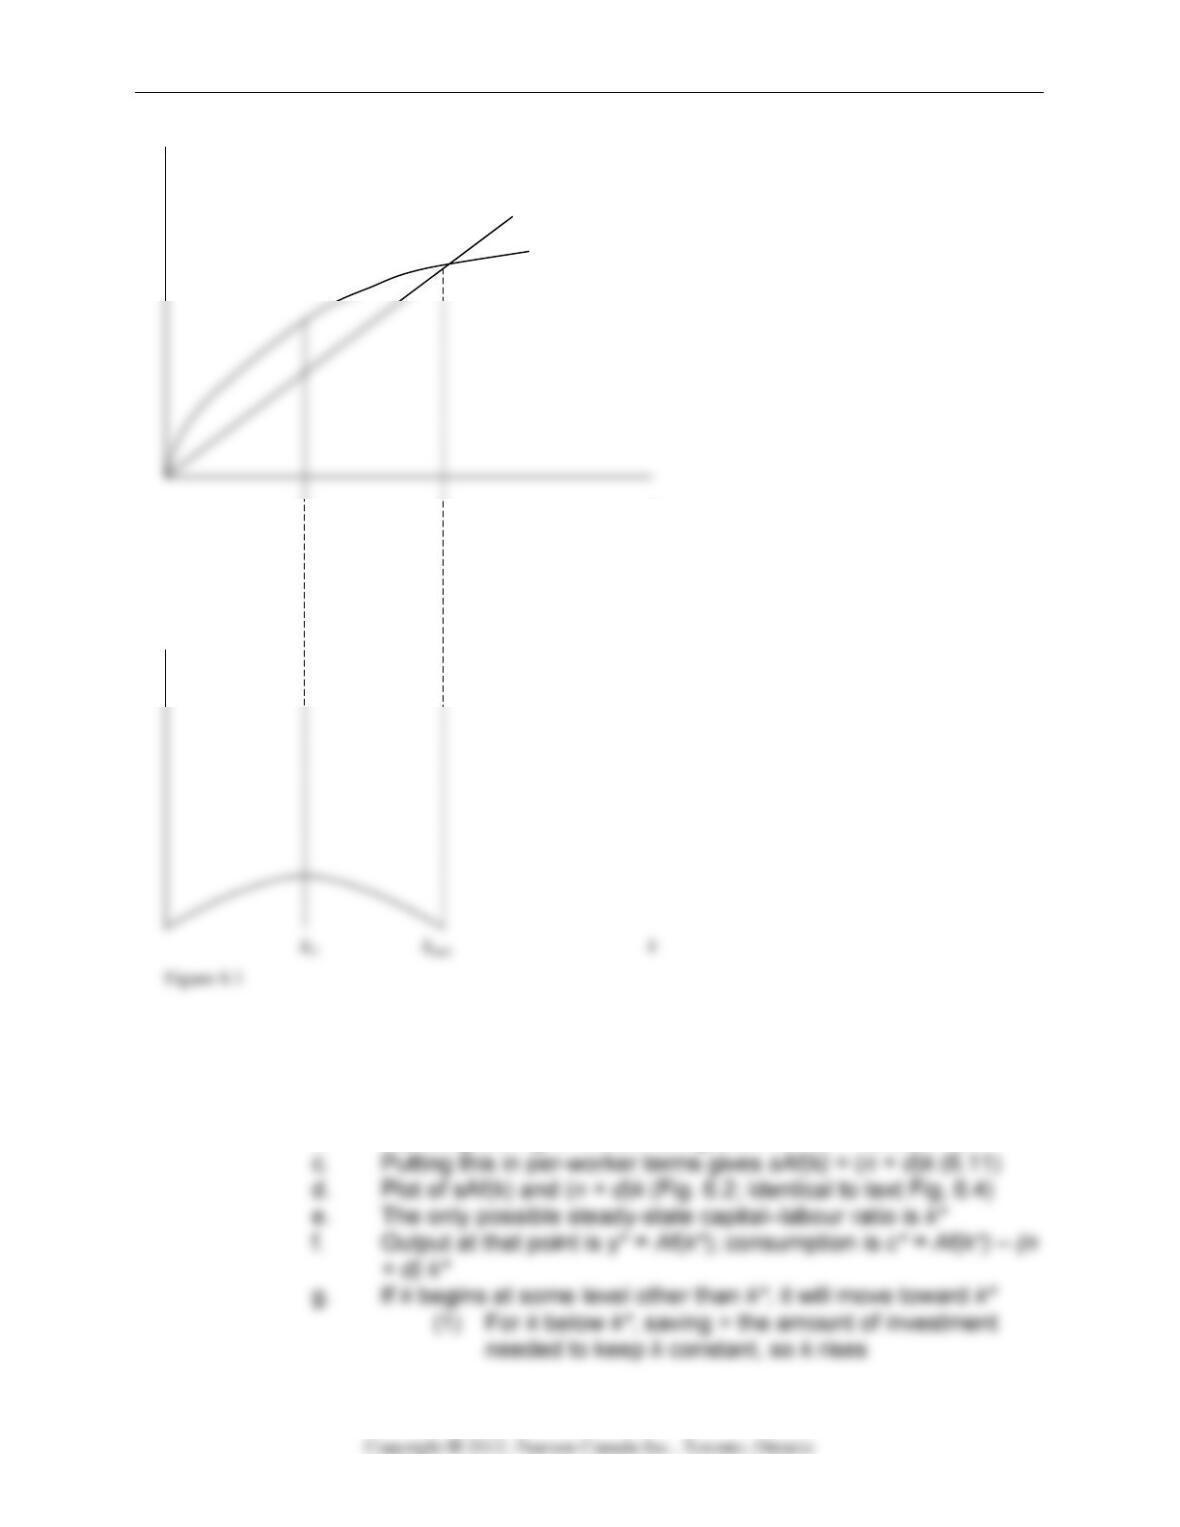
(n+d)k
y=Af(k)
c
k
y, (n+d)k
98 Chapter 6
y=Af(k)
(n+d)k)
Figure 6.2
(2) For k above k*, saving < the amount of investment
needed to keep k constant, so k falls
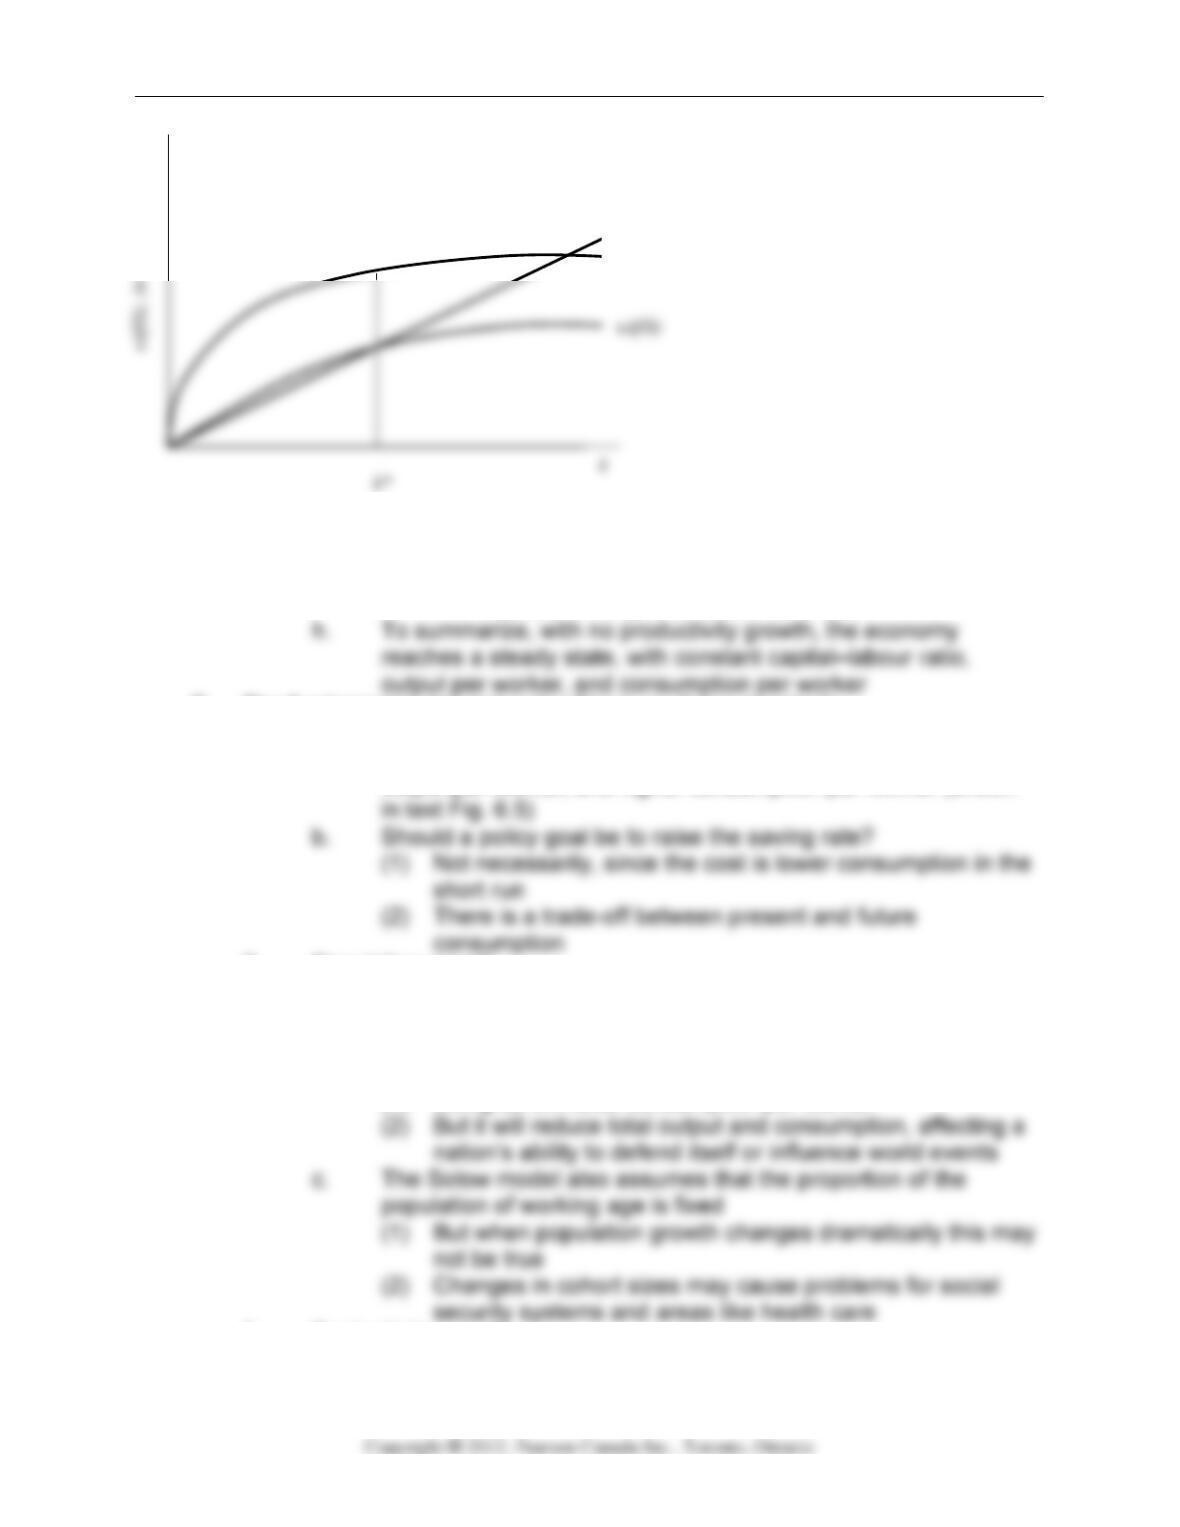
C. The fundamental determinants of long-run living standards
1. The saving rate
a. Higher saving rate means higher capital–labour ratio, higher
output per worker, and higher consumption per worker (shown
2. Population growth
a. Higher population growth means a lower capital–labour ratio,
lower output per worker, and lower consumption per worker
(shown in text Fig. 6.6)
b. Should a policy goal be to reduce population growth?
(1) Doing so will raise consumption per worker
3. Productivity growth
a. The key factor in economic growth is productivity improvement
Long–Run Economic Growth 99
b. Productivity improvement raises output per worker for a given
level of the capital–labour ratio
c. In equilibrium, productivity improvement increases the capital–
labour ratio, output per worker, and consumption per worker
(1) Productivity improvement directly improves the amount that
can be produced at any capital–labour ratio
Analytical Problems 1,2, 3, and 4 look at how changes in the fundamentals affect an
economy’s economic growth.
4. Application: Do economies converge?
a. Unconditional convergence: Poor countries eventually catch up
to rich countries
(1) This should occur if saving rates, population growth rates,
and production functions are the same worldwide
(2) Then, even though they start with different capital–labour
b. Conditional convergence: Living standards will converge in
countries with similar characteristics [s, n, d, Af(k)]
(1) Countries with different fundamental characteristics will not
converge
(2) So a poor country can catch up to a rich country if both
have the same saving rate, but not to a rich country with a
100 Chapter 6
(3) Support for conditional convergence among states in the
United States (Barro and Sala-i-Martin, 1992)
Data Application
Looking at the performance of Canadian provinces, Serge Coulombe and Frank C. Lee
(4) Since there’s little support for unconditional convergence,
international financial markets must be imperfect (clue to
limits on foreign investment by governments, tariff barriers,
and information costs)
Data Application
Lant Pritchett, “Divergence, Big Time,” Journal of Economic Perspectives, Summer
Analytical Problem 5 takes a look at convergence.
D. Endogenous growth theory—explaining the sources of productivity growth
1. Human capital
a. Knowledge, skills, and training of individuals
Theoretical Application
For a readable discussion of the Solow-Swan model and several simple endogenous
growth models, see Charles Jones, Introduction to Economic Growth, New York: W.W.
Norton, 1998. In addition to presenting current research on economic growth in an
accessible fashion, the text also presents and discusses relevant empirical evidence.
2. Technological innovation
a. Research and development programs: formal programs to
improve products
Long–Run Economic Growth 101
A. Economic growth and the environment
a. Economic growth may be limited by available stocks of natural
resources or by the environment.
III. Government Policies to Raise Long-Run Living Standards (Sec. 6.3)
A. Policies to affect the saving rate
1. If the private market is efficient, the government shouldn’t try to change
the saving rate
2. How can saving be increased?
a. One way is to raise the real interest rate to encourage saving;
B. Policies to raise the rate of productivity growth
1. Improving infrastructure
a. Infrastructure: highways, bridges, utilities, dams, airports
b. Empirical studies suggest a link between infrastructure and
the main determinant
2. Building human capital
a. There’s a strong connection between productivity and human
capital
102 Chapter 6
Policy Application
Many issues relating to government policy and its effect on growth are discussed in a
special issue of the Journal of Monetary Economics, December 1993. The articles were
presented z a World Bank Conference on the research project, “How Do National
Policies Affect Long-Run Growth?”
4. Industrial policy
A growth strategy in which government uses taxes, subsidies, or
regulation to influence economic development
a. Some argue that government should promote high-tech industry
b. But others think the free market allocates resources well without
5. Market policy
Policy stipulating the extent to which government can restrict the free
operation of markets
a. Market policies include the choice of free versus regulated
markets and the choice of free trade versus protectionism
b. Why might government interference with the free operation of
markets be desirable?
(1) Unfettered operation of markets may result in a highly
Long–Run Economic Growth 103
e. Free trade is a productivity-enhancing market policy because it
encourages industries to specialize in the production of goods
ADDITIONAL ISSUES FOR CLASSROOM DISCUSSION
1. Is Growth Always Beneficial?
A major goal of most countries is to have sustained growth in the level of GDR Is this an
appropriate goal for all countries in all periods? What problems can growth bring?
2. Noneconomic Factors in Growth
Economic models highlight growth that comes about because of changes in the inputs
of capital and labour or in productivity. Political and social changes may affect growth
and productivity as well. What noneconomic factors are important in growth?
Items such as attitudes toward work, the political climate, and the availability of
104 Chapter 6
3. How Do Increases in Productivity Come About?
An important part of growth comes from increases in productivity. What causes growth
in productivity?
Some increases in productivity come from new equipment. For example, buying a new,
faster copy machine that collates and staples may allow the graphics department to
produce more in a given period of time with fewer workers. Fax machines reduce the
5. Why Are Democracy and Growth Generally Compatible?
Research shows that democracy and growth frequently go together. Why is this true?
Democracy, in most cases, encourages freedom of expression and the exchange of
Long–Run Economic Growth 105
ANSWERS TO TEXTBOOK PROBLEMS
Review Questions
1. The three sources of economic growth are capital growth, labour growth, and
2. A decline in productivity growth is the primary reason for the slowdown in output
growth in Canada since 1973. Productivity growth may have declined because of a
3. If there is no productivity growth, then output per worker, consumption per worker,
and capital per worker will all be constant in the long run. This represents a steady
state for the economy.
4. The statement is false. Increases in the capital–labour ratio increase consumption
5. a. An increase in the saving rate increases long-run living standards, as higher
saving allows for more investment and a larger capital stock.
b. An increase in the population growth rate reduces long-run living standards, as
6. Convergence means that over time the living standards in different countries get
closer together. Unconditional convergence means that countries converge
regardless of differences in their fundamental factors (population growth rates,
7. The new growth theory suggests that the main sources of productivity growth are
accumulation of human capital (the knowledge, skills, and training of individuals) and
technological innovation (research and development, as well as learning by doing).
8. Government policies to promote economic growth include policies to raise the saving
106 Chapter 6
saving. Note that an increase in the saving rate will increase the steady-state
capital–labour ratio, but will not increase the long-run rate of economic growth.
One way that government policy can increase productivity is by spending more on
increased.
Numerical Problems
1. Hare: $5000 × (1.03)50 = $21,919.50
Tortoise: $5000 × (1.01)50 = $8,223.1
2.
20 years ago Today Percent change
Y 1000 1300 30%
3. a.
Year K N Y K/N Y/N
1 200 1000 617 0.20 0.617
2 250 1000 660 0.25 0.660
Long–Run Economic Growth 107
b.
Year K N Y K/N Y/N
1 200 1000 1231 0.20 1.231
4. To answer this problem, an approximate solution can be found by finding the ratio
GDP (1998)/GDP (1950), taking the natural logarithm of that ratio and dividing by 48
This is the answer given in the table below. [A more exact solution is found by
raising GDP ratio to the 1/48 power and subtracting one; this is now shown below.]
Real GDP per capita Growth
1950 1989 Ratio rate
Australia 7,493 20,390 2.72 2.1%
Canada 7,437 20,559 2.76 2.1%
5. a. sf(k) = (n + a)k
0.3 x 3k5 = (0.05 + 0.1)k

108 Chapter 6
c. sf(k) = (n + d)k
0.3 x 3k5 = (0.08 + 0.1)k
0.9k5 = 0.18k
c = y – (n+ d)k = 32 – (0.15 x 64) = 22.4
6. a. In steady state, sf(k) = (n + d)k
0.1 x 6k.5 = (0.01 + 0.14)k
b. To get y = 2 x 24 = 48, since y = 6k.5, then 48 = 6k.5, so k.5 = 8, so k = 64. The
double.
7. First, derive saving per worker as sy = y – c – g = [1 – 0.5(1 – t) – t] 8k.5 = 0.5(1 –
t)8k.5 = 4 (1 – t)k.5
a. When t = 0, sy = 4 (1 – 0)k.5 = 4k.5 = national saving per worker
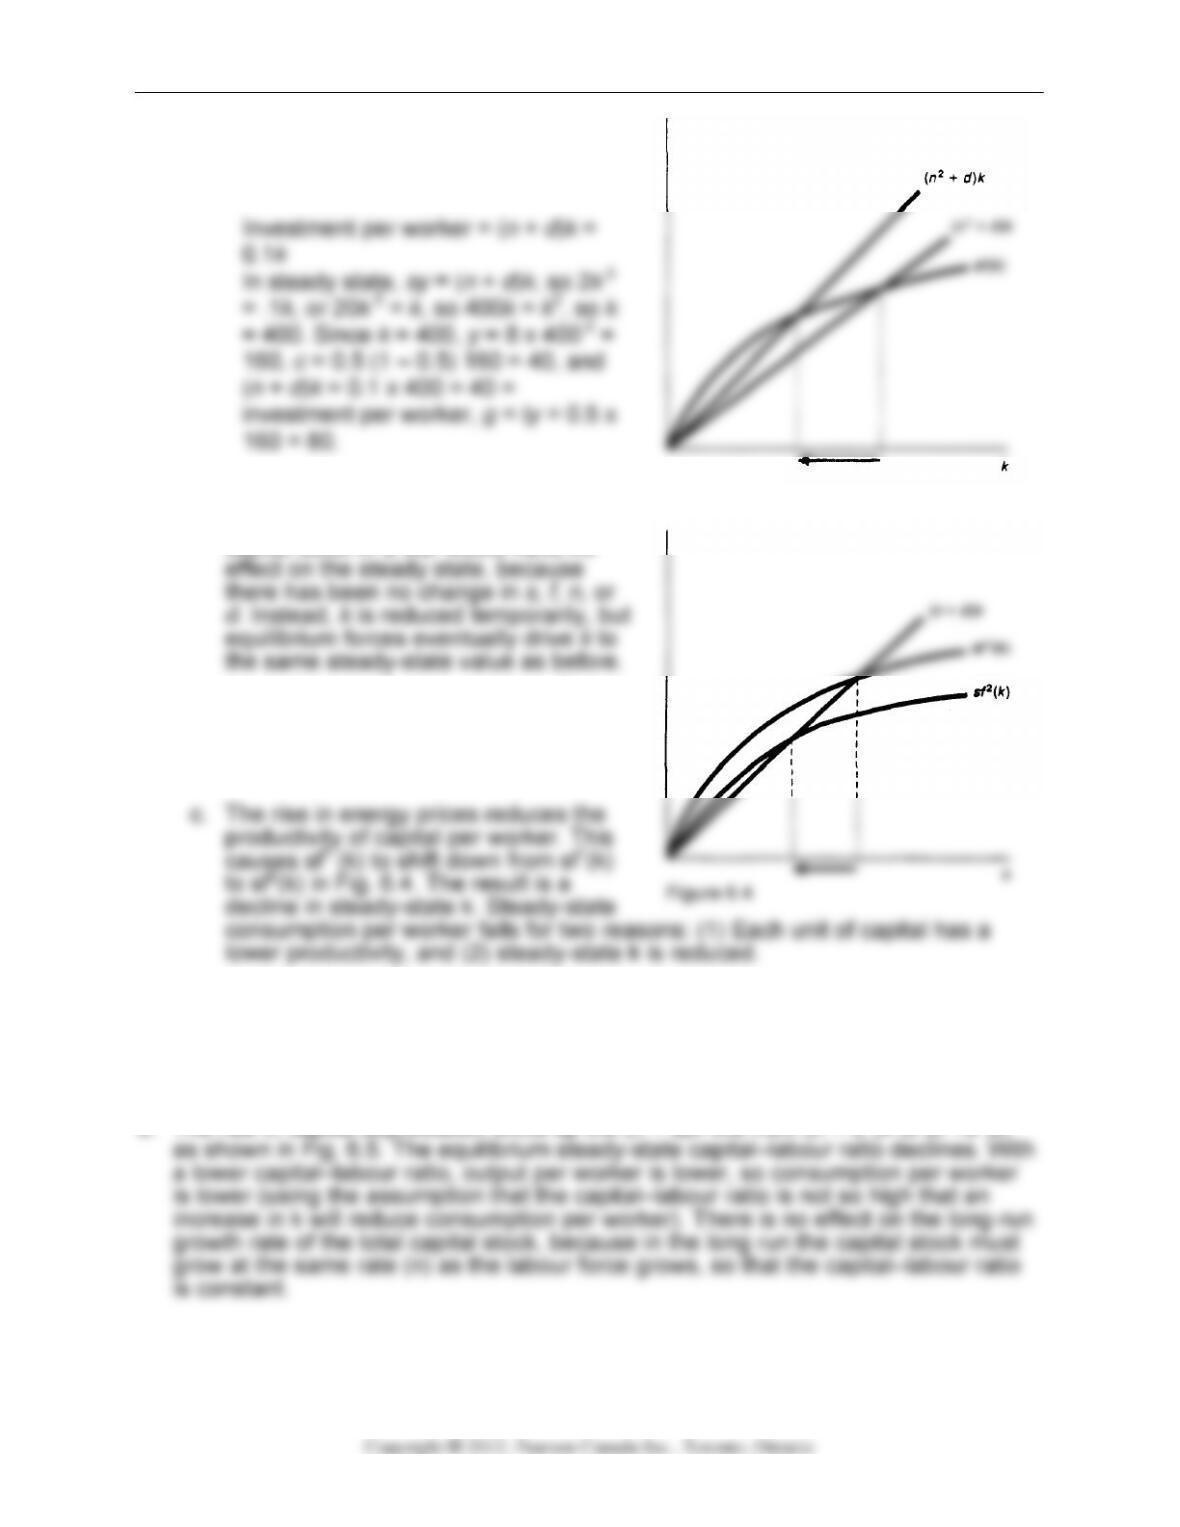
Figure 6.4
Long–Run Economic Growth 109
b. When t = 0.5, sy = 4 (1 – 0.5)k.5 =
2k.5 = national saving per worker
Analytical Problems
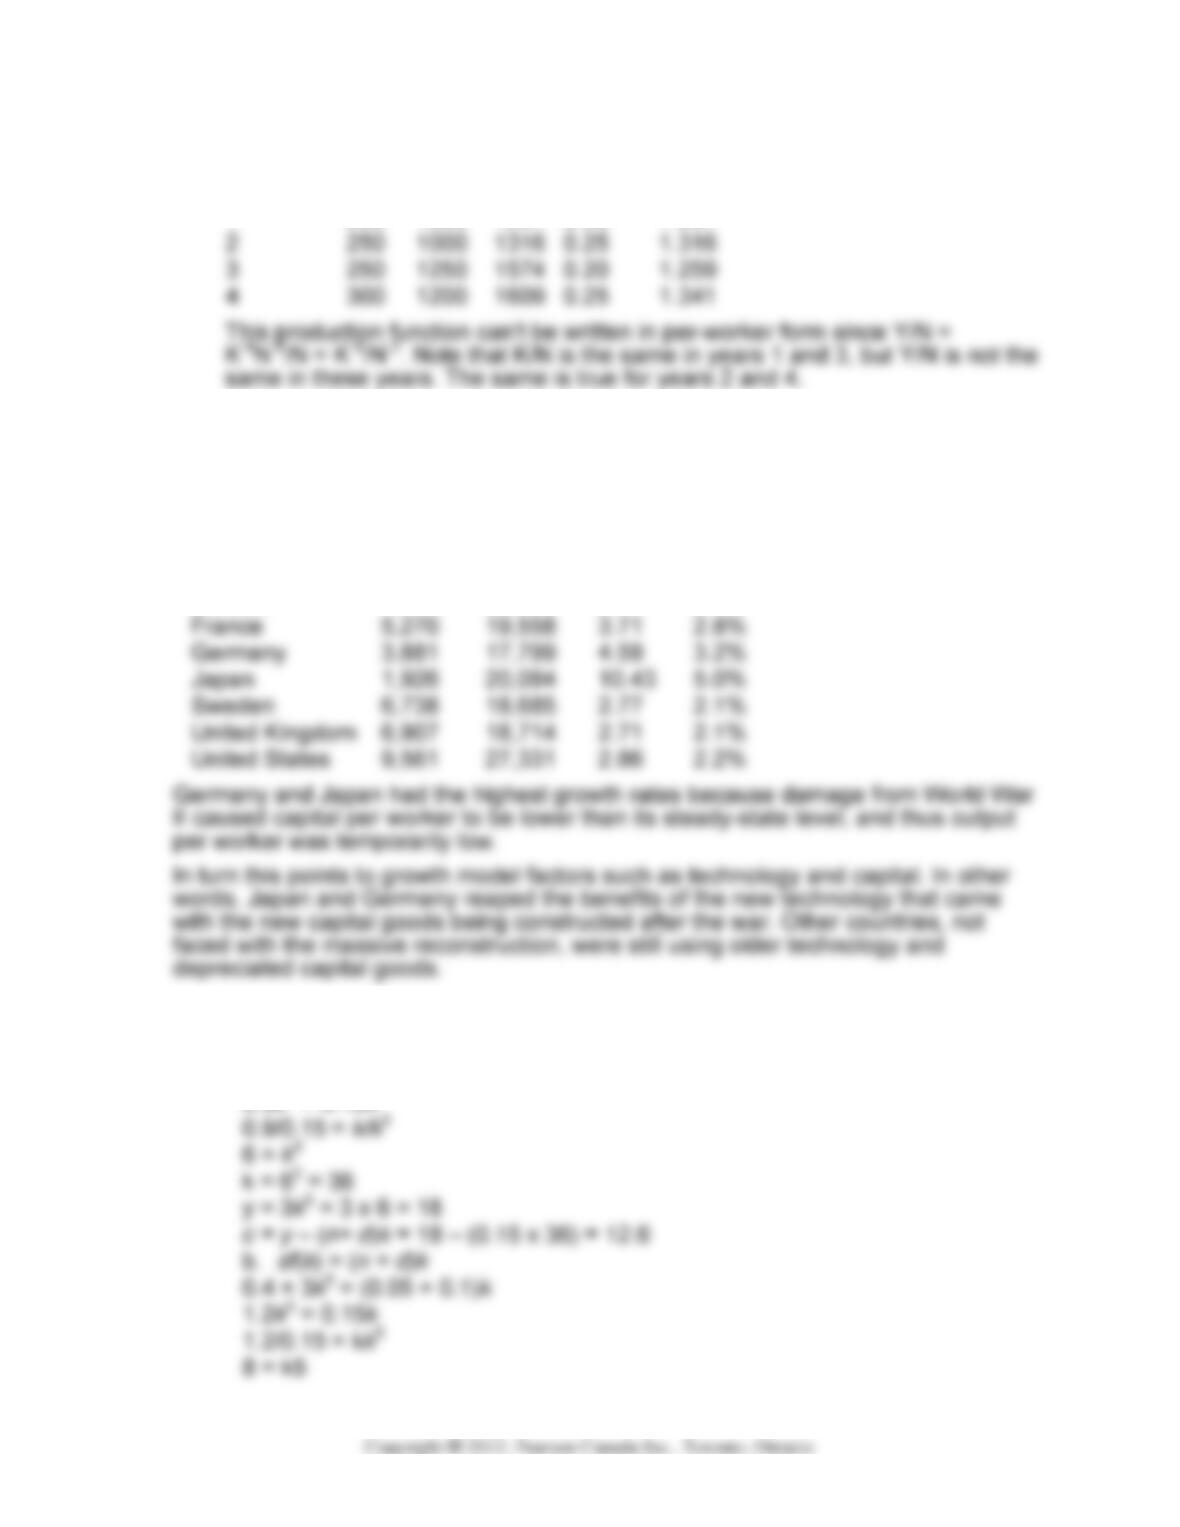
1. a. The destruction of some of a country’s
capital stock in a war would have no
b. Immigration raises n from n1 to n2 in
Fig. 6.3. The rise in n lowers steady-
state k, leading to a lower steady-state
consumption per worker.
d. A temporary rise in s has no effect on the steady-state equilibrium
e. The increase in the size of the labour force does not affect the growth rate of
the labour force, so there is no impact on the steady-state capital–labour ratio
or on consumption per worker, however, because a larger fraction of the
population is working, consumption per person increases.
Figure 6.3
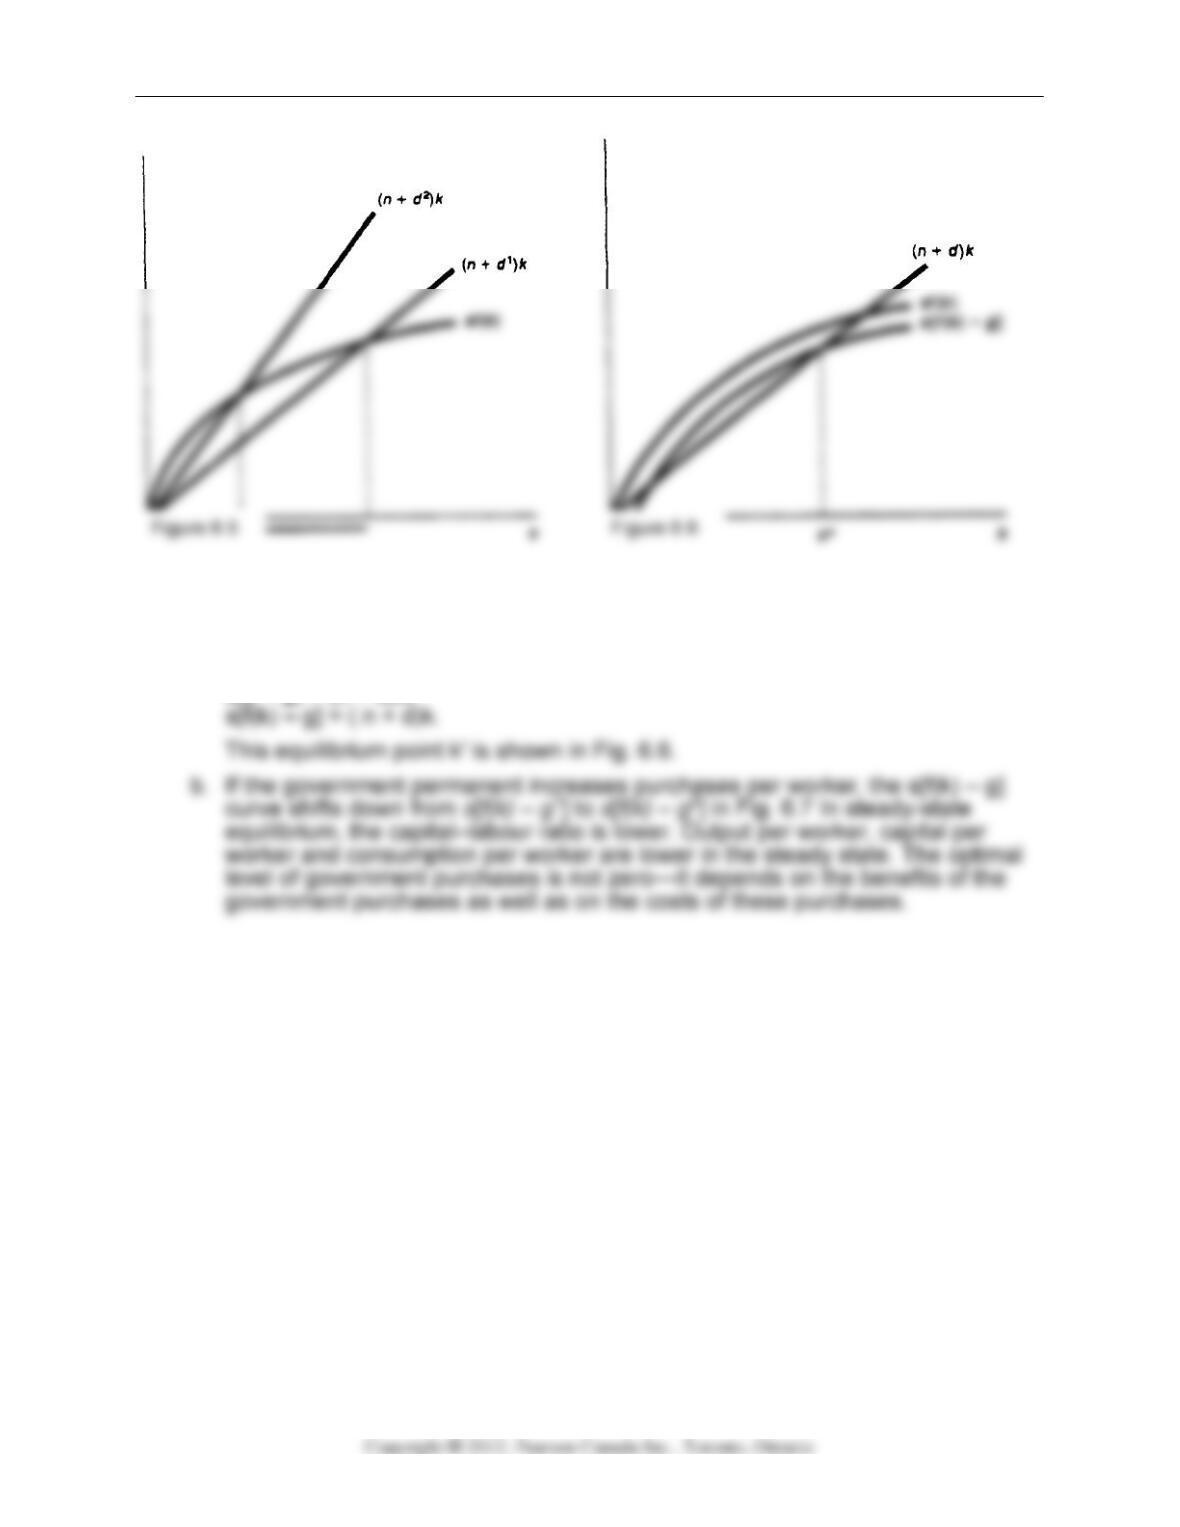
110 Chapter 6
3. a. With a balanced budget T/N = g. National saving is S = s(Y – T) = sN[(Y/N) –
(T/N)] = SN(y – g). Setting saving equal to investment gives
S = I,
sN(y – g) = (n + d)K,
s(y – g) = (n + d)k,
Long–Run Economic Growth 111
4. St = sYt – hKt = Nt(syt – hkt). Setting St = It yields Nt( syt – hkt) = (n + d)Kt. Dividing
through by Nt and eliminating time subscripts for steady-state variables gives sy – hk
= (n + d)k. Rearranging and using the expression y = f(k) gives sf(k) = (n + d+ h)k.
The steady-state value of capital per worker, k*, is given by the intersection of the (n
+ d + h)k line with the sf(k) curve, as shown
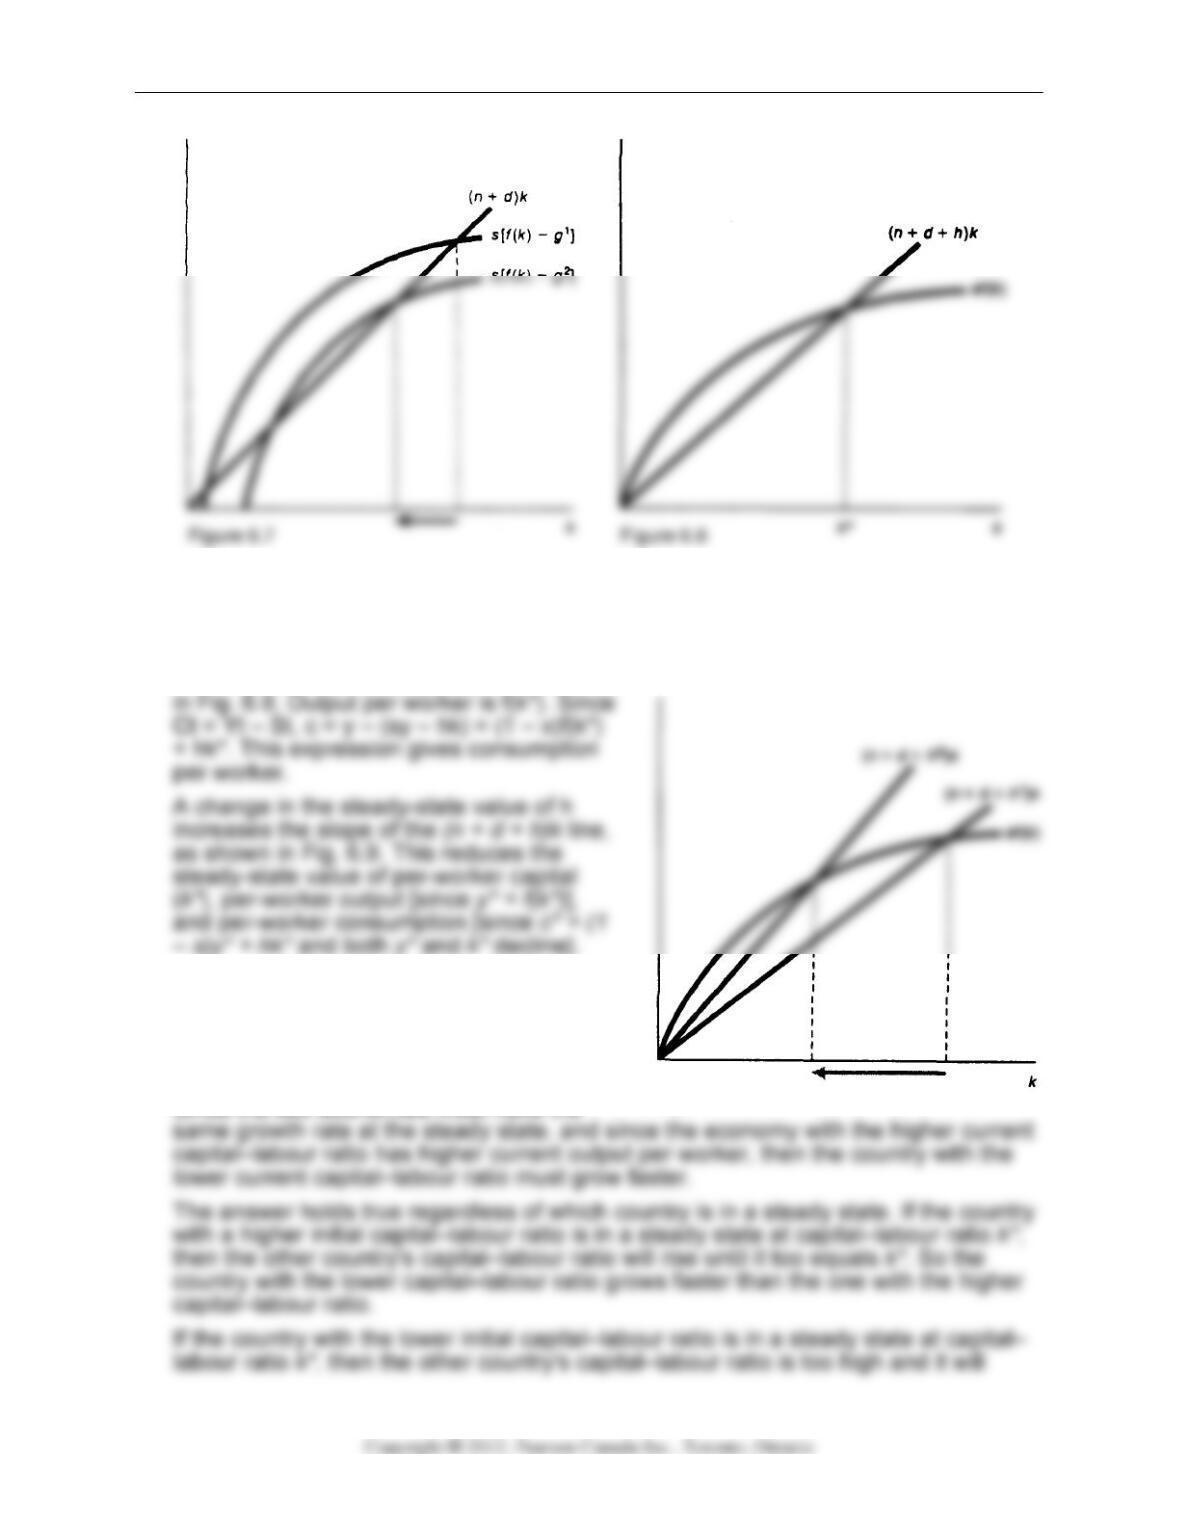
5. The initial level of the capital–labour ratio is
irrelevant for the steady state. Two
economies that are identical except for
their initial capital–labour ratios will have
exactly the same steady state.
Figure 6.7
Figure 6.8
Figure 6.9
112 Chapter 6
6. The growth accounting equation is
ΔY/Y = ΔA/A + (aKΔK/K) + (aKΔN/N)
We are just increasing the amount of capital and labour, and there is no change in
7. Assume there are a constant number of workers, N, so that Ny = Y and Nk = K.
Since y = Akah1−a and h = Bk, then y = Aka(Bk)1−a = (AB1−a)k. Then Y = Ny =
8. a. As explained in the text, a technological advance that increases productivity
causes the per capita savings and output functions to pivot upward.
Consumption per person increases at every capital–labour ratio. Thus a
productivity enhancement makes the average citizen better off, both