Chapter 5
DEMAND ESTIMATION
QUESTIONS & ANSWERS
Q5.1 Describe some of the limitations of market experiments.
Q5.1 ANSWER
Market experiments have several serious shortcomings. They are expensive and usually
undertaken on a scale too small to allow high levels of confidence in the results. Market
Q5.2 “When I go to the grocery store, I find cents–off coupons totally annoying. Why can’t
they just cut the price and do away with the clutter?” Discuss this statement and
explain why coupon promotions are an effective means of promotion for grocery
retailers, and popular with many consumers.
Q5.2 ANSWER
At the grocery store, cents-off promotions remain an effective means of promotion. A
Demand Estimation 105
real price discount!
Q5.3 Explain how shifting demand and supply curves make market demand estimation
difficult.
Q5.3 ANSWER
The identification problem relates to the difficulty encountered in properly isolating
independent variables (X factors) that influence a given dependent variable (Y factor).
Q5.4 “Rapid innovation in the development, assembly, and delivery of personal computers
has led to a sharply downward sloping market demand curve for Dell, Inc.” Discuss
this statement.
Q5.4 ANSWER
This statement is false, and reflects a basic misconception concerning the differences
between shifts in demand and movements along a demand curve. A market demand
106 Chapter 5
Q5.5 “Demand for higher education is highest among the wealthy. This has led to an upward
sloping demand curve for college education. The higher the tuition charged, the greater
is demand.” Discuss this statement.
Q5.5 ANSWER
This statement is false, and reflects a basic misconception concerning the differences
between shifts in demand and movements along a demand curve. A market demand
curve shows the relation between the price charged and the quantity demanded, holding
Q5.6 How do linear and log-linear models differ in terms of their assumptions about the
nature of demand elasticities?
Q5.6 ANSWER
The elasticity of demand is defined as the percentage change in demand following a 1
Q5.7 If a regression model estimate of total profit is $50,000 with a standard error of the
estimate of $25,000, what is the chance of an actual loss?
Q5.7 ANSWER
The standard error of the estimate can be used to determine a range within which the
Demand Estimation 107
Q5.8 A simple regression TR = a + bQ is not able to explain 19 percent of the variation in
total revenue. What is the coefficient of correlation between TR and Q?
Q5.8 ANSWER
In a simple regression model with only one independent variable the correlation
coefficient, r, measures goodness of fit. The correlation coefficient falls in the range
Q5.9 In a regression-based estimate of a demand function, the beta coefficient for advertising
equals 3.75 with a standard deviation of 1.25 units. What is the range within which
there can be 99 percent confidence that the actual parameter for advertising can be
found?
Q5.9 ANSWER
108 Chapter 5
The standard error of the estimate indicates the precision with which the regression
model can be expected to predict the dependent Y variable. The standard deviation (or
Q5.10 Managers often study the profit margin-sales relation over the life cycle of individual
products, rather than the more direct profit-sales relation. In addition to the economic
reasons for doing so, are there statistical advantages as well? (Note: Profit margin
equals profit divided by sales.)
Q5.10 ANSWER
Yes, managers study the profit margin-sales relation over the life cycle of individual
products and for individual products at any one point in time to gauge relative
profitability. High profit margins are attractive as they suggest unique product
Demand Estimation 109
SELF-TEST PROBLEMS AND SOLUTIONS
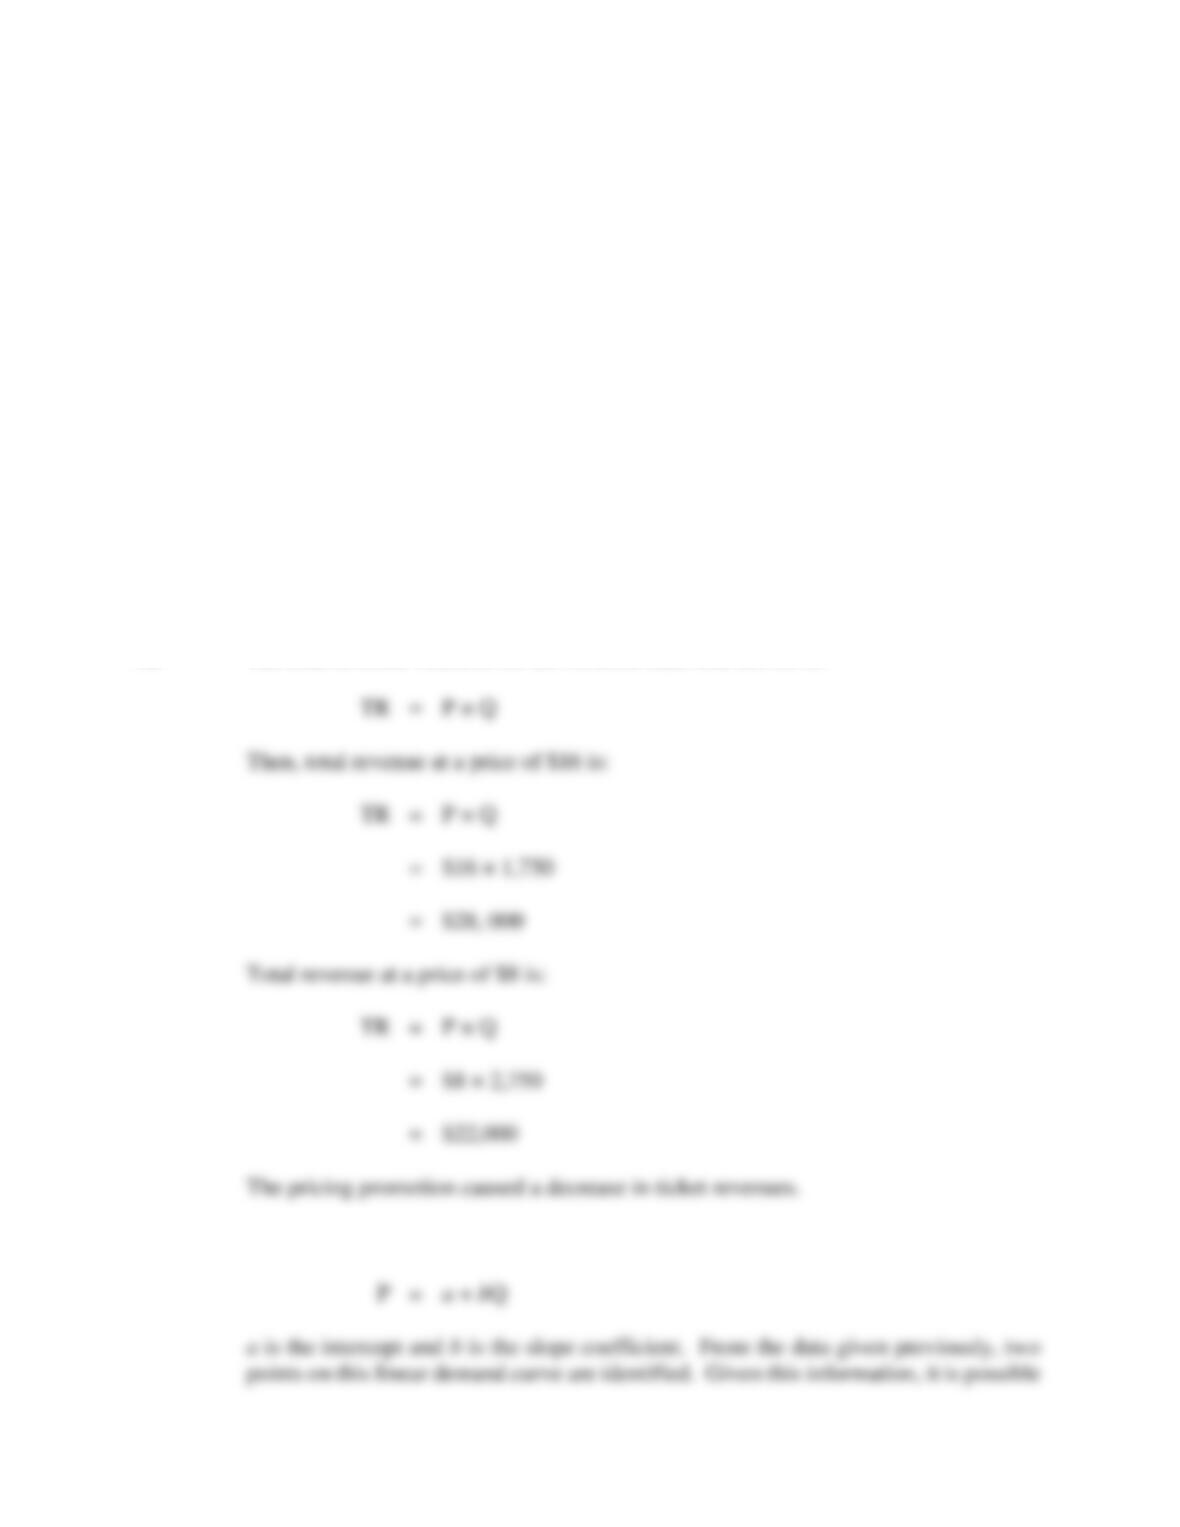
ST5.1 Linear Demand Curve Estimation. To ensure a big fan turnout for a traditional rival,
suppose the Arizona State Sun Devils offer one-half off the $16 regular price of reserved
seats for a women’s basketball game, and sales jumped from 1,750 to 2,750 tickets.
A. Calculate ticket revenues at each price level. Did the pricing promotion increase
or decrease ticket revenues?
B. Estimate the reserved seat demand curve, assuming that it is linear.
C. How should ticket prices be set to maximize total ticket revenue? Contrast this
answer with your answer to part A.
ST5.1 SOLUTION
A. The total revenue function for the Arizona State Sun Devils is:
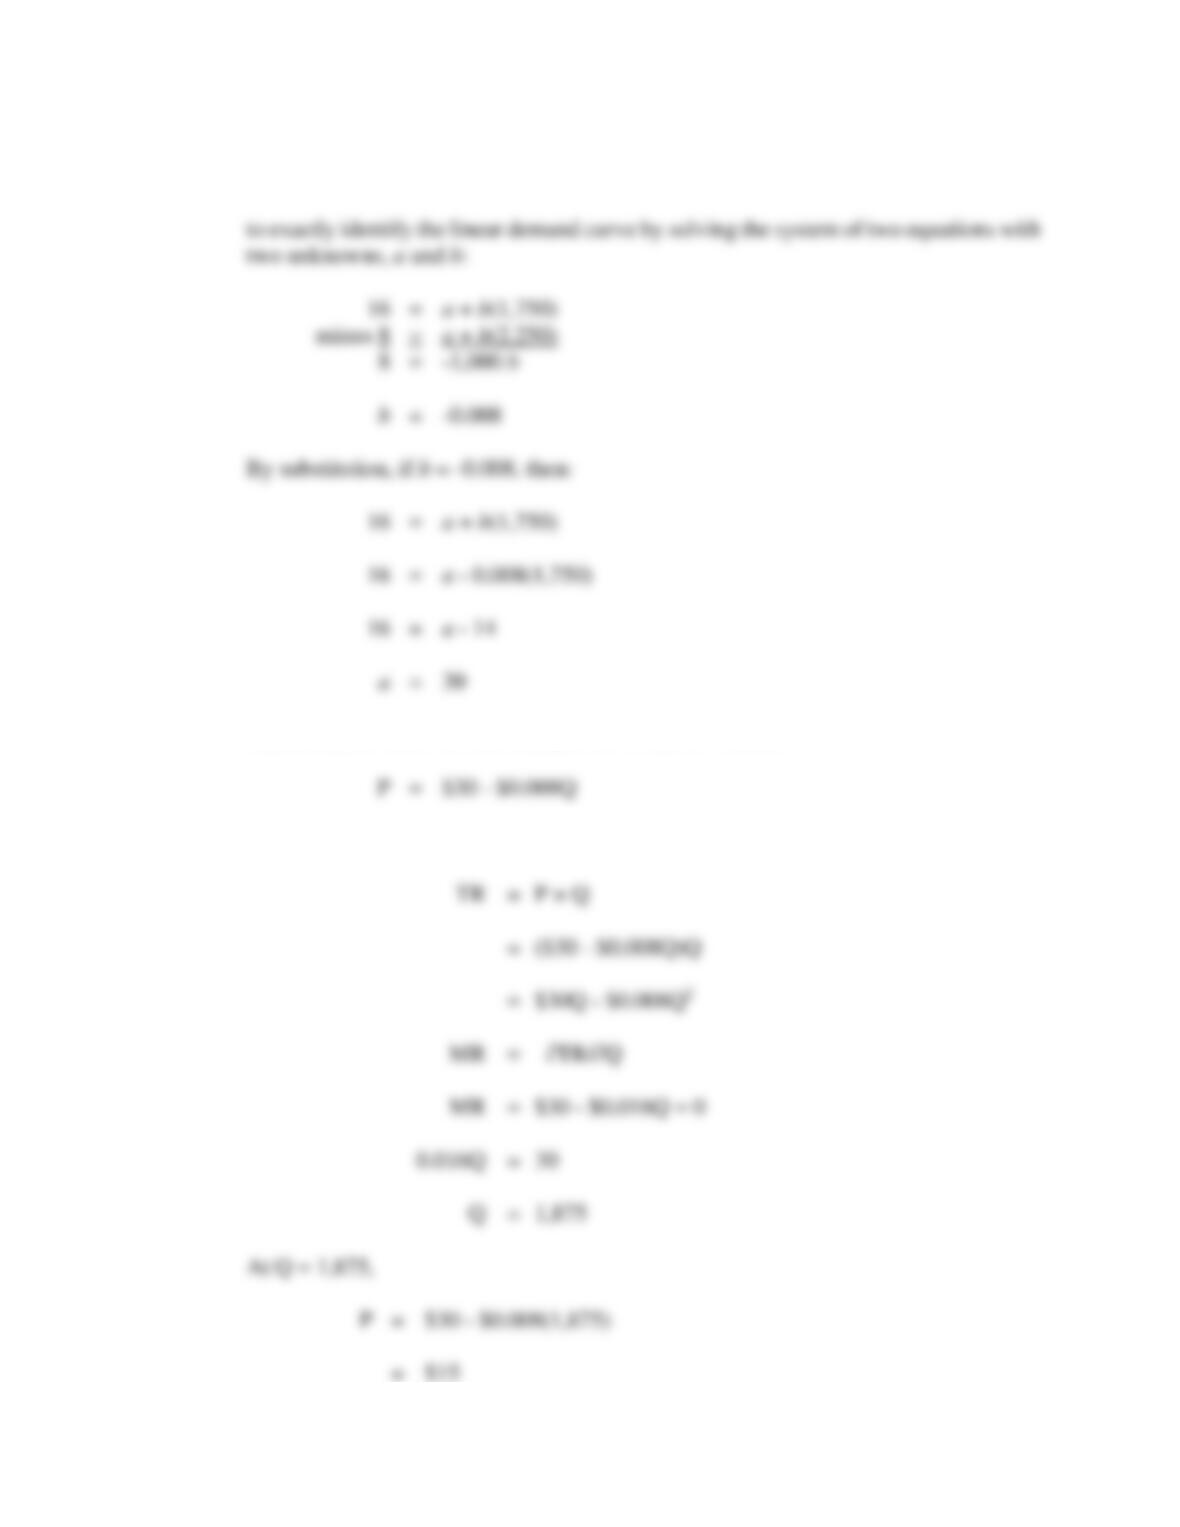
B. When a linear demand curve is written as:
110 Chapter 5
Therefore, the reserved seat demand curve can be written:
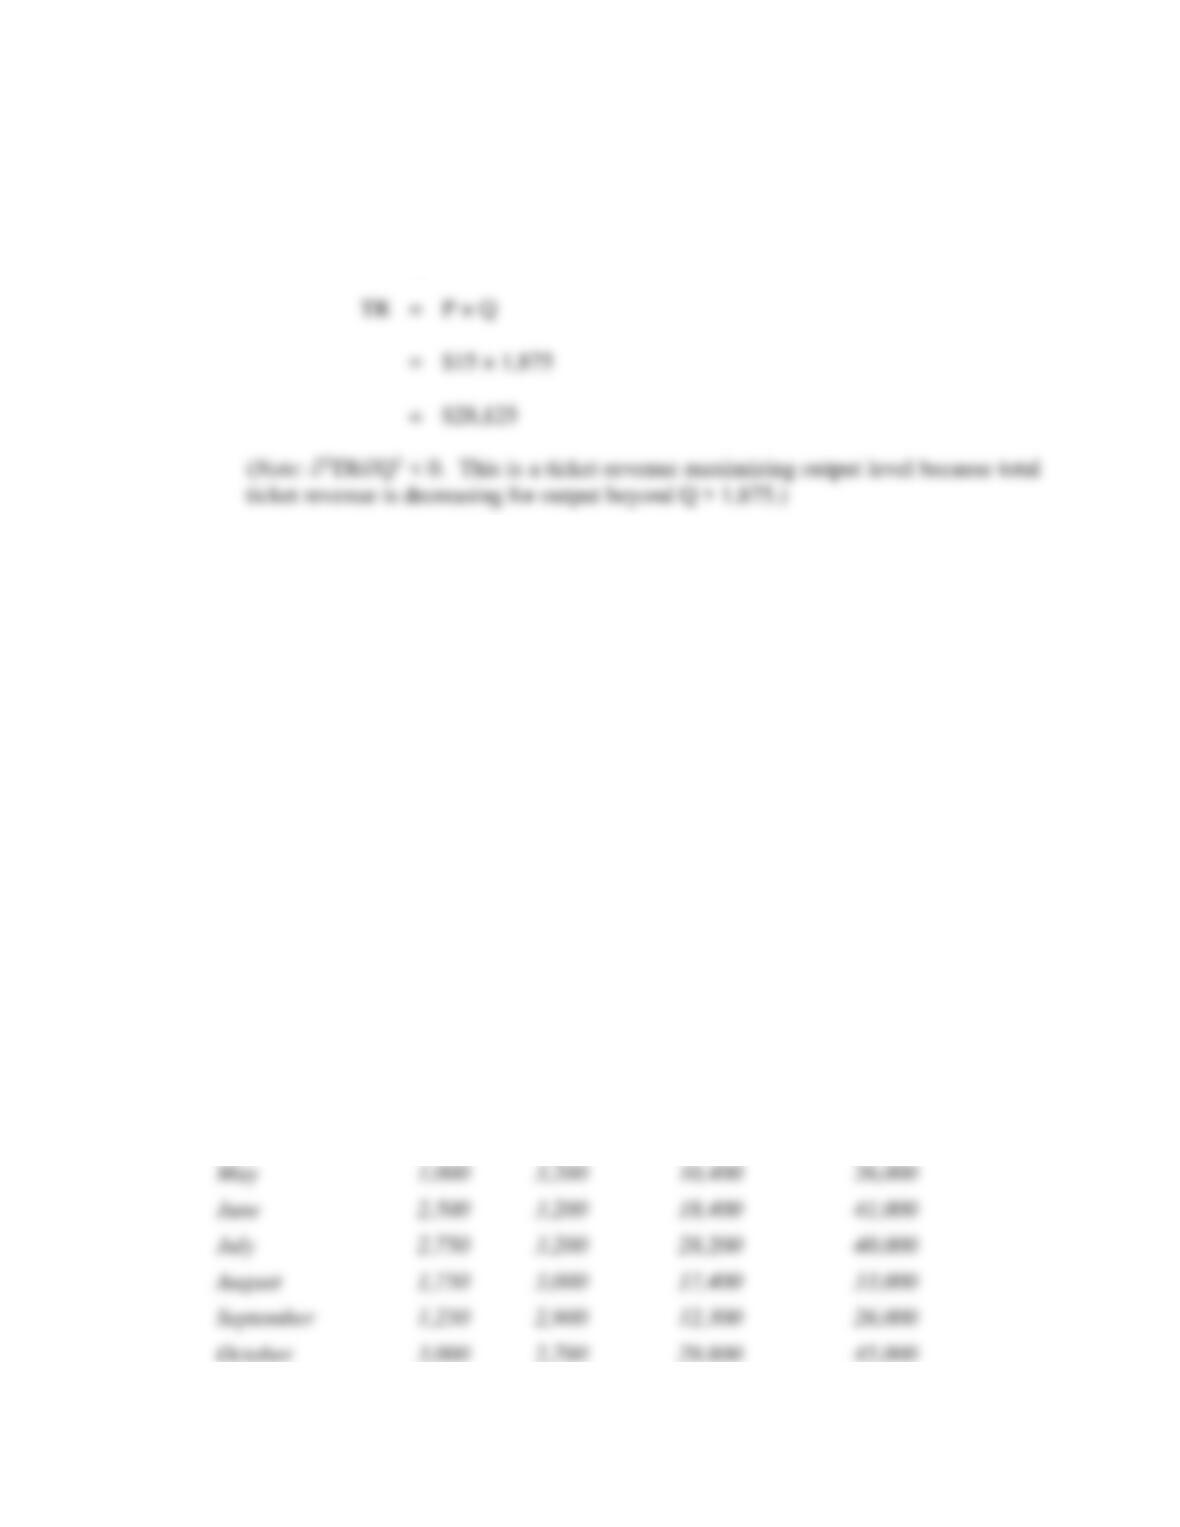
C. To find the revenue-maximizing output level, set MR = 0, and solve for Q. Because
Demand Estimation 111
Total revenue at a price of $15 is:
ST5.2 Regression Analysis. The use of regression analysis for demand estimation can be
further illustrated by expanding the Electronic Data Processing (EDP), Inc., example
described in the chapter. Assume that the link between units sold and personal selling
expenditures described in the chapter gives only a partial view of the impact of
important independent variables. Potential influences of other important independent
variables can be studied in a multiple regression analysis of EDP data on contract sales
(Q), personal selling expenses (PSE), advertising expenditures (AD), and average
contract price (P). Because of a stagnant national economy, industry-wide growth was
halted during the year, and the usually positive effect of income growth on demand was
missing. Thus, the trend in national income was not relevant during this period. For
simplicity, assume that relevant factors influencing EDP’s monthly sales are as follows:
Units Sold, Price, Advertising and Personal Selling Expenditures for
Electronic Data Processing, Inc.
Month
Units
Sold
Price
Advertising
Expenditures
Personal
Selling
Expenditures
January
2,500
$3,800
$26,800
$43,000
February
2,250
3,700
23,500
39,000
March
1,750
3,600
17,400
35,000
April
1,500
3,500
15,300
34,000
May
1,000
3,200
10,400
26,000
June
2,500
3,200
18,400
41,000
July
2,750
3,200
28,200
40,000
August
1,750
3,000
17,400
33,000
September
1,250
2,900
12,300
26,000
112 Chapter 5
Units Sold, Price, Advertising and Personal Selling Expenditures for
Electronic Data Processing, Inc.
Month
Units
Sold
Price
Advertising
Expenditures
Personal
Selling
Expenditures
November
2,000
2,700
20,300
32,000
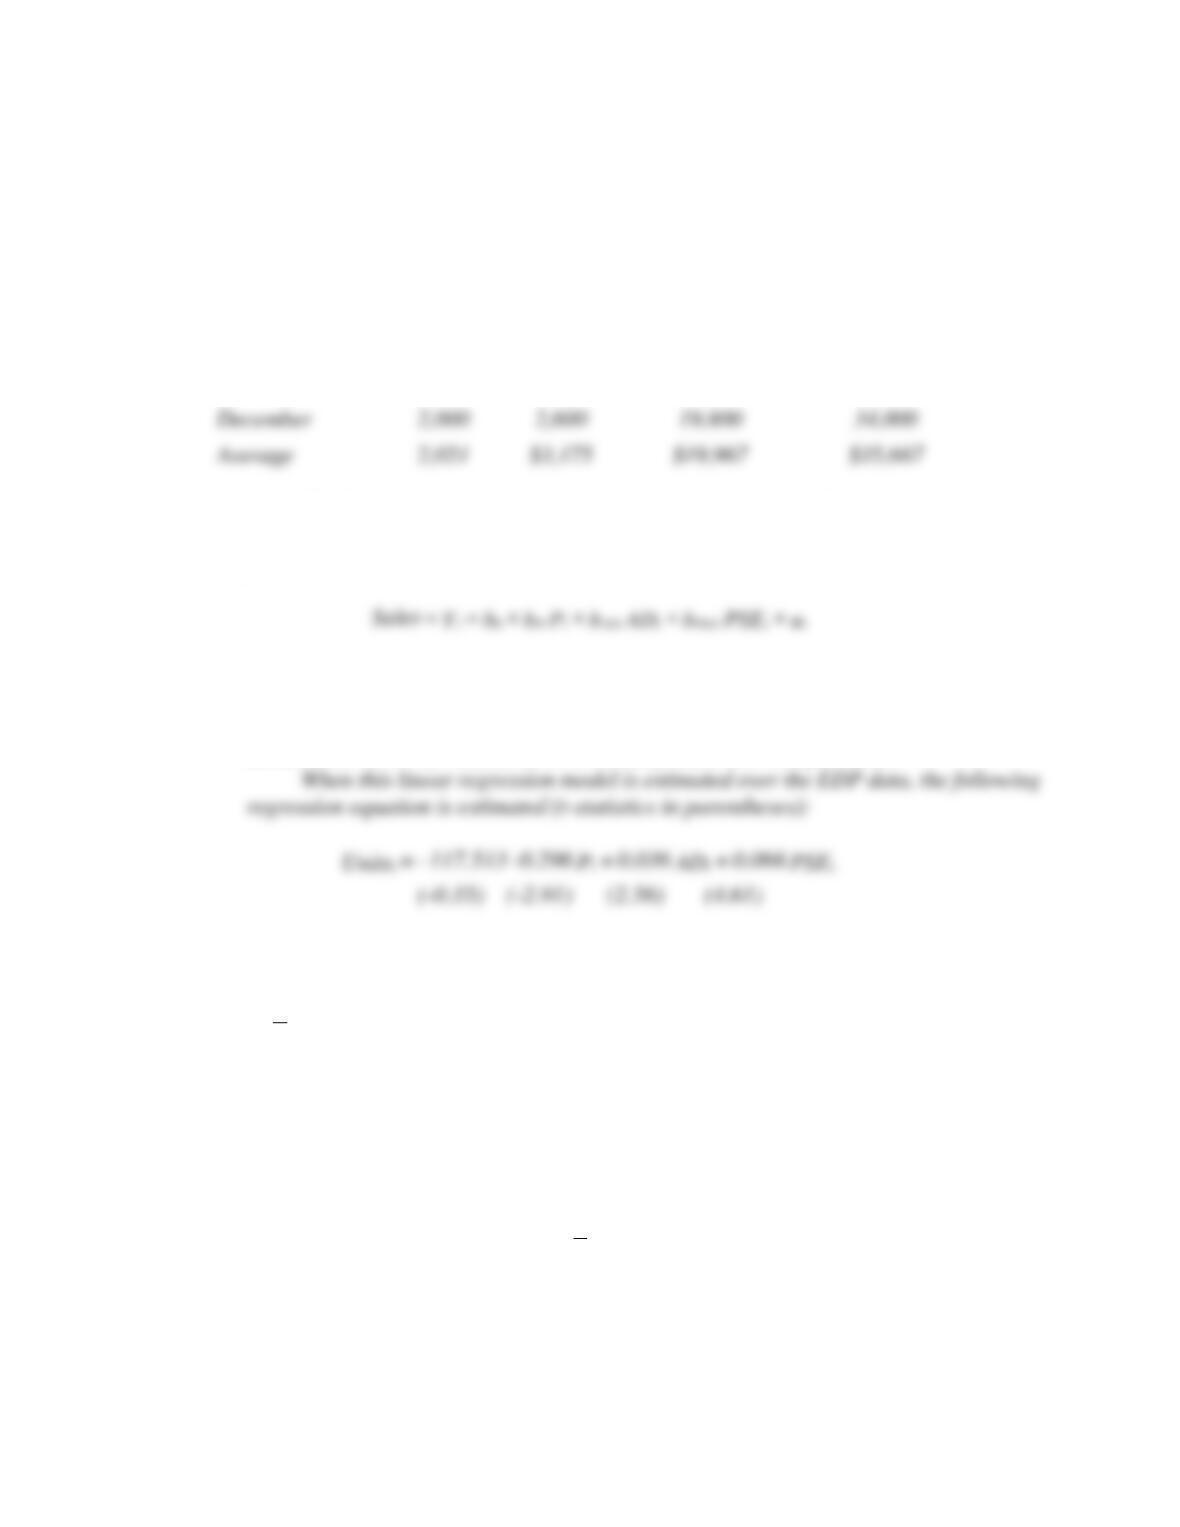
If a linear relation between unit sales, contract price, advertising, and personal
selling expenditures is hypothesized, the EDP regression equation takes the following
form:
where Y is the number of contracts sold, P is the average contract price per month, AD
is advertising expenditures, PSE is personal selling expenses, and u is a random
disturbance term—all measured on a monthly basis over the past year.
where Pt is price, ADt is advertising, PSEt is selling expense, and t-statistics are
indicated within parentheses. The standard error of the estimate or SEE is 123.9 units,
the coefficient of determination or R2 = 97.0%, the adjusted coefficient of determination
is
2
R
= 95.8%, and the relevant F statistic is 85.4.
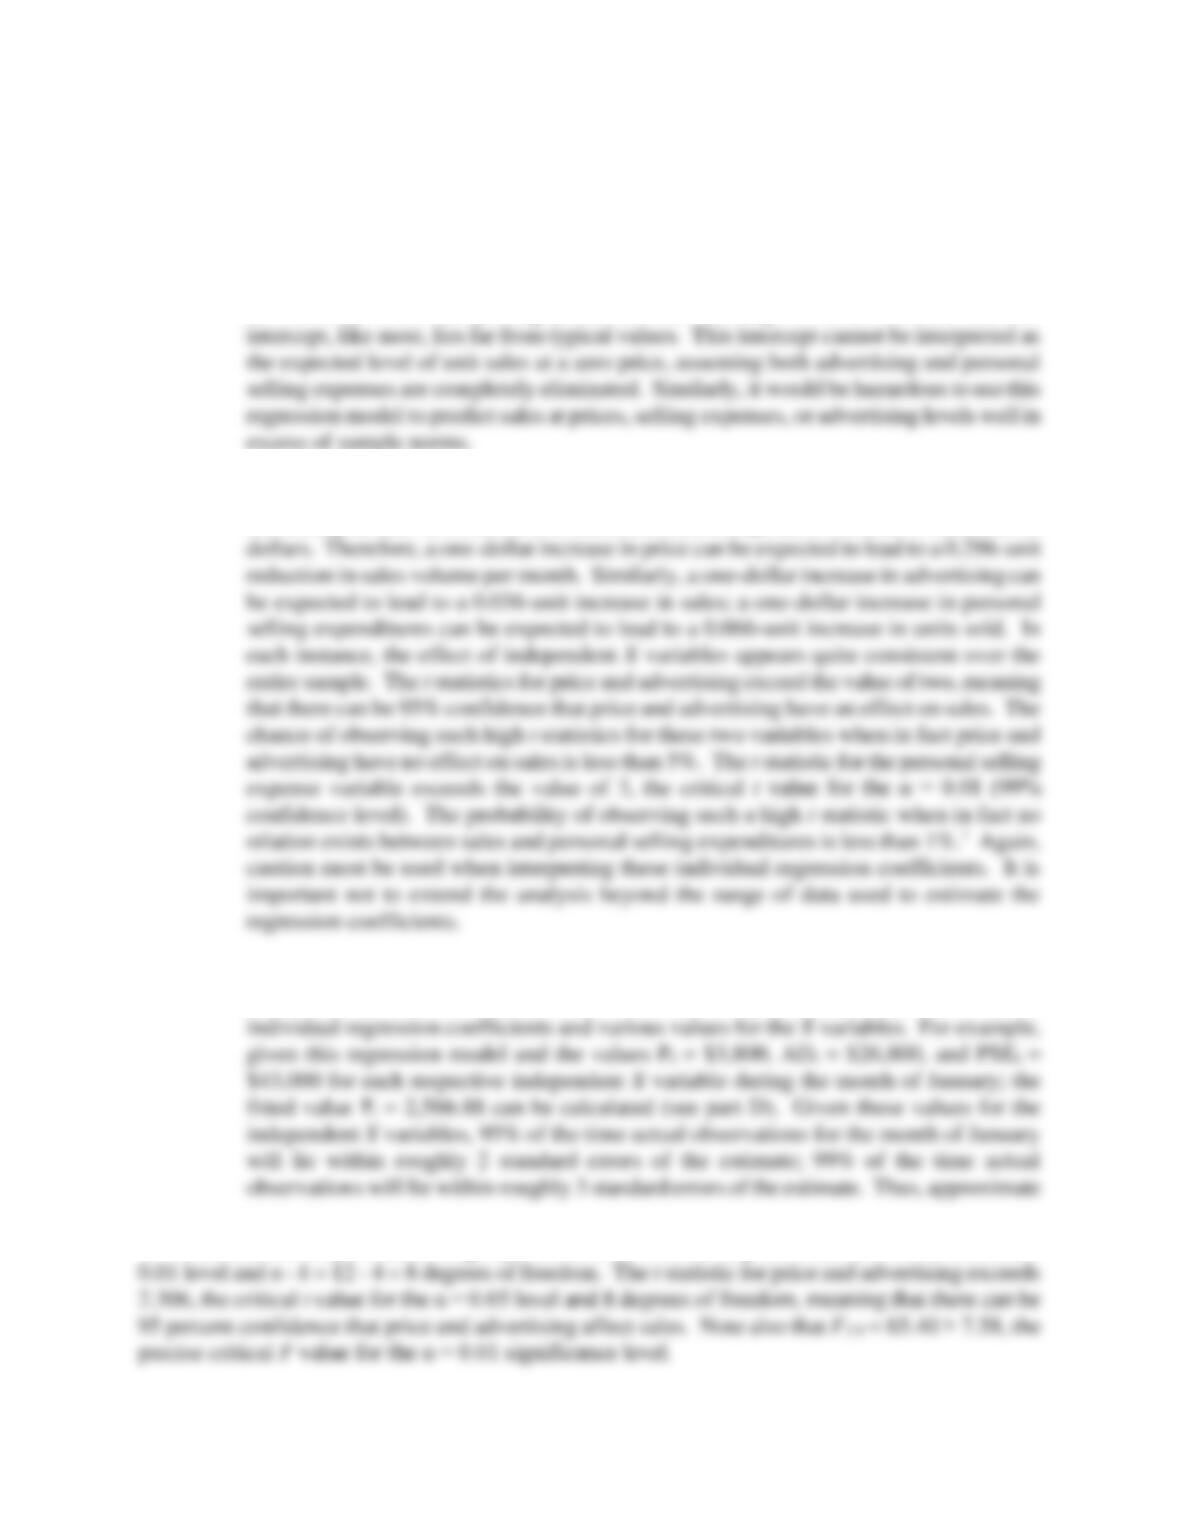
A. What is the economic meaning of the b0 = –117.513 intercept term? How would
you interpret the value for each independent variable’s coefficient estimate?
B. How is the standard error of the estimate (SEE) employed in demand estimation?
C. Describe the meaning of the coefficient of determination, R2, and the adjusted
coefficient of determination,
2
R
.
D. Use the EDP regression model to estimate fitted values for units sold and
unexplained residuals for each month during the year.
December
2,000
2,600
19,800
34,000
Average
2,021
$3,175
Demand Estimation 113
ST5.2 SOLUTION
A. The intercept term b0 = -117.513 has no clear economic meaning. Caution must always
be exercised when interpreting points outside the range of observed data and this
Slope coefficients provide estimates of the change in sales that might be expected
following a one-unit increase in price, advertising, or personal selling expenditures. In
this example, sales are measured in units, and each independent variable is measured in
B. The standard error of the estimate, or SEE, of 123.9 units can be used to construct a
confidence interval within which actual values are likely to be found based on the size of
1The t statistic for personal selling expenses exceeds 3.355, the precise critical t value for the α =
114 Chapter 5
C. The coefficient of determination is R2 = 97.0%; it indicates that 97% of the variation in
D. Fitted values and unexplained residuals per month are as follows:
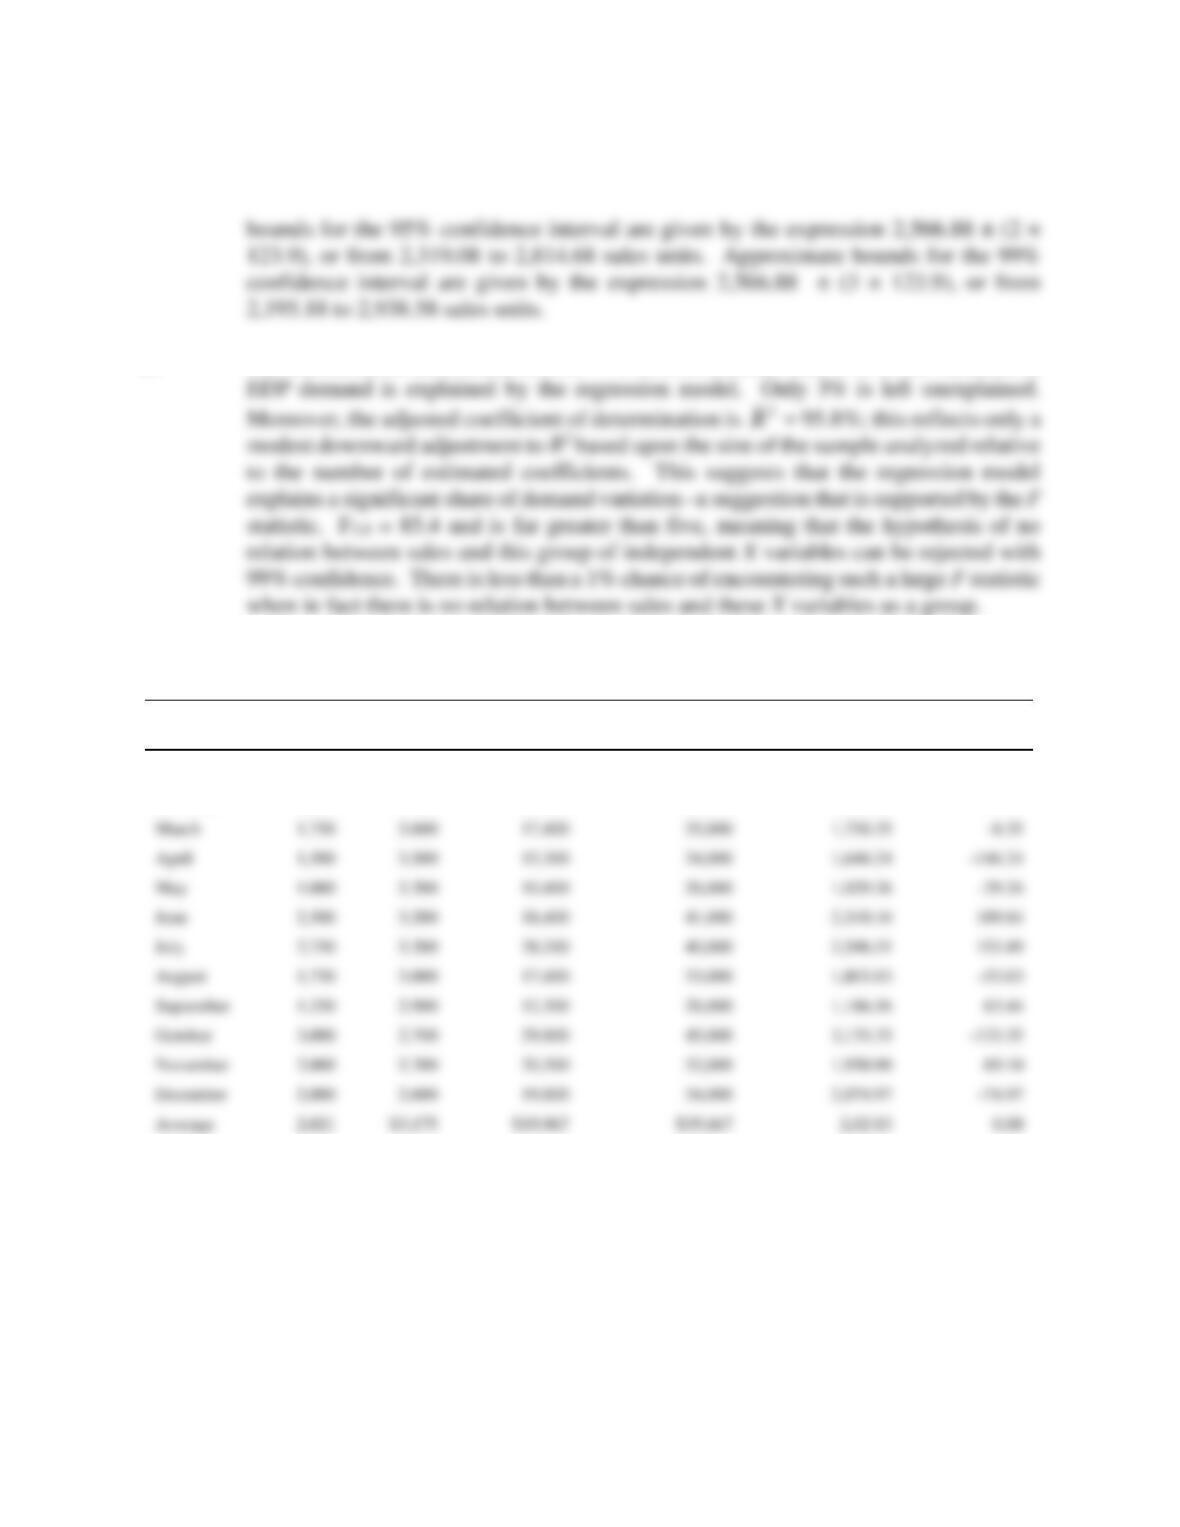
Demand Function Regression Analysis for Electronic Data Processing, Inc.
Month
Units
Sold
Price
Advertising
Expenditures
Personal Selling
Expenditures
Fitted Value for
Units Sold
Unexplained
Residuals
January
2,500
$3,800
$26,800
$43,000
2,566.88
-66.88
February
2,250
3,700
23,500
39,000
2,212.98
37.02
PROBLEMS & SOLUTIONS
P5.1 Demand Estimation Concepts. Identify each of the following statements as true or false
and explain why.
A. The effect of a $1 change in price is constant, but the elasticity of demand will
vary along a linear demand curve.

Demand Estimation 115
B. In practice, price and quantity tend to be individually rather than simultaneously
determined.
C. A demand curve is revealed if prices fall while supply conditions are held
constant.
E. Consumer interviews are a useful means for incorporating subjective information
into demand estimation.
P5.1 SOLUTION
P5.2 Regression Analysis. Identify each of the following statements as true or false and
explain why:
A. A parameter is a population characteristic that is estimated by a coefficient
derived from a sample of data.
B. A one-tail t test is used to indicate whether the independent variables as a group
explain a significant share of demand variation.
116 Chapter 5
E. The coefficient of determination shows the share of total variation in demand that
cannot be explained by the regression model.
P5.2 SOLUTION
A. True. A parameter is a population characteristic that is estimated by a coefficient
derived from a sample of data.
P5.3 Revenue vs. Profit Maximization. The Best Buy Company, Inc., is a leading specialty
retailer of consumer electronics, personal computers, entertainment software and
appliances. The Company operates retail stores and commercial Web sites, the best
known of which is bestbuy.com. Recently, this site offered a Home Theater unit with a
5-disc DVD player, MP3 playback, and digital AM/FM. At a price of $1,100, weekly
sales totaled 2,500 units. After a $100 online rebate was offered, weekly sales jumped
to 5,000 units.
Using these two price-output combinations, the relevant linear demand and
marginal revenue curves can be estimated as:
B. Calculate the profit-maximizing price-output combination. Also calculate
revenues and profits at the profit-maximizing activity level.
P5.3 SOLUTION
A. To find the revenue-maximizing price-output rental rate, set MR = 0, and solve for Q.
Because
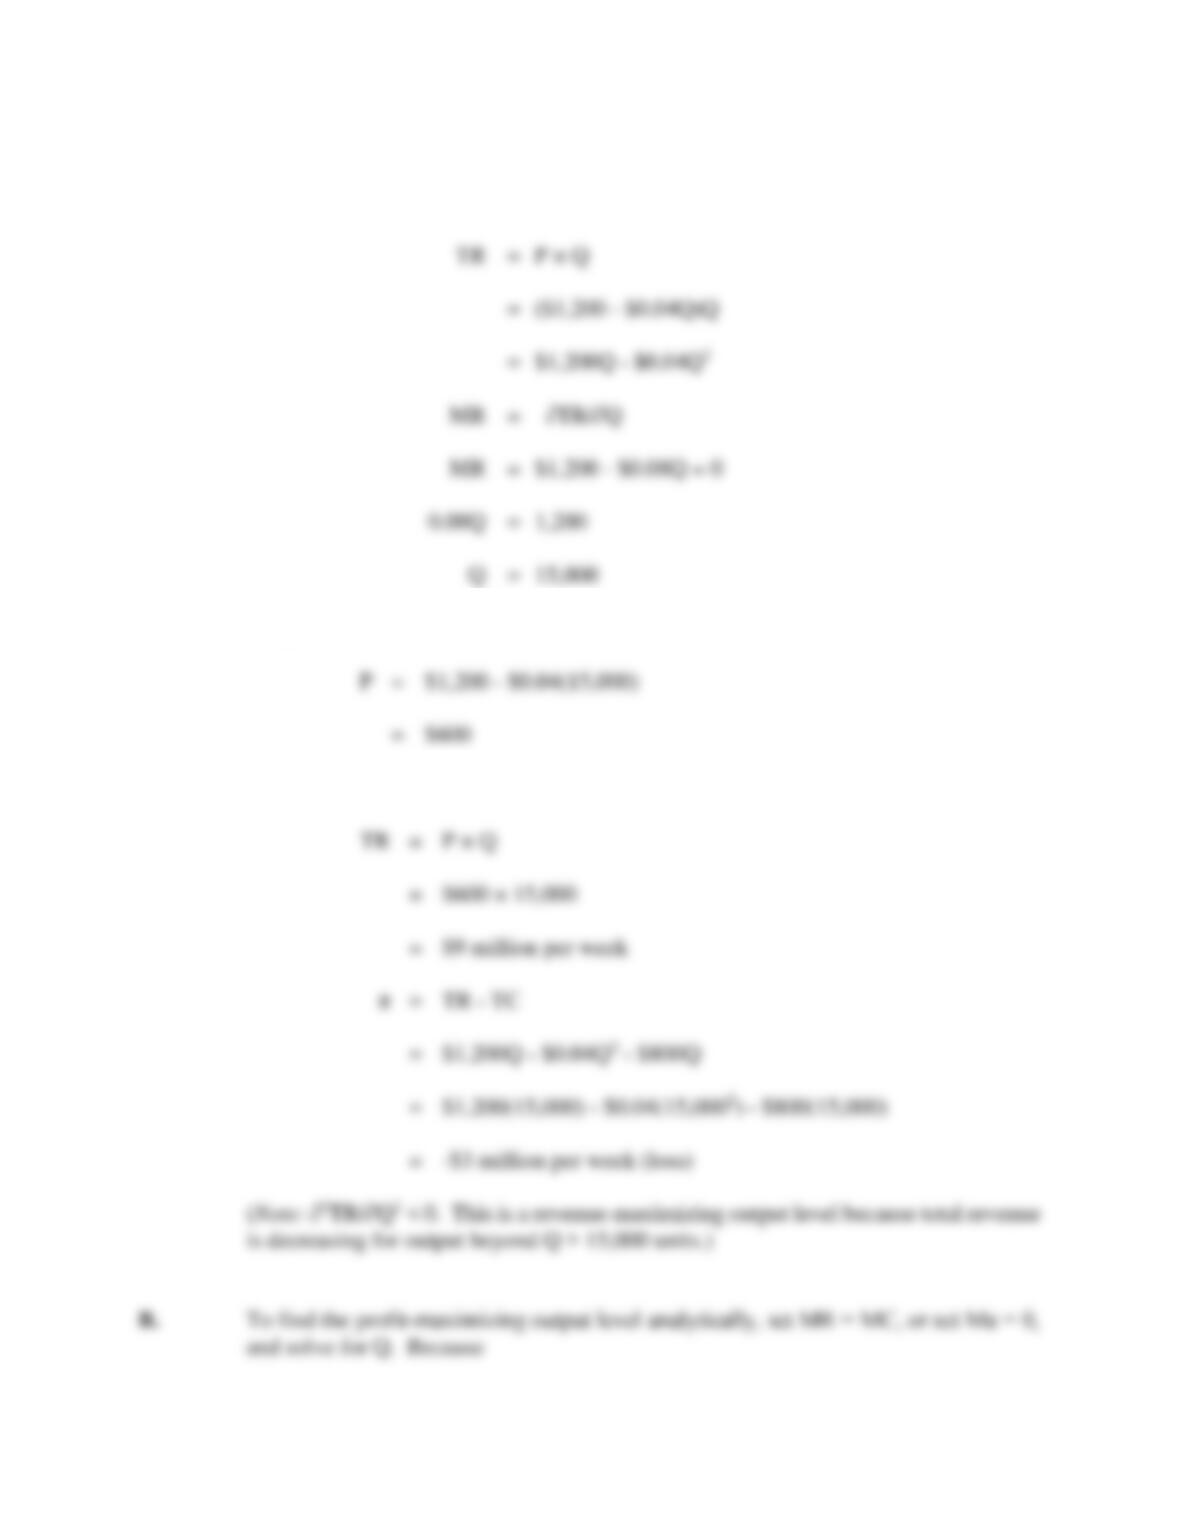
Demand Estimation 117
At Q = 15,000,
Total revenue at a price of $600 is:
118 Chapter 5
Total revenue at a price of $1,000 is:
P5.4 Revenue vs. Profit Maximization. On weekends during summer months, Eric Cartman
rents jet skis at the beach on an hourly basis. Last week, Cartman rented jet skis for 20
hours per day at a rate of $50 per hour. This week, rentals fell to 15 hours per day
when Cartman raised the price to $55 per hour.
Using these two price-output combinations, the relevant linear demand and
marginal revenue curves can be estimated as:
P = $70 – $1Q and MR = $70 – $2Q
Demand Estimation 119
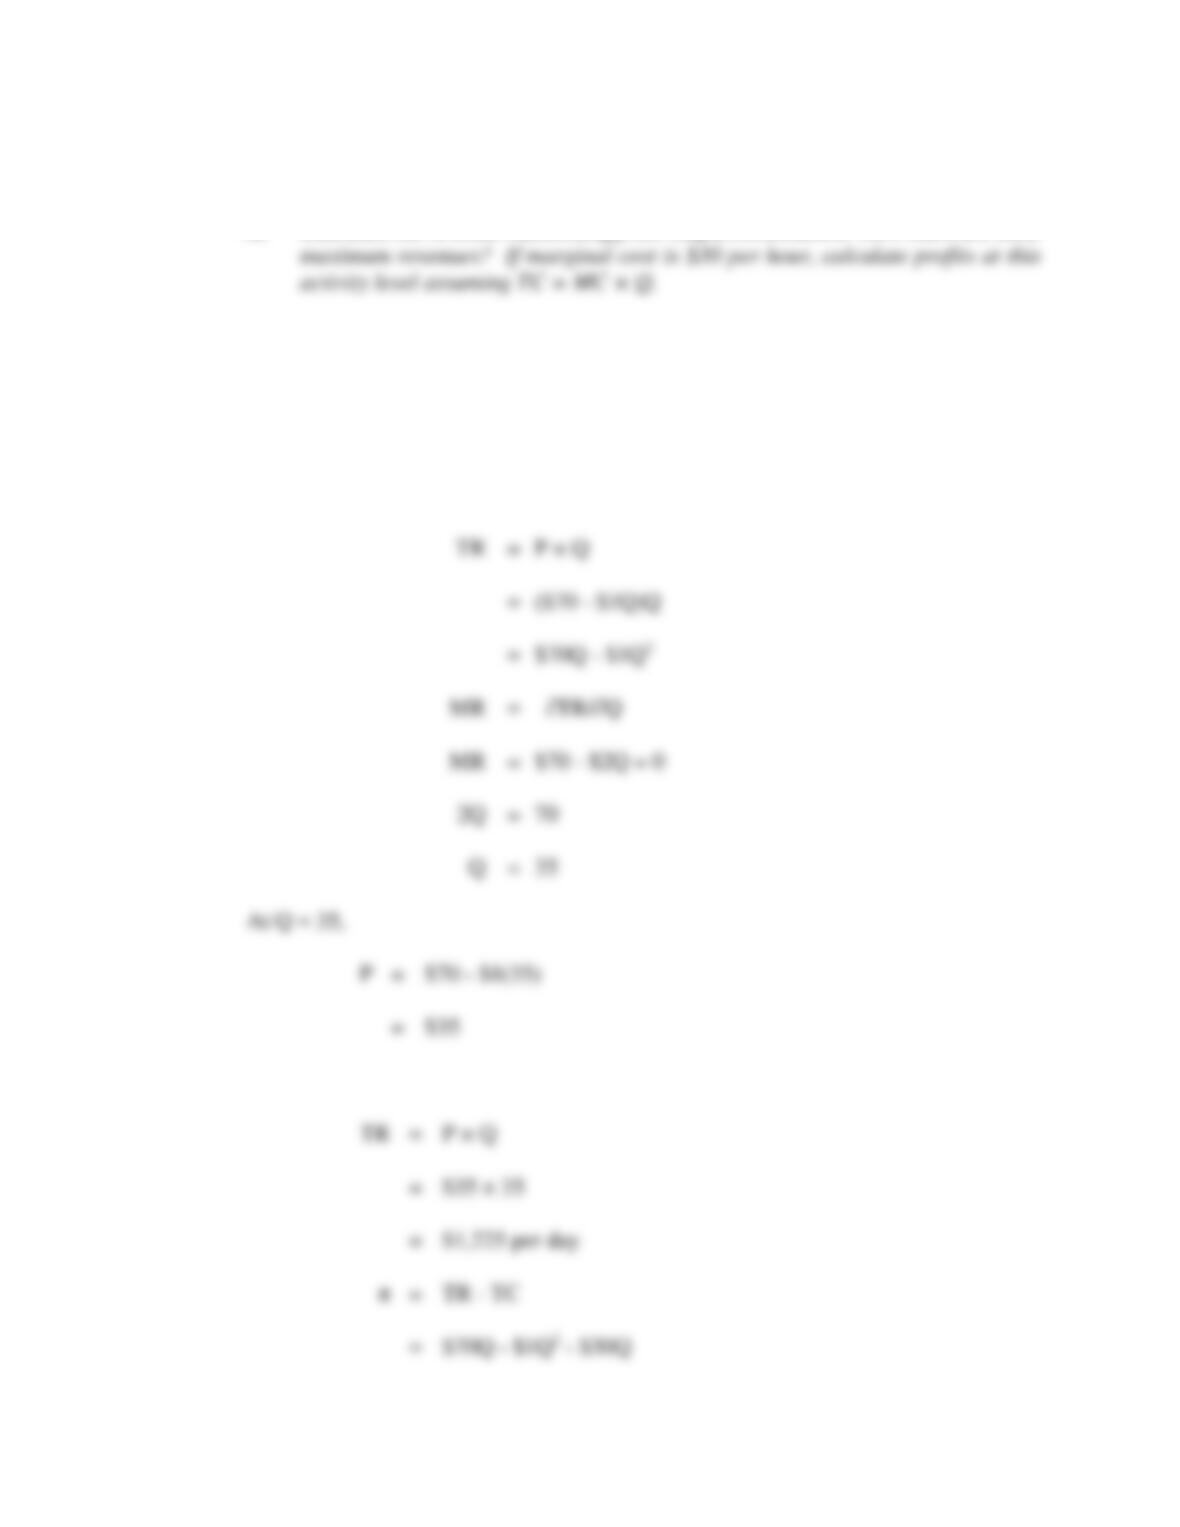
A. Calculate the revenue-maximizing price-output combination. How much are these
B. Calculate the profit-maximizing price-output combination along with revenues
and profits at this activity level.
P5.4 SOLUTION
A. To find the revenue-maximizing price-output rental rate, set MR = 0, and solve for P.
Because
Total revenue at a price of $35 is:
120 Chapter 5
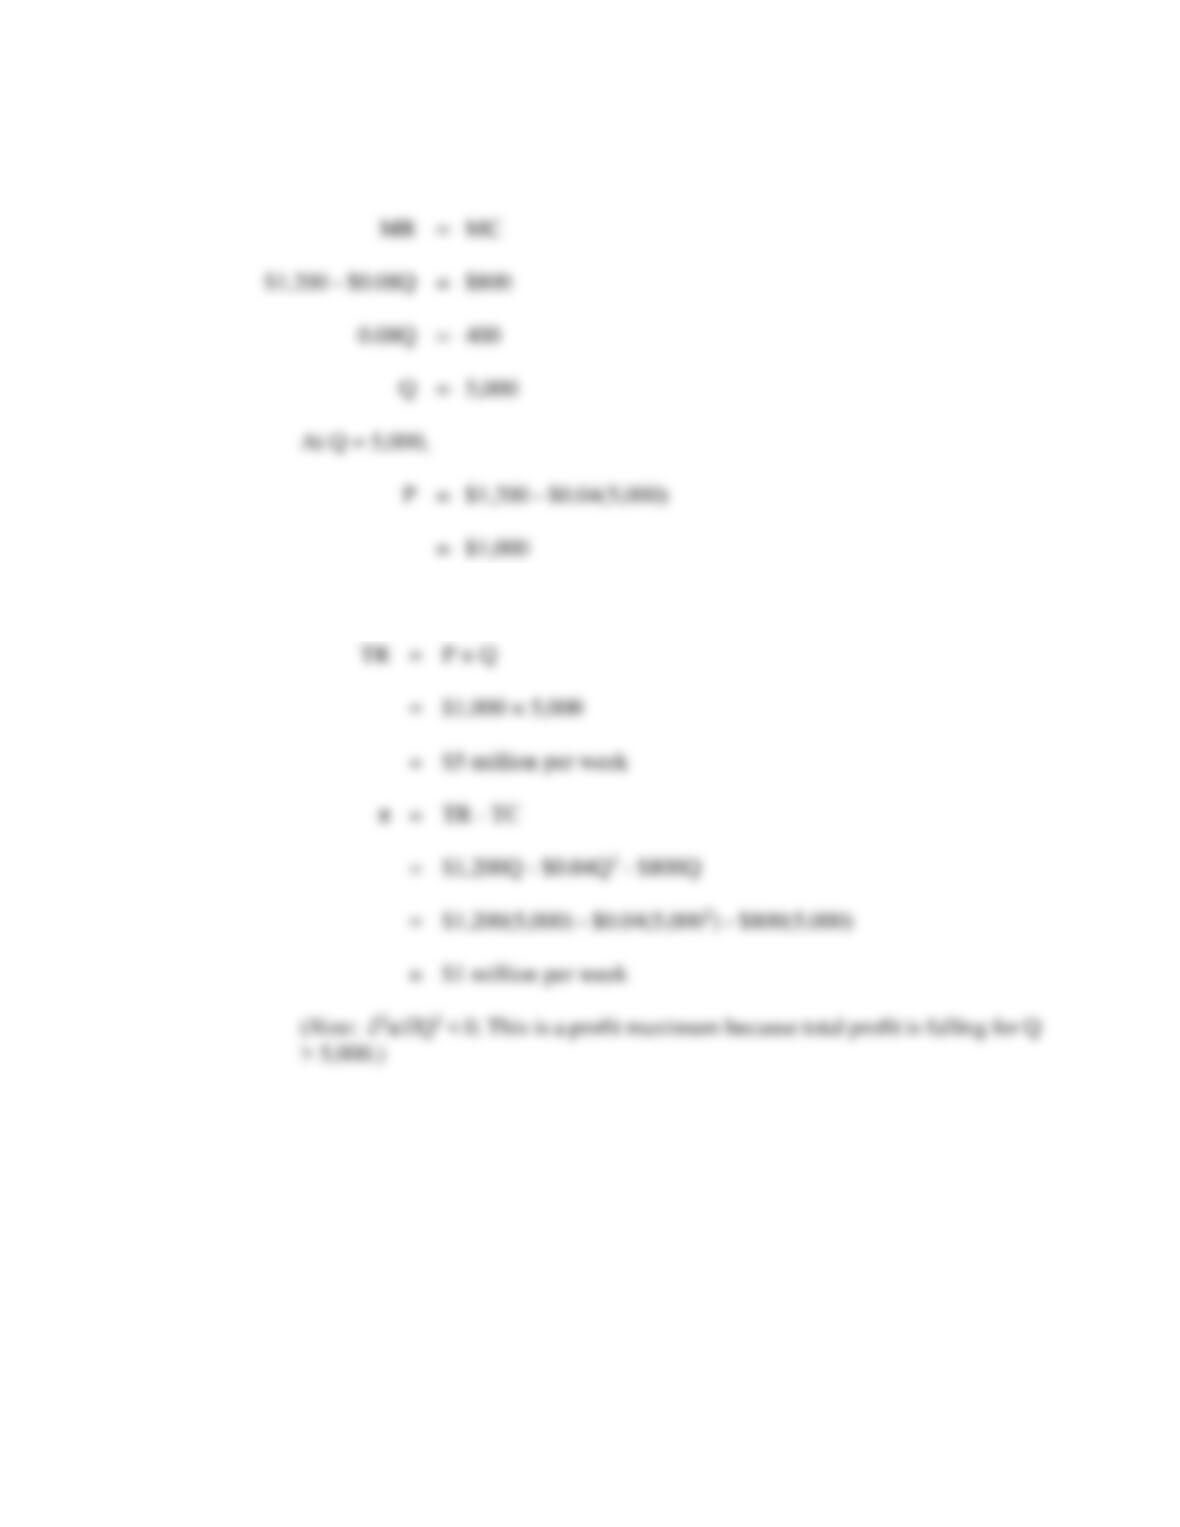
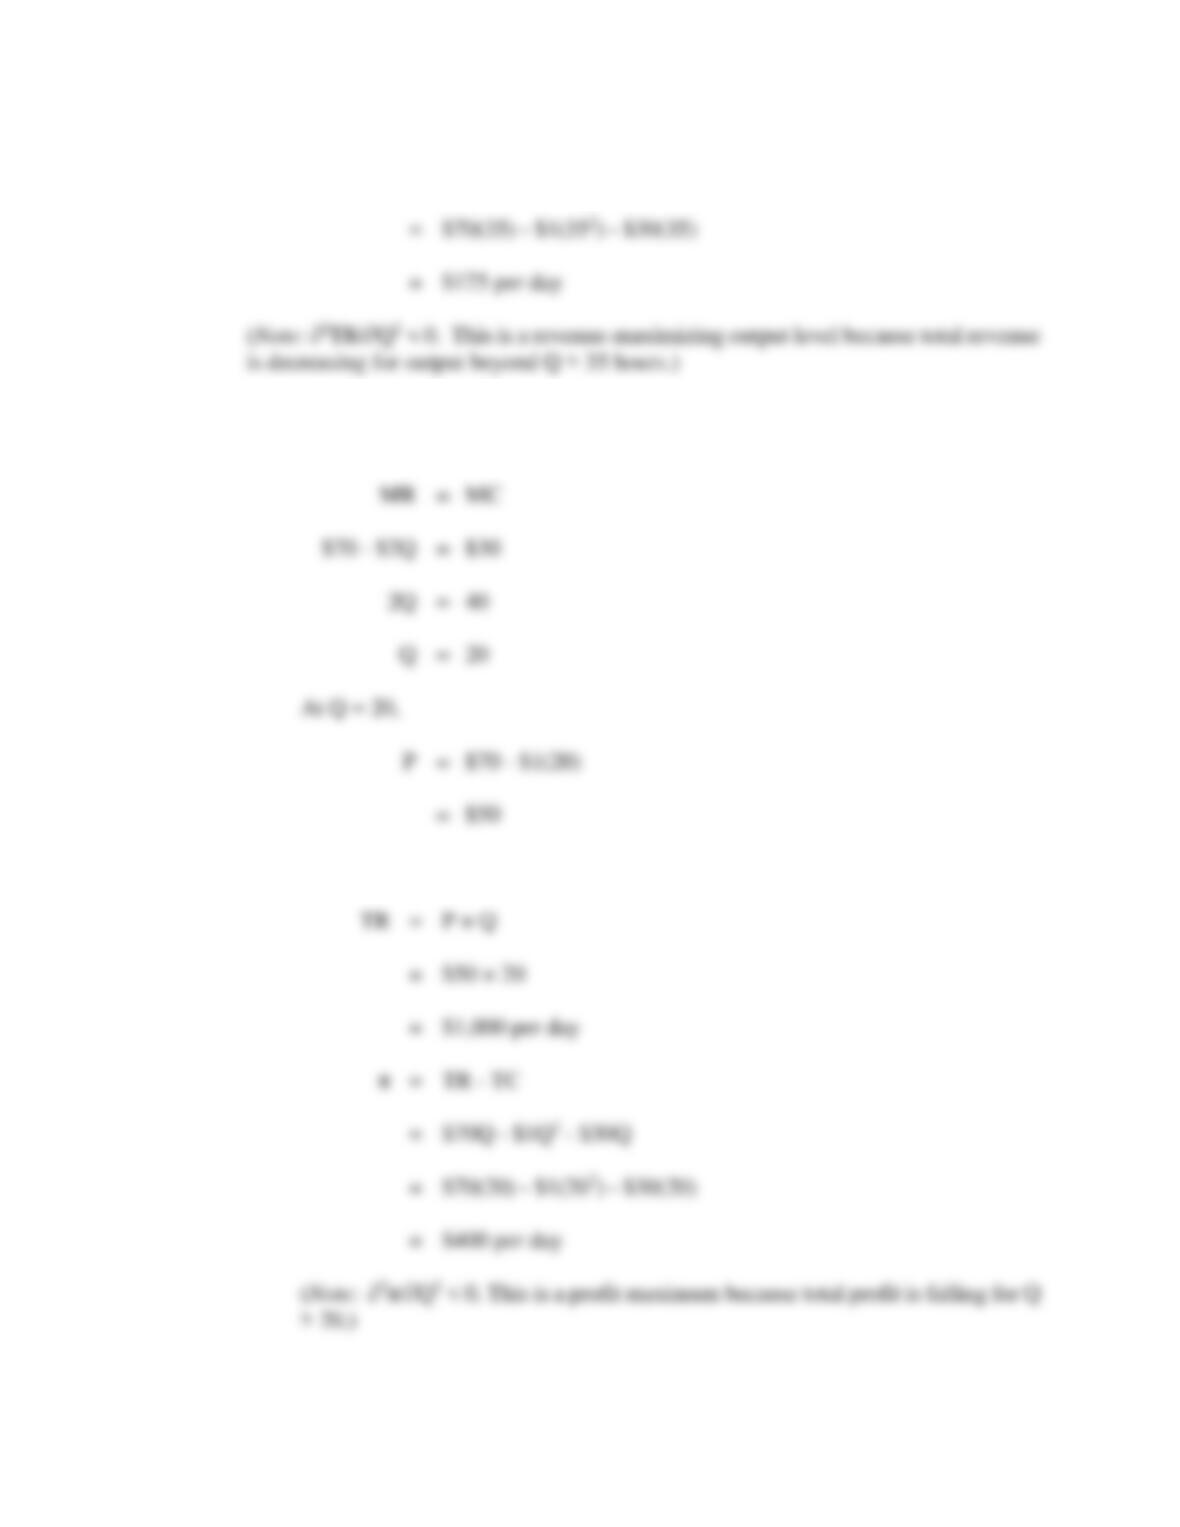
B. To find the profit-maximizing output level analytically, set MR = MC, or set Mπ = 0,
and solve for Q. Because
Total revenue at a price of $50 is: