interactive activity
Chapter 5
Price Controls and
Quotas: Meddling with Markets
1. In order to ingratiate himself with voters, the mayor of Gotham City decides to
lower the price of taxi rides. Assume, for simplicity, that all taxi rides are the
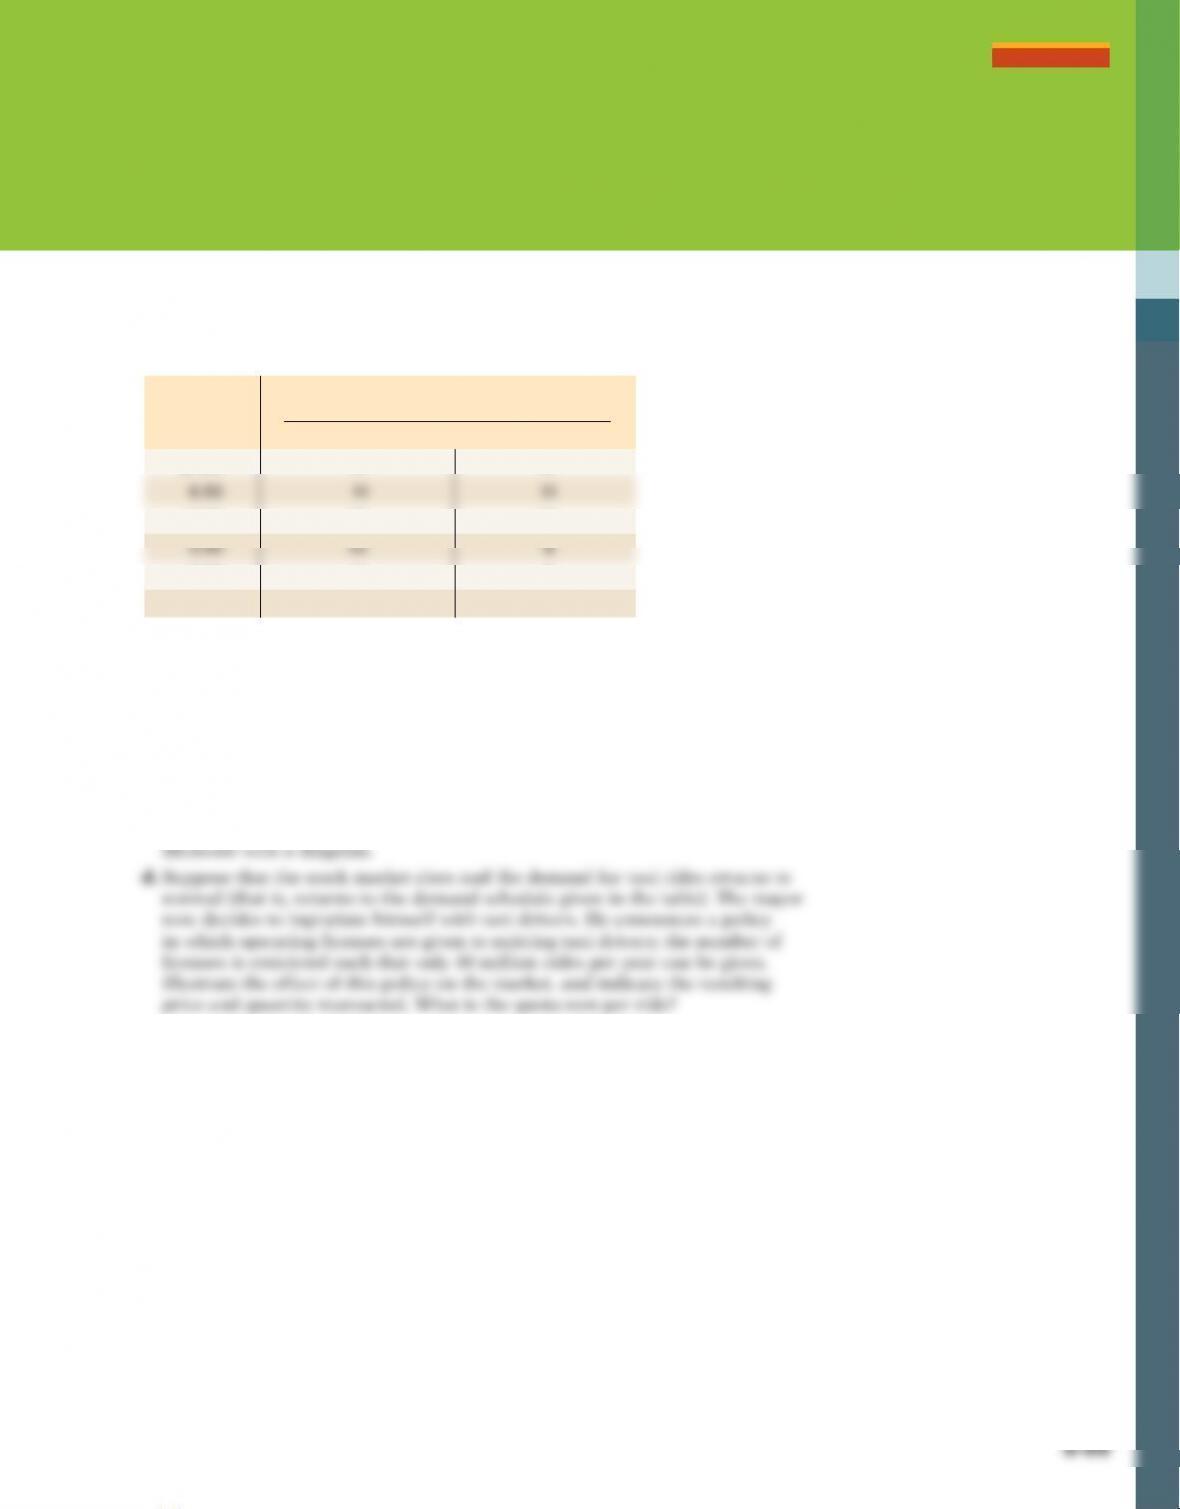
same distance and therefore cost the same. The accompanying table shows the
demand and supply schedules for taxi rides.
Fare
(per ride)
Quantity of rides
(millions per year)
Quantity demanded Quantity supplied
$7.00 10 12
6.00 12 10
5.00 14 8
4.50 15 7
a. Assume that there are no restrictions on the number of taxi rides that can
be supplied (there is no medallion system). Find the equilibrium price and
quantity.
b. Suppose that the mayor sets a price ceiling at $5.50. How large is the short-
age of rides? Illustrate with a diagram. Who loses and who benefits from this
policy?
c. Suppose that the stock market crashes and, as a result, people in Gotham City
are poorer. This reduces the quantity of taxi rides demanded by 6 million rides
per year at any given price. What effect will the mayor’s new policy have now?
S-70 Chapter 5 Price controls and Quotas: Meddling with Markets
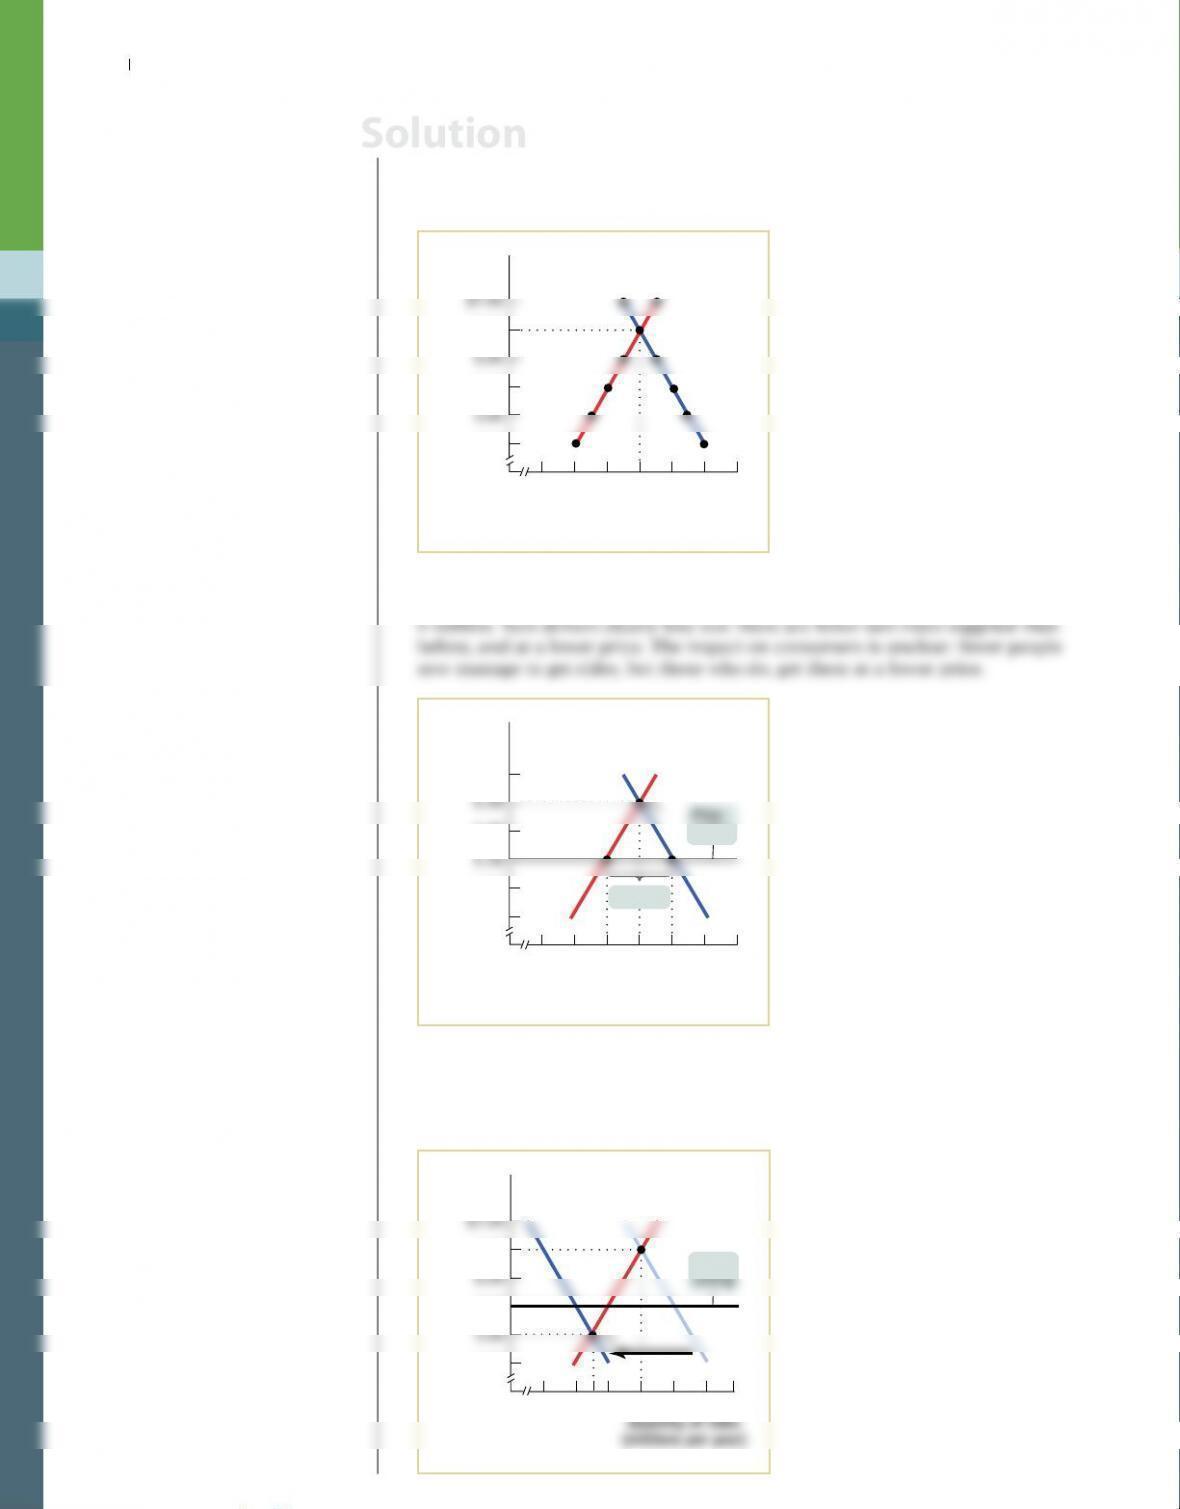
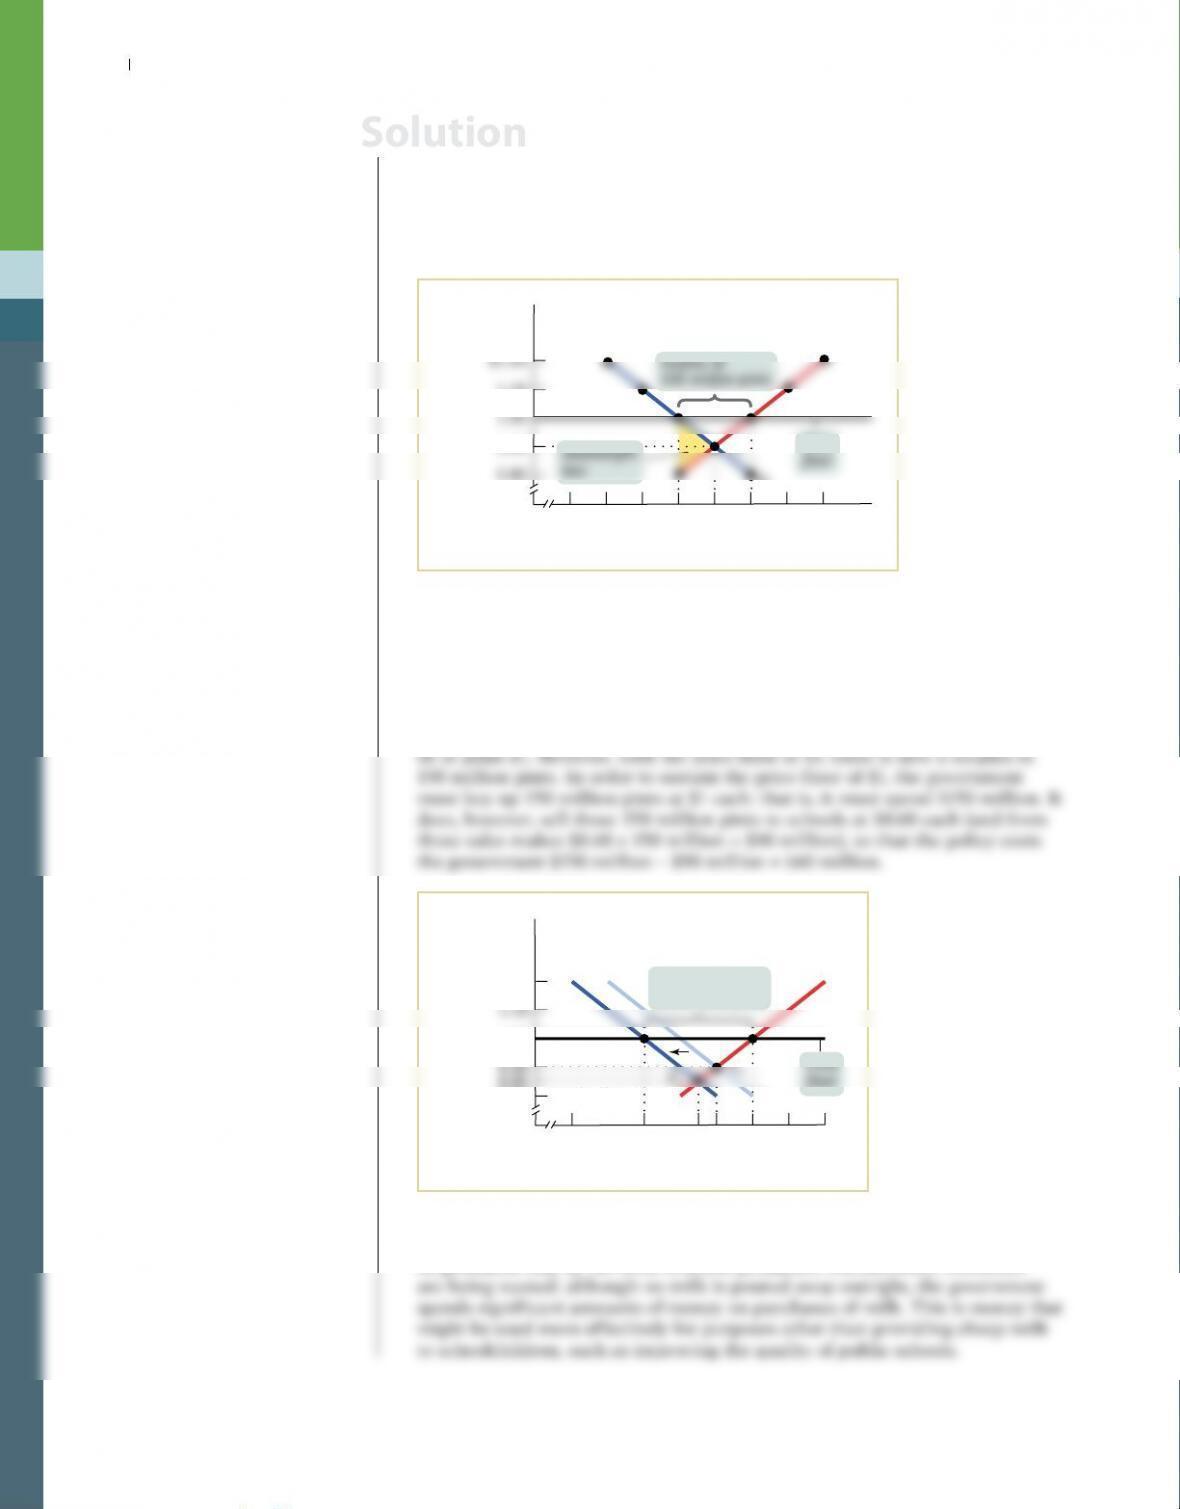
1. a. The equilibrium in the market for taxi rides is shown by E1 in the accom-
panying diagram. The equilibrium price is $6.50; at that price, the quantity
demanded equals the quantity supplied—11 million taxi rides per year. The
demand and supply curves (D1 and S) illustrate this initial situation.
S
6.50
5.50
4.50
0
Fare
(per ride)
Quantity of rides
(millions per year)
57911 13 15
17
D1
E1
b. With a price ceiling of $5.50, the quantity supplied is 9 million taxi rides and
the quantity demanded is 13 million. So the shortage is 13 million – 9 million =
S
$7.00
6.00
5.00
4.50
0
Fare
(per ride)
Quantity of rides
(millions per year)
57911131
517
D1
Shortage
ceiling
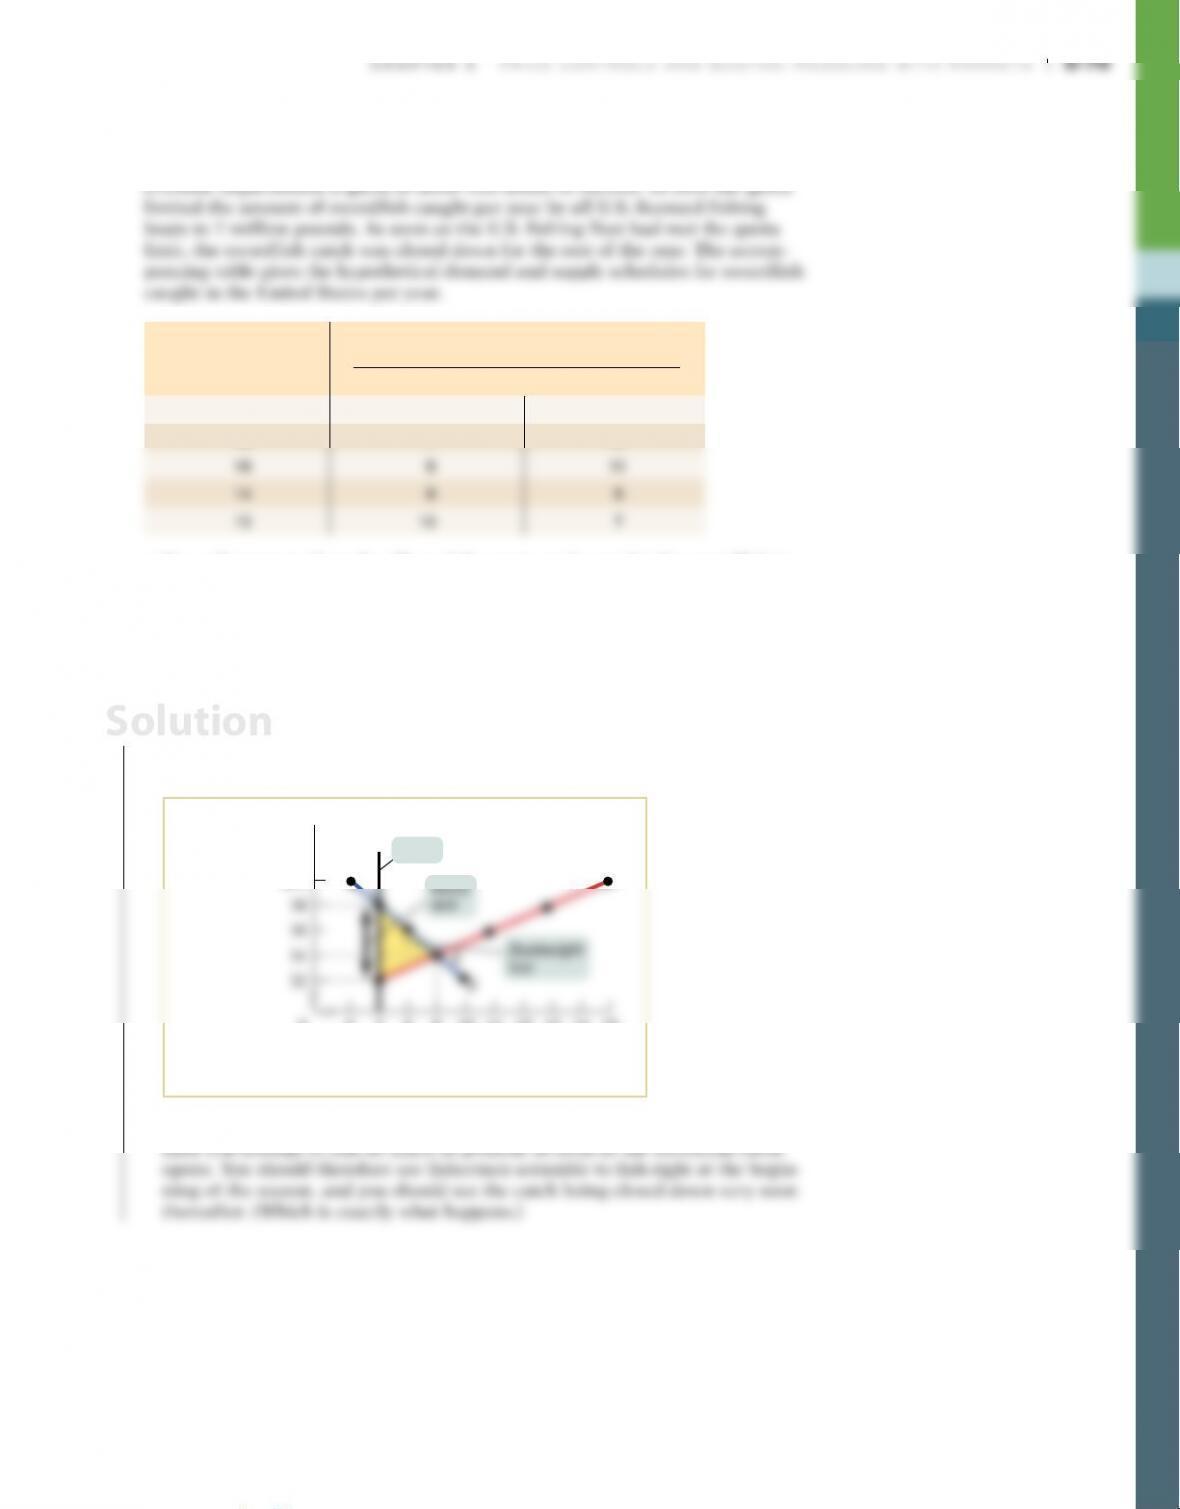
c. The new demand curve is D2. Now the price ceiling has no effect: the equilib–
rium is point E2 and the market price settles at $5, which is below the man-
dated price ceiling of $5.50. There will be 8 million taxi rides demanded and
supplied, at a price of $5 each.
S
6.50
5.50
4.50
0
Fare
(per ride)
5789 11 13 15 17
D1
D2
E1
Price
Solution
Chapter 5 Price controls and Quotas: Meddling with Markets S-71
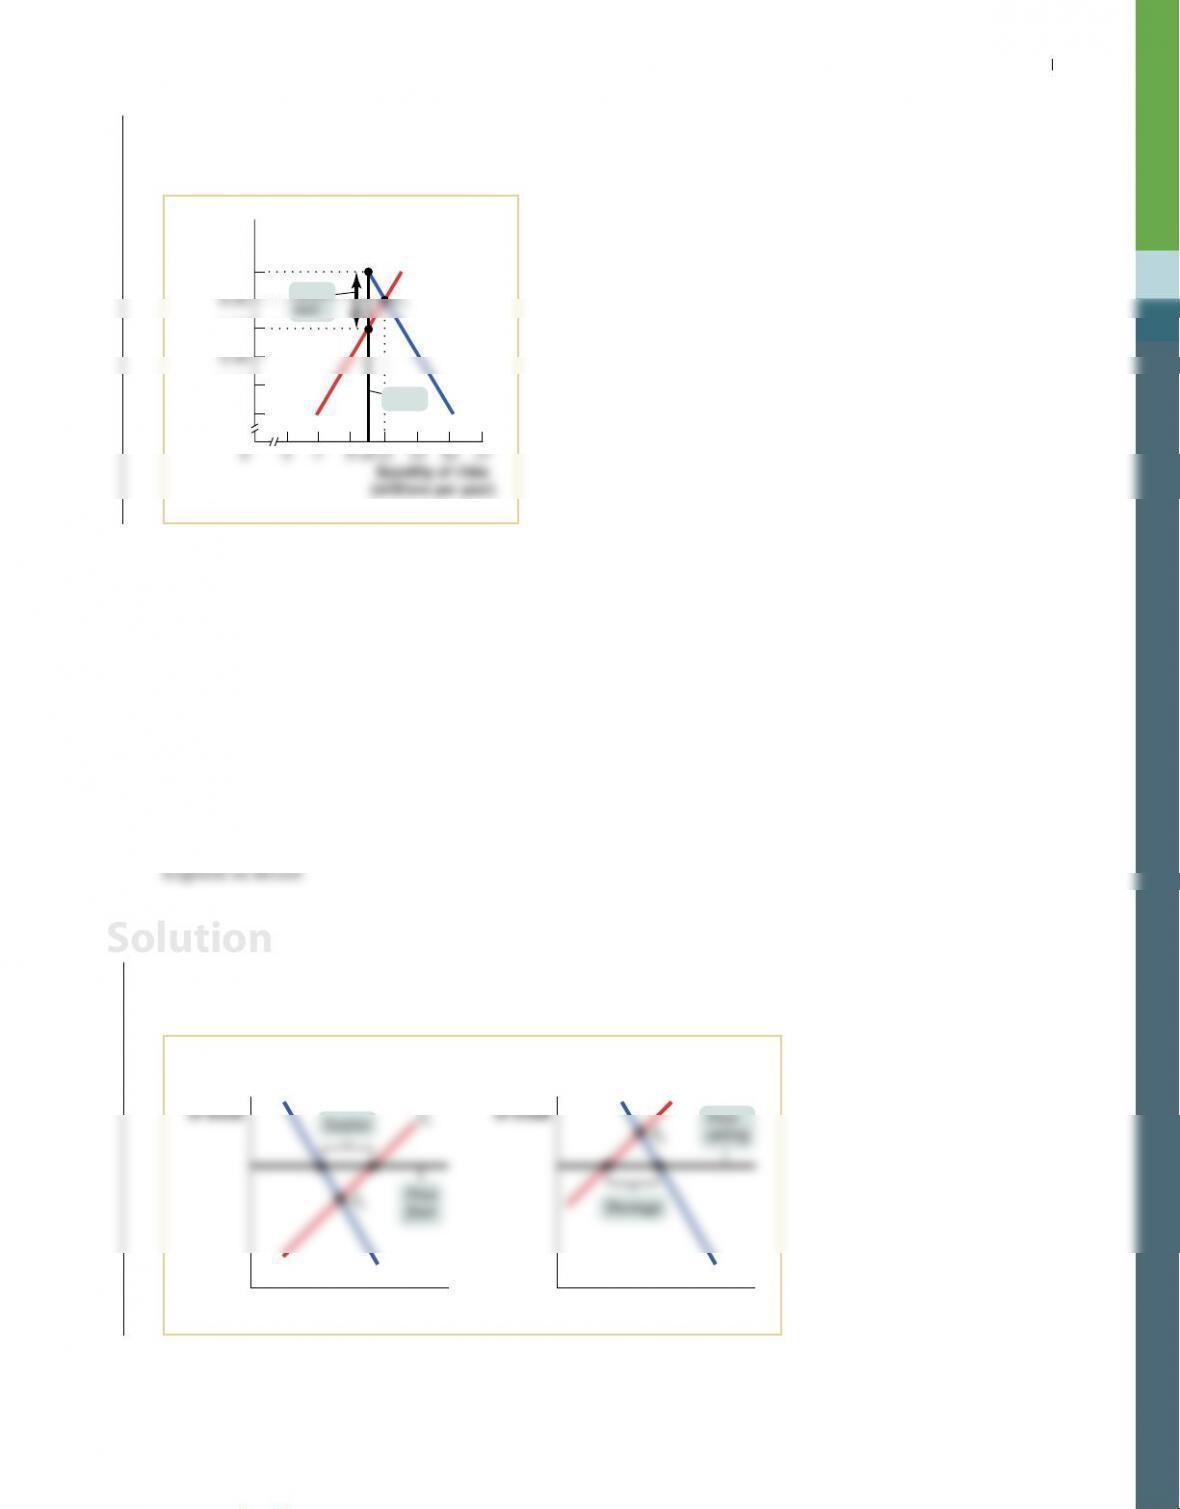
d. The accompanying diagram illustrates the effect of the quota of 10 million
taxi rides. The quantity of taxi rides is now 10 million, at a price of $7. The
quota rent per ride is $1.
S
$7.00
6.00
5.00
4.50
Fare
(per ride)
Quantity of rides
(millions per year)
D1
Quota
Quota
2. In the late eighteenth century, the price of bread in New York City was con-
trolled, set at a predetermined price above the market price.
a. Draw a diagram showing the effect of the policy. Did the policy act as a price
ceiling or a price floor?
b. What kinds of inefficiencies were likely to have arisen when the controlled
price of bread was above the market price? Explain in detail.
One year during this period, a poor wheat harvest caused a leftward shift in the
supply of bread and therefore an increase in its market price. New York bakers
found that the controlled price of bread in New York was below the market price.
c. Draw a diagram showing the effect of the price control on the market for
bread during this one–year period. Did the policy act as a price ceiling or a
price floor?
d. What kinds of inefficiencies do you think occurred during this period?
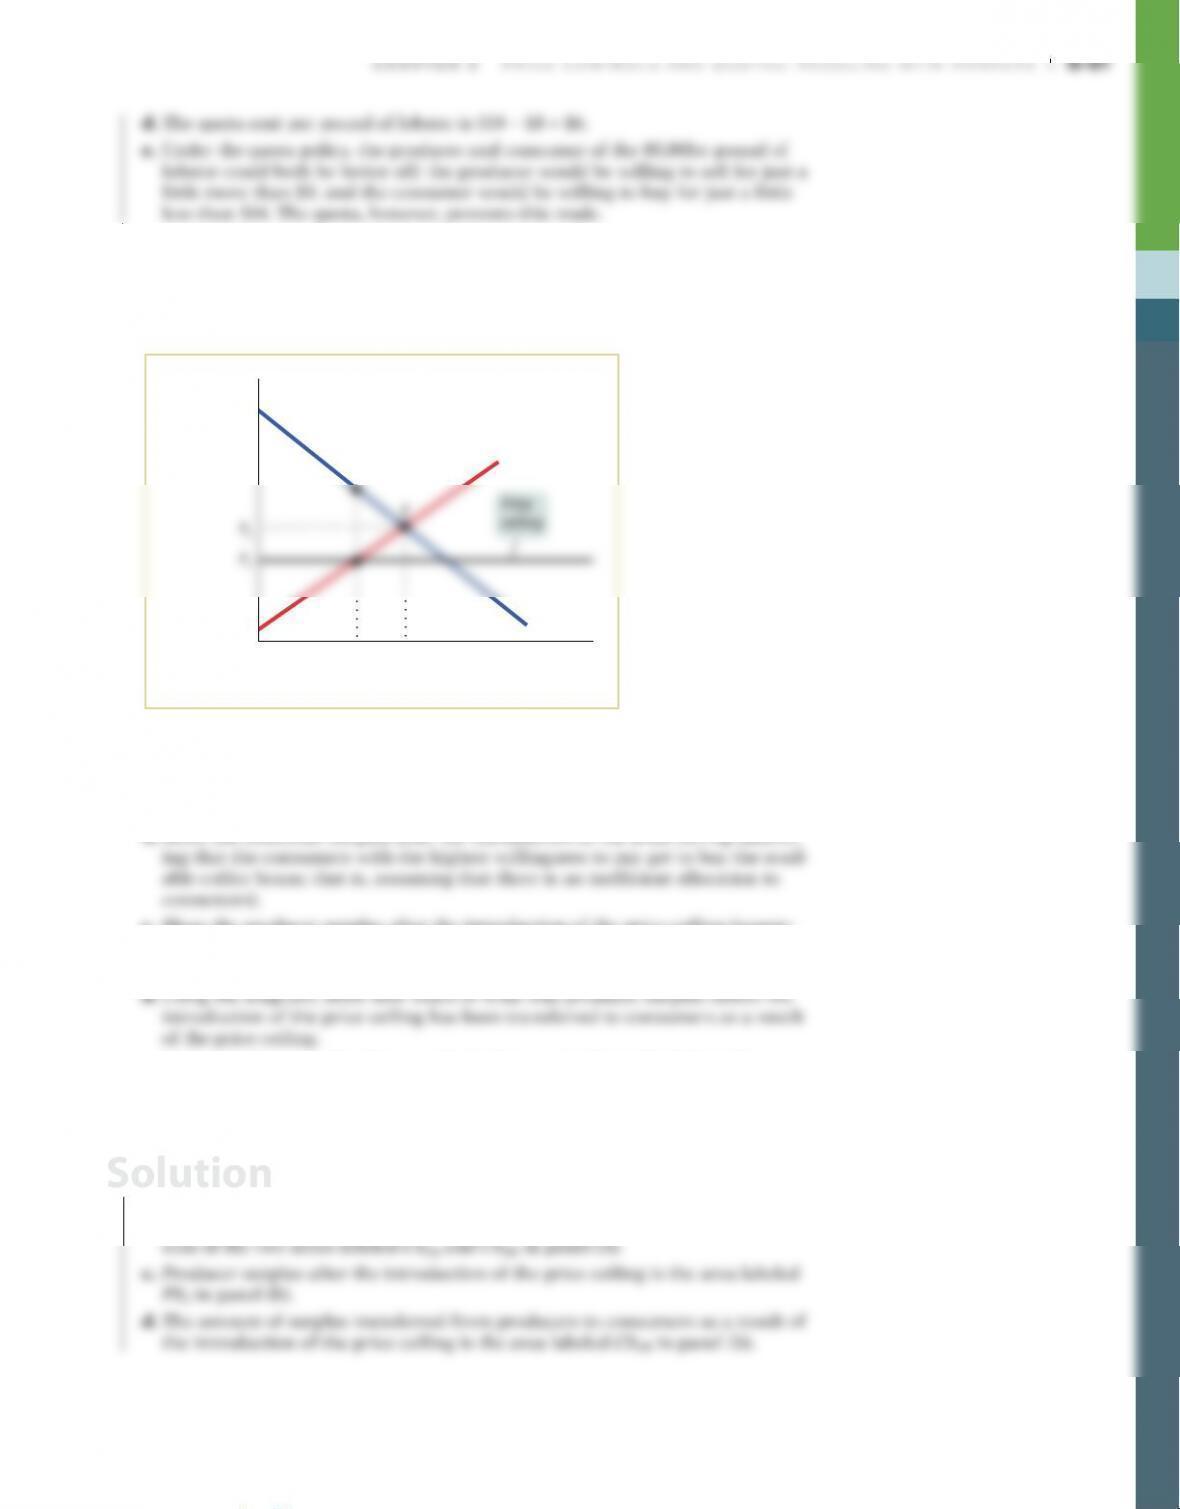
2. a. Panel (a) of the accompanying diagram illustrates the effect of this policy.
Since the price is set above the market equilibrium price, this policy acts as
a price floor: it raises the price artificially above the equilibrium. As a result,
too much bread is produced: there is a surplus.
Price
Quantity of bread
Price
Quantity of bread
S2
DD
Price
floor Shortage
Panel (a) Panel (b)
E1
Solution
S-72 Chapter 5 Price controls and Quotas: Meddling with Markets
b. As with all price floors above the equilibrium price, there are several associ-
ated inefficiencies. First, there is deadweight loss from inefficiently low quan-
tity. Some transactions that would have occurred at the unregulated market
c. Panel (b) illustrates the effect of the fixed price if the market equilibrium is
above that price. The set price now acts like a price ceiling, preventing the
price from rising to the equilibrium. There is a shortage, as occurs with every
price ceiling below the equilibrium price.
d. As with all price ceilings below the equilibrium price, there are several associ-
ated inefficiencies. First, there is deadweight loss from inefficiently low quan-
tity. There is a persistent shortage of bread, and some transactions that would
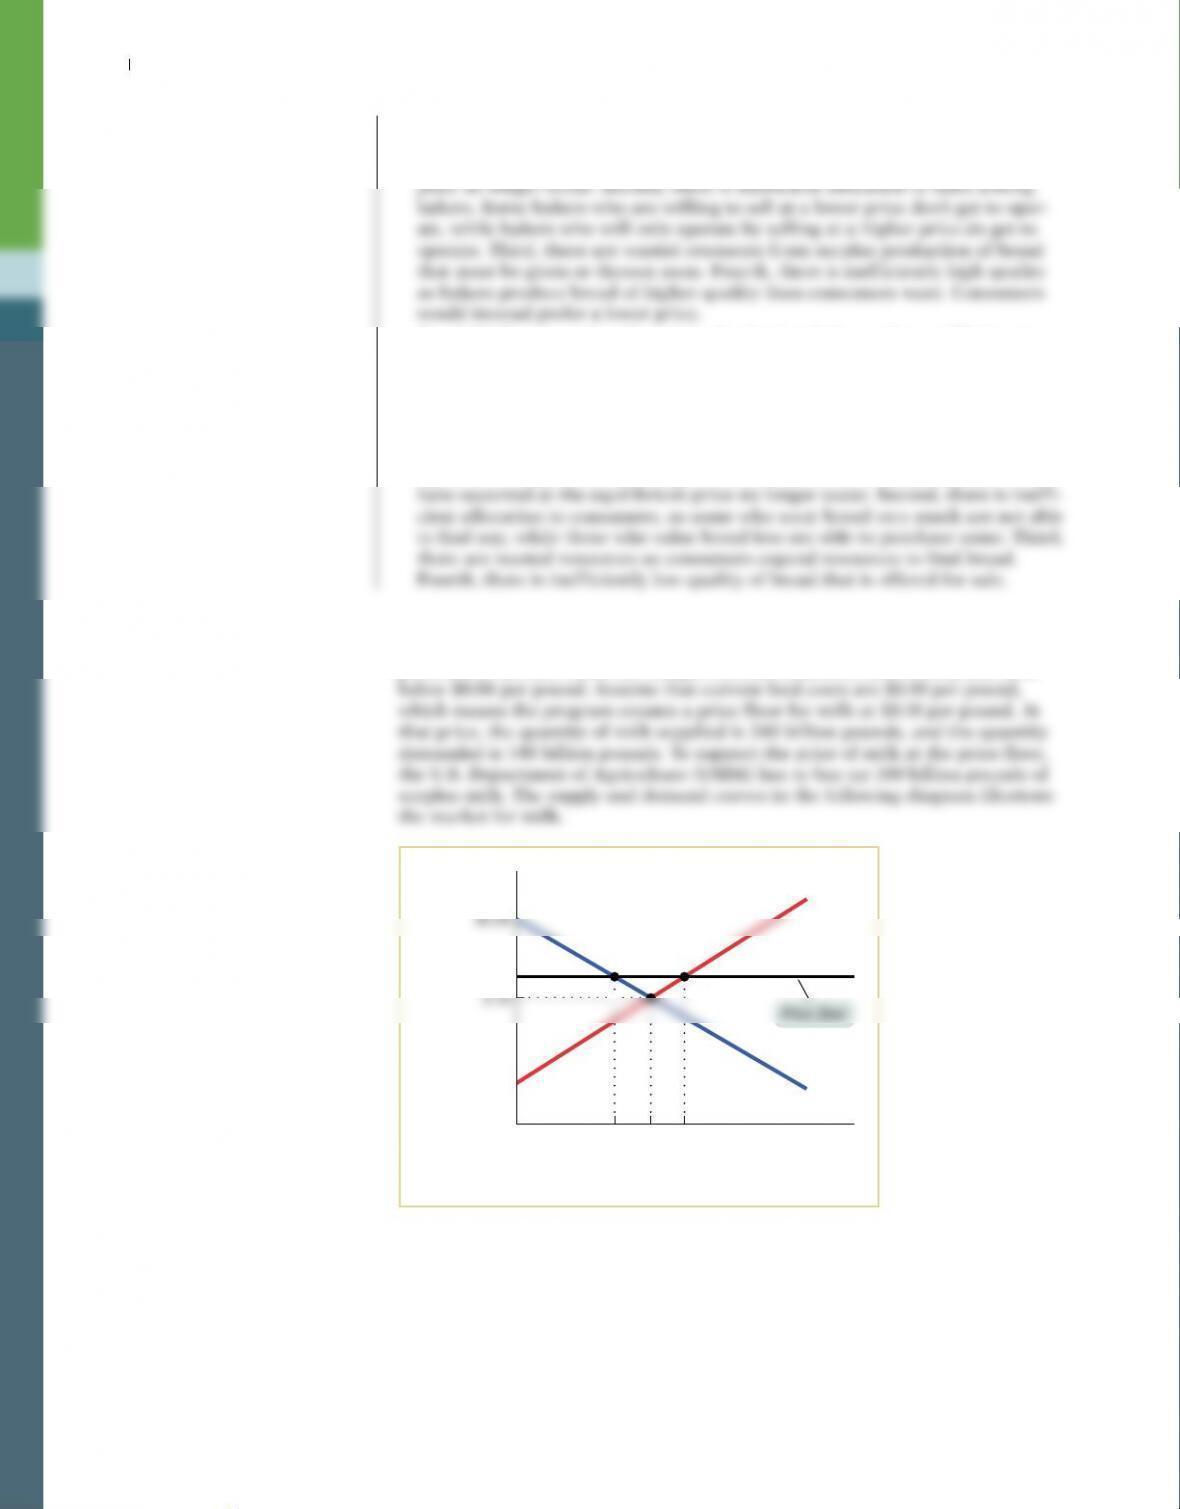
3. In 2014, the U.S. House of Representatives approved a new farm bill establish-
ing the Margin Protection Program (MPP) for dairy producers. The MPP sup–
ports dairy farmers when the margin between feed costs and milk prices falls
Price of milk
(per pound)
0
0.18
0.05
S
D
240200140
Quantity of
milk
(billions of pounds)
a. In the absence of a price floor, how much consumer surplus is created? How
much producer surplus? What is the total surplus (producer surplus plus con–
sumer surplus)?
b. With the price floor at $0.18 per pound of milk, consumers buy 140 billion
pounds of milk. How much consumer surplus is created now?
c. With the price floor at $0.18 per pound of milk, producers sell 240 billion
pounds of milk (some to consumers and some to the USDA). How much pro–
ducer surplus is created now?
d. How much money does the USDA spend to buy surplus milk?

3. a. In the absence of a price floor, consumer surplus is the area below the demand
curve but above the equilibrium price of $0.15: it is (($0.25 – $0.15) ×
b. With the price floor at $0.18 per pound, consumer surplus is the area below
the demand curve but above the price of $0.18: it is (($0.25 – $0.18) ×
140 billion)/2 = $4.9 billion.
d. The USDA buys 100 billion pounds of milk at a price of $0.18 per pound, for a
total of $0.18 × 100 billion = $18 billion.
4. The accompanying table shows hypothetical demand and supply schedules for
milk per year. The U.S. government decides that the incomes of dairy farmers
should be maintained at a level that allows the traditional family dairy farm
to survive. So it implements a price floor of $1 per pint by buying surplus milk
until the market price is $1 per pint.
Price of milk
(per pint)
Quantity of milk
(millions of pints per year)
Quantity demanded Quantity supplied
$1.20 550 850
1.00 650 750
0.80 750 650
a. In a diagram, show the deadweight loss from the inefficiently low quantity
bought and sold.
b. How much surplus milk will be produced as a result of this policy?
c. What will be the cost to the government of this policy?
d. Since milk is an important source of protein and calcium, the government
at any price by 50 million pints per year because they know their children
are getting milk at school. How much will the dairy program now cost the
government?
Solution
S-74 Chapter 5 Price controls and Quotas: Meddling with Markets
4. a. The deadweight loss is shown in the accompanying diagram by the shaded
triangle.
b. With demand of D1 and supply of S, the equilibrium would be at point E1 in
the accompanying diagram. However, with a price floor at $1, the quantity
supplied is 750 million pints and the quantity demanded is 650 million pints.
So the policy causes a surplus of milk of 100 million pints per year.
S
1.10
0.90
0
Price of milk
(per pint)
Quantity of milk
(millions of pints per year)
500 550 600 650 700 750 850800
D1
E1Price
100 million pints
Deadweight
c. In order to sustain this price floor (to prevent black market sales of surplus
milk below the price floor), the government has to buy up the surplus of milk.
Buying 100 million pints of milk at a price of $1 each costs the government
$100 million.
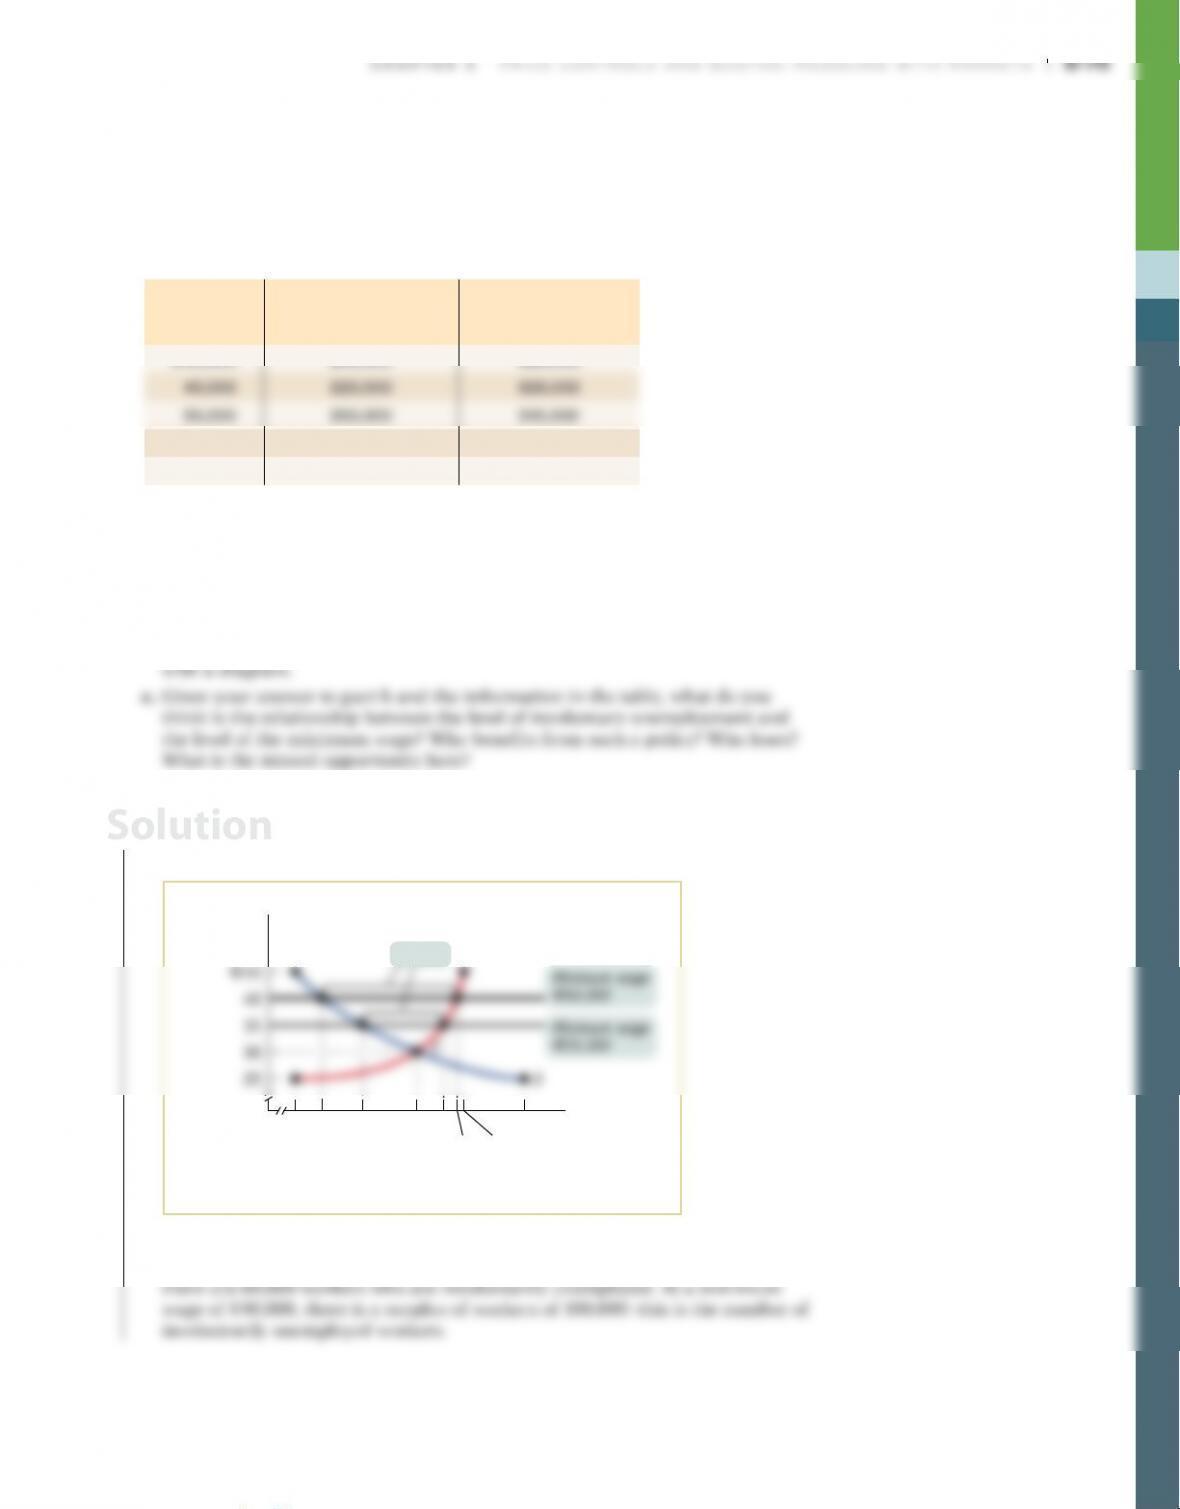
d. As a result of sales of cheap milk to schools, the quantity demanded falls by
50 million pints per year at any price: the demand curve shifts leftward to the
new demand curve D2. Without the price floor, the equilibrium would now
S
$1.20
1.00
0.80
0
Price of milk
(per pint)
Quantity of milk (millions of pints per year)
500 600 700 750675 800 850
D1
D2
Surplus of
150 million pints
e. Some milk producers are inefficient: if the price was allowed to reach equi-
librium, they would find it too costly to produce. In their absence, milk would
be produced only by the most efficient producers. Furthermore, resources
Solution
5. European governments tend to make greater use of price controls than does
the U.S. government. For example, the French government sets minimum start-
ing yearly wages for new hires who have completed le bac, certification roughly
equivalent to a high school diploma. The demand schedule for new hires with
le bac and the supply schedule for similarly credentialed new job seekers are
given in the accompanying table. The price here—given in euros, the currency
used in France—is the same as the yearly wage.
Wage
(per year)
Quantity demanded
(new job offers
per year)
Quantity supplied
(new job seekers
per year)
€45,000 200,000 325,000
30,000 290,000 290,000
25,000 370,000 200,000
a. In the absence of government interference, what are the equilibrium wage and
number of graduates hired per year? Illustrate with a diagram. Will there be
anyone seeking a job at the equilibrium wage who is unable to find one—that
is, will there be anyone who is involuntarily unemployed?
b. Suppose the French government sets a minimum yearly wage of €35,000. Is
there any involuntary unemployment at this wage? If so, how much? Illustrate
with a diagram. What if the minimum wage is set at €40,000? Also illustrate
5. a. The equilibrium wage is €30,000, and 290,000 workers are hired. There is full
employment: nobody is involuntarily unemployed. The equilibrium is at point E.
S
0
Wage
(thousands
per year)
Quantity of workers
(thousands per year)
200 220 250 290 310
320 325
370
Surplus
b. With a minimum wage of €35,000, there is a surplus of workers of 60,000 (the
quantity supplied is 310,000 and the quantity demanded is 250,000). That is,
Solution

S-76 Chapter 5 Price controls and Quotas: Meddling with Markets
c. The higher the minimum wage, the larger the amount of involuntary unem-
ployment. The people who benefit from this policy are those workers who
6. In many European countries high minimum wages have led to high levels of
unemployment and underemployment, and to a two-tier labor system. In the
formal labor market, workers have good jobs that pay at least the minimum
wage. In the informal, or black market for labor, workers have poor jobs and
receive less than the minimum wage.
a. Draw a demand and supply diagram showing the effect of the imposition of a
minimum wage on the overall market for labor, with wage on the vertical axis
and hours of labor on the horizontal axis. Your supply curve should represent
the hours of labor offered by workers according to the wage, and the demand
b. Assume that the imposition of the high minimum wage causes a contraction
in the economy so that employers in the formal sector cut their production
and their demand for workers. Illustrate the effect of this on the overall mar-
ket for labor. What happens to the size of the deadweight loss? The shortage?
Illustrate with a diagram.
c. Assume that the workers who cannot get a job paying at least the minimum
wage move into the informal labor market where there is no minimum wage.
What happens to the size of the informal market for labor as a result of the
economic contraction? What happens to the equilibrium wage in the informal
labor market? Illustrate with a supply and demand diagram for the informal
market.
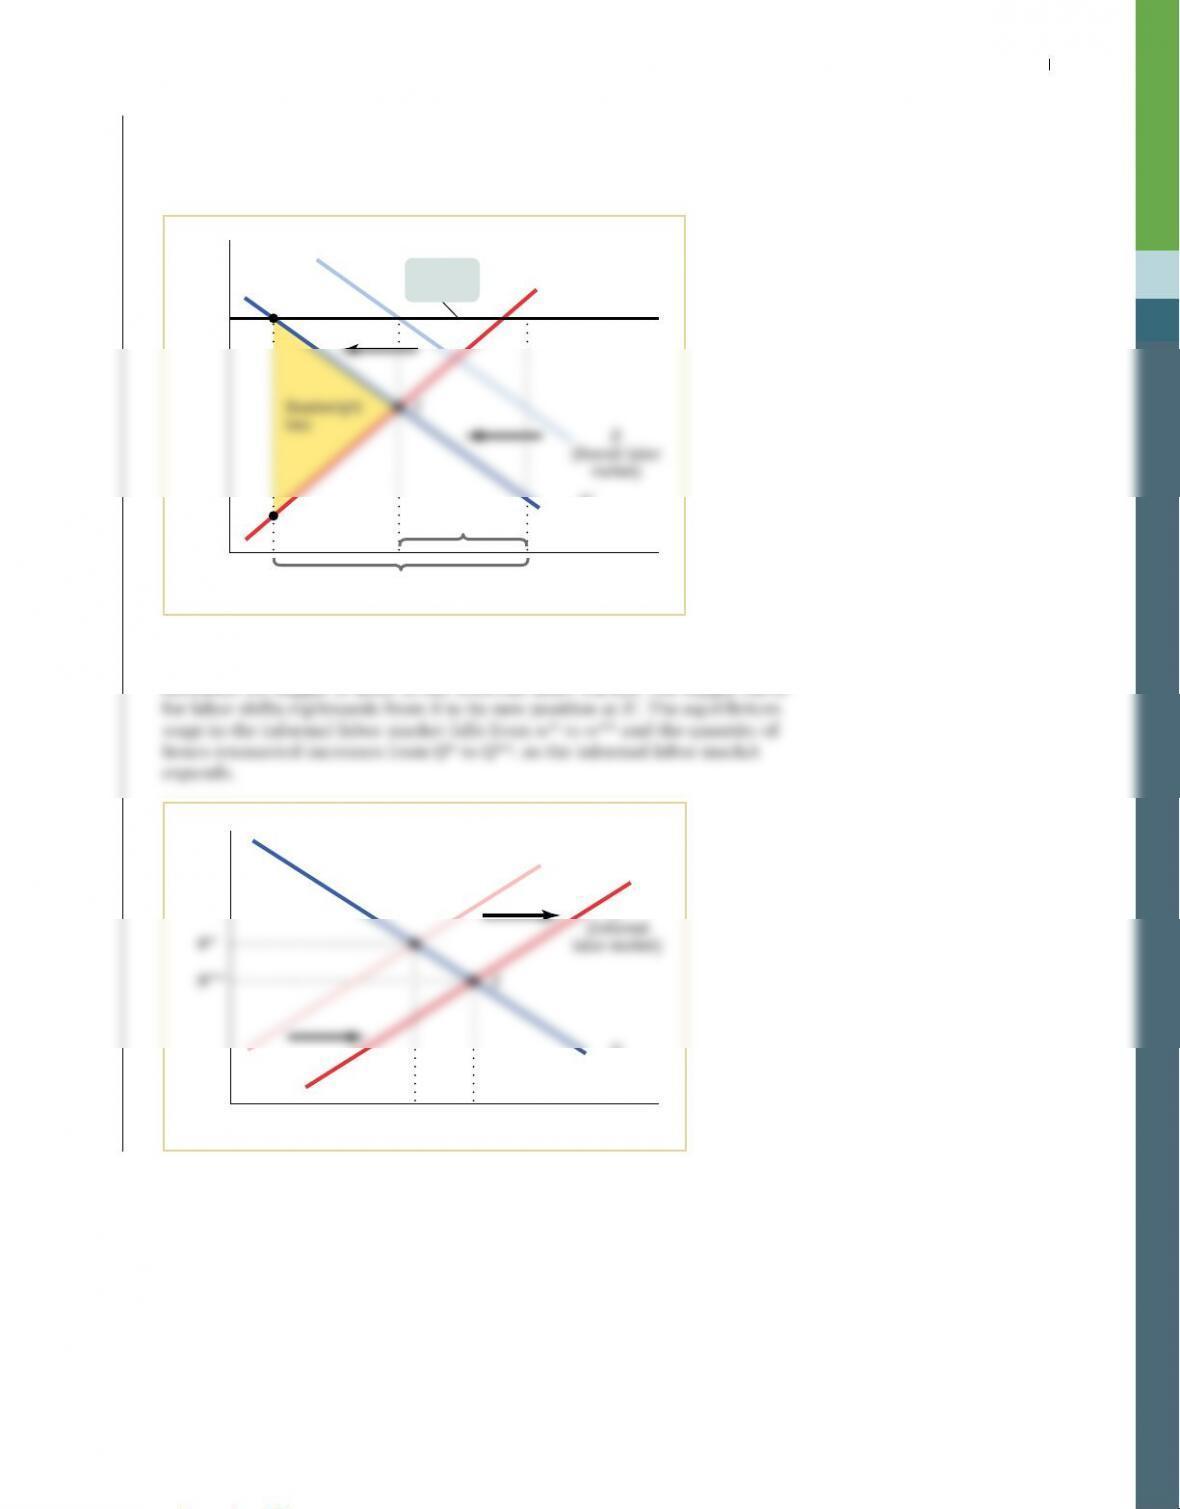
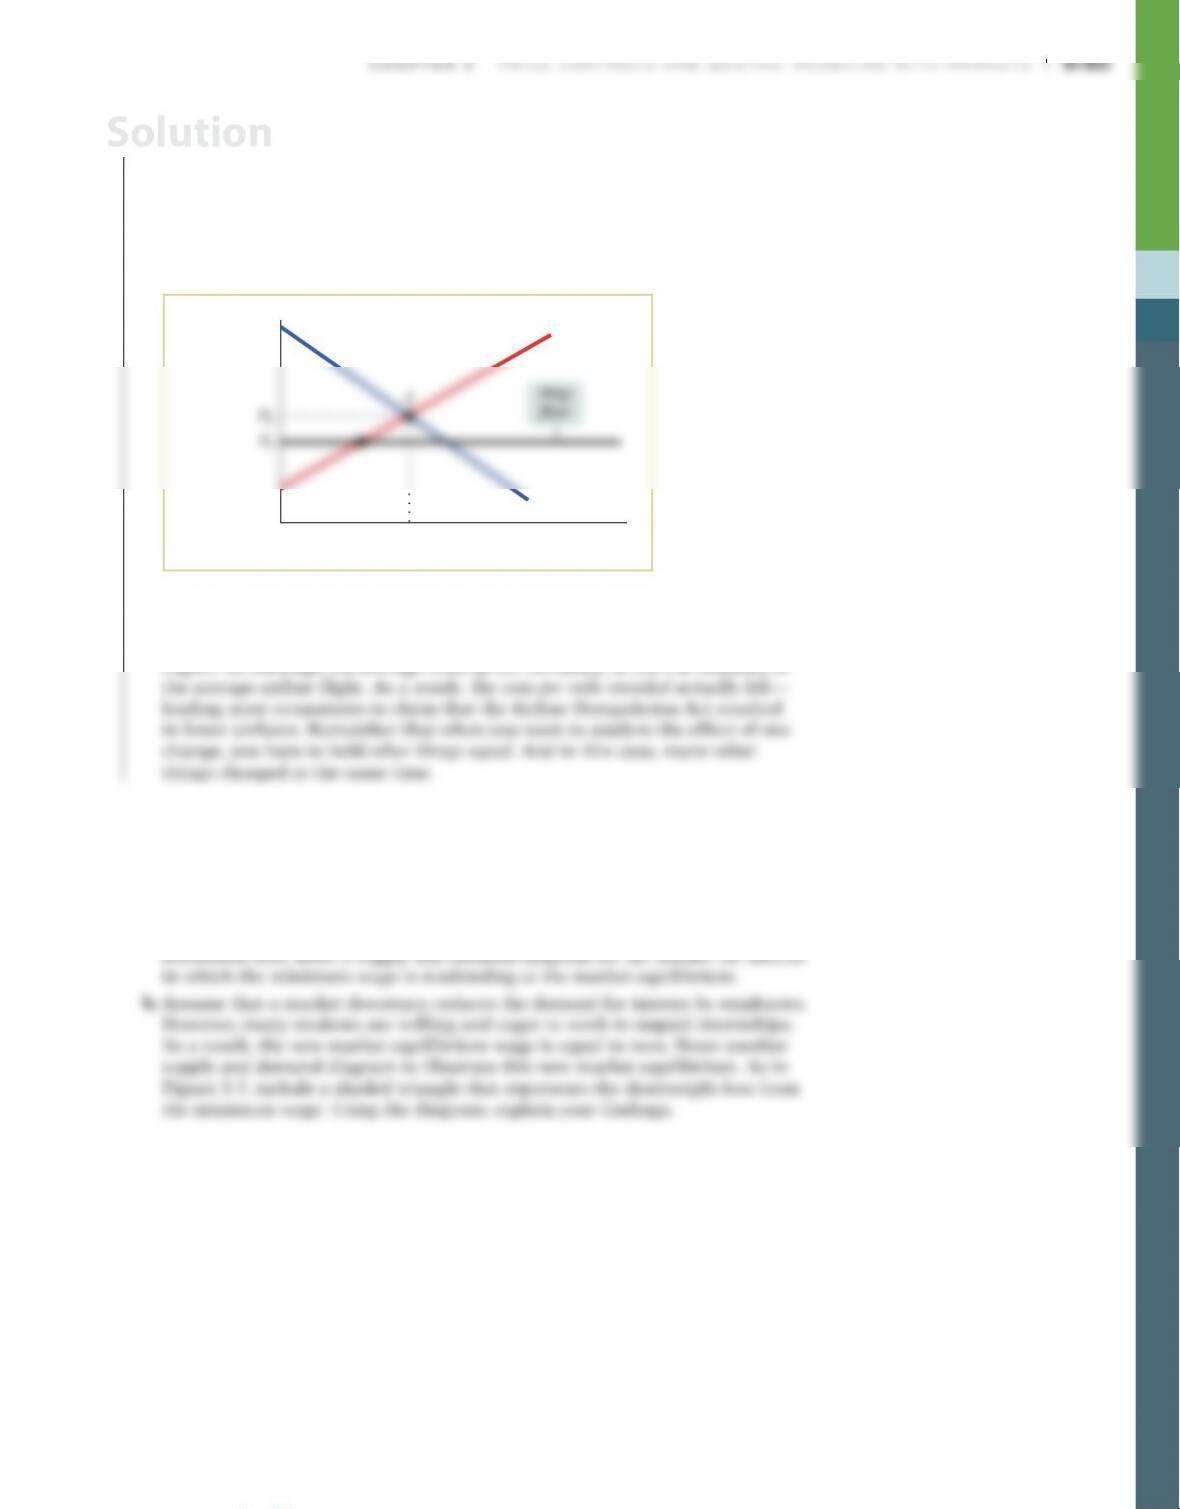
6. a. The shortage created is a shortage of jobs: at the minimum wage there are
more job–seekers than there are jobs available.
S
(Overall labor mark
et)
Shortage
Hours work
ed
Wage
Minimum
(Overall labor mark
et)
Solution
Chapter 5 Price controls and Quotas: Meddling with Markets S-77
b. The contraction in the economy causes the demand for labor to fall, shifting
the demand curve leftwards from D to its new position at D′. Both the dead-
weight loss and the shortage of jobs caused by the minimum wage increase as
a result of the fall in the demand for labor.
D’
(Overall labor
market)
New shortage
Old shortage
Hours worked
Wage
Minimum
wage
loss
S
(Overall labor mark
et)
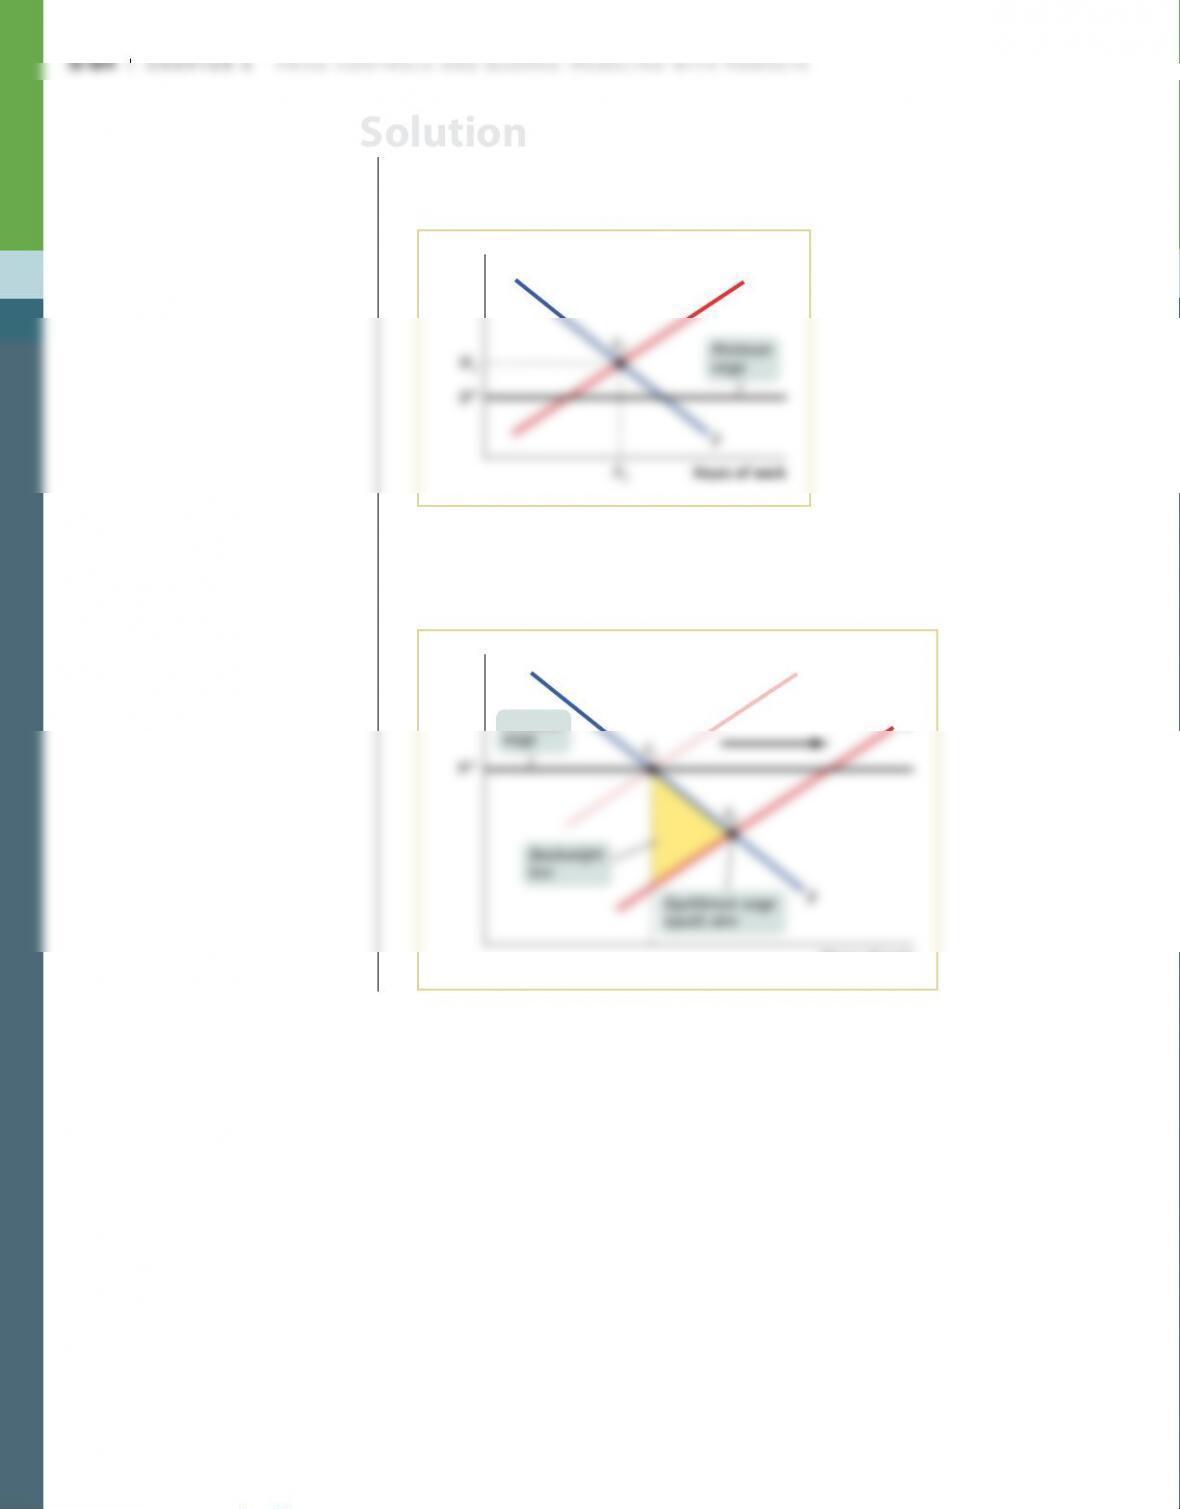
c. As a result of the economic contraction, which reduces the demand for work–
ers in the overall market, workers move to the informal labor market. This
increases the supply of labor in the informal labor market. The supply curve
Wage
S (Informal
labor market)
S’
7. For the last 80 years the U.S. government has used price supports to provide
income assistance to American farmers. To implement these price supports, at
times the government has used price floors, which it maintains by buying up
1,2001,000800
$5
4
Price of corn
(per bushel)
Quantity of corn (bushels)
S
a. If the government sets a price floor of $5 per bushel, how many bushels of
corn are produced? How many are purchased by consumers? By the govern-
ment? How much does the program cost the government? How much revenue
do corn farmers receive?
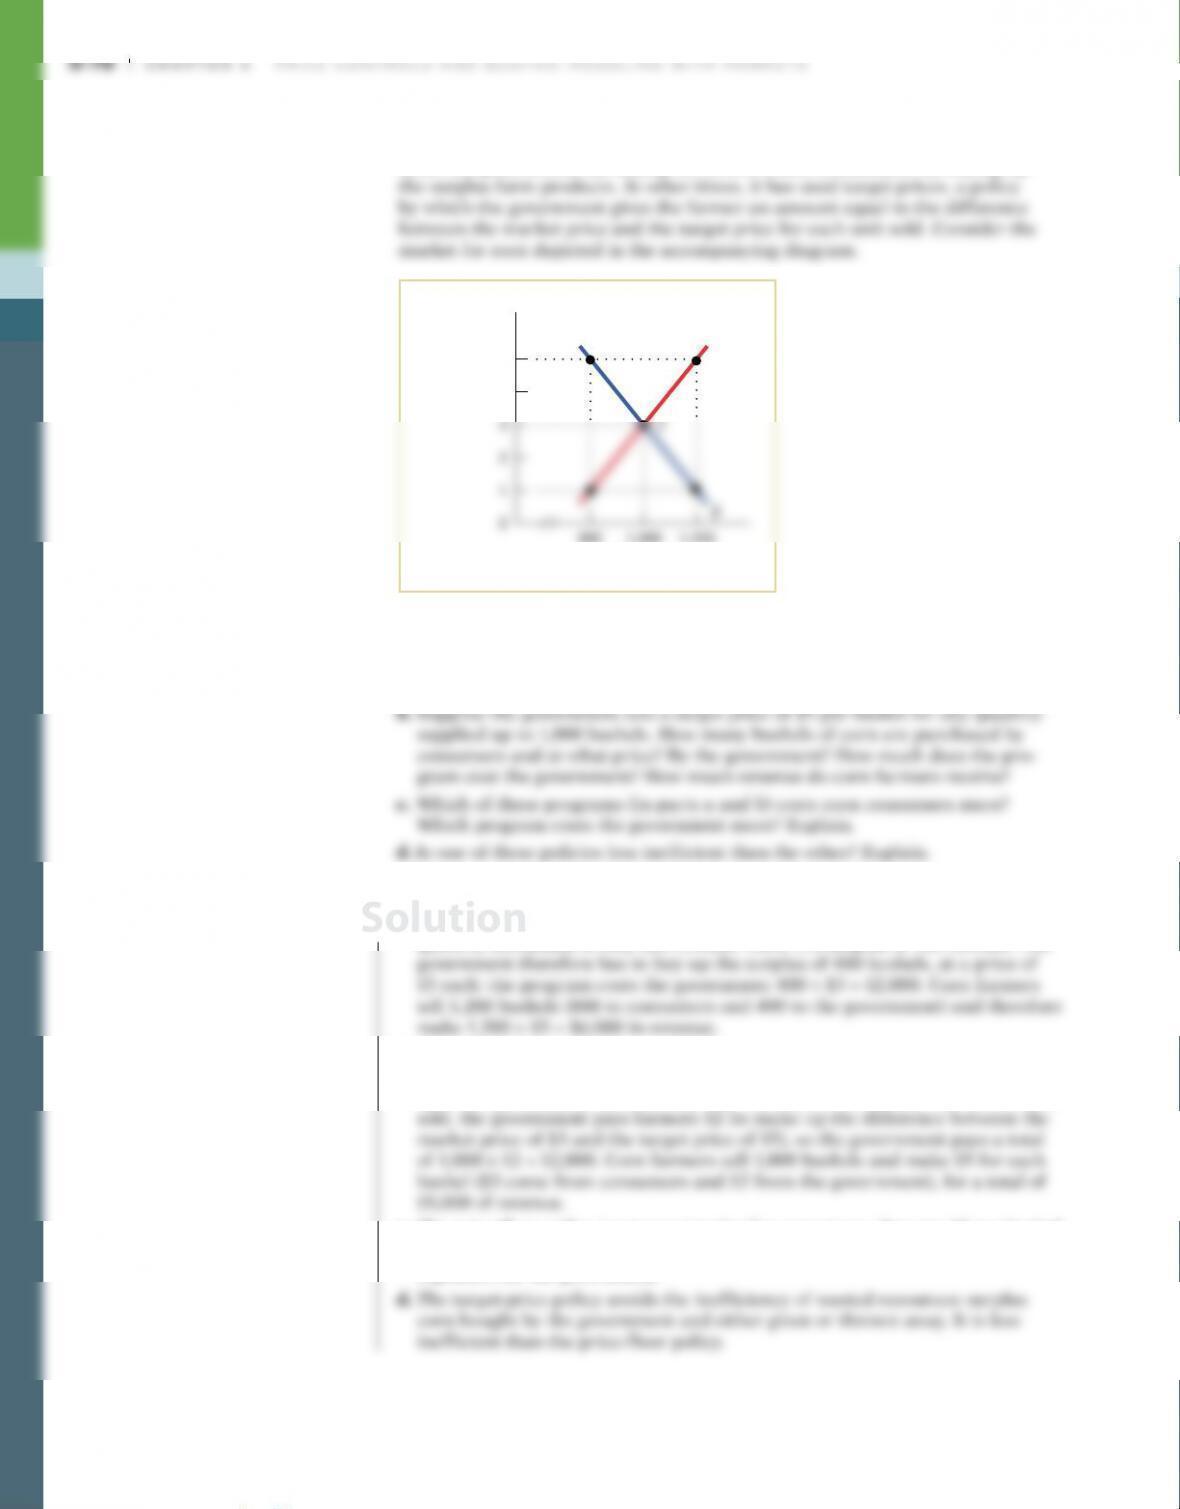
7. a. With a price floor of $5, the quantity of corn supplied is 1,200 bushels. The
quantity demanded is only 800 bushels: there is a surplus of 400 bushels. The
b. If the government sets a target price of $5, the market reaches equilibrium at
a price of $3 and a quantity of 1,000 bushels. There is no surplus (or short-
age). The government does not buy any corn under this policy. For each bushel
c. The price–floor policy is more expensive for consumers: they pay $5 per bushel
(compared to the $3 under the target-price policy). Both policies are equally
expensive for the government.
Solution
8. The waters off the North Atlantic coast were once teeming with fish. But due
to overfishing by the commercial fishing industry, the stocks of fish became
seriously depleted. In 1991, the National Marine Fishery Service of the U.S. gov-
Price of swordfish
(per pound)
Quantity of swordfish
(millions of pounds per year)
Quantity demanded Quantity supplied
$20 6 15
18 7 13
a. Use a diagram to show the effect of the quota on the market for swordfish in
1991. In your diagram, illustrate the deadweight loss from inefficiently low
quantity.
b. How do you think fishermen will change how they fish in response to this
policy?
8. a. The quantity sold is 7 million pounds, at a price of $18 per pound. On each
pound of fish caught, each fisherman earns quota rent of $6, as shown in the
accompanying diagram. The shaded triangle shows the deadweight loss.
S
$20
0
Price of swordfish
(per pound)
Quantity of swordfish
(million pounds per year)
678910 11 15141312
D
Quota
Quota
b. Because each pound of swordfish gives a fisherman $6 quota rent, each fisher-
Solution

S-80 Chapter 5 Price controls and Quotas: Meddling with Markets
9. In Maine, you must have a license to harvest lobster commercially; these licenses
are issued yearly. The state of Maine is concerned about the dwindling supplies
of lobsters found off its coast. The state fishery department has decided to place
a yearly quota of 80,000 pounds of lobsters harvested in all Maine waters. It has
also decided to give licenses this year only to those fishermen who had licenses
last year. The accompanying diagram shows the demand and supply curves for
Maine lobsters.
120804020 60 100 1400
8
6
4
Price of
lobster
(per pound)
Quantity of lobsters (thousands of pounds)
D
a. In the absence of government restrictions, what are the equilibrium price and
quantity?
b. What is the demand price at which consumers wish to purchase 80,000 pounds
of lobsters?
c. What is the supply price at which suppliers are willing to supply 80,000 pounds
of lobsters?
d. What is the quota rent per pound of lobster when 80,000 pounds are sold?
9. a. Without government restrictions, the equilibrium in the market for lobsters is
at point E. The equilibrium price for lobsters is $10 per pound. At that price,
the quantity demanded and the quantity supplied are 120,000 pounds of
lobsters.
$22
20
0
Price of lobster
(per pound)
Quantity of lobsters
(thousands of pounds)
20 40 60 100
140
12080
Quota
b. The demand price of 80,000 pounds of lobsters is $14.
c. The supply price of 80,000 pounds of lobsters is $8.
Solution
10. The Venezuelan government has imposed a price ceiling on the retail price of
roasted coffee beans. The accompanying diagram shows the market for coffee
beans. In the absence of price controls, the equilibrium is at point E, with an
equilibrium price of PE and an equilibrium quantity bought and sold of QE.
Quantity of coffee beans
Price of
co
ffee beans
S
D
QCQE
a. Show the consumer and producer surplus before the introduction of the price
ceiling.
After the introduction of the price ceiling, the price falls to PC and the quantity
bought and sold falls to QC.
b. Show the consumer surplus after the introduction of the price ceiling (assum–
c. Show the producer surplus after the introduction of the price ceiling (assum–
ing that the producers with the lowest cost get to sell their coffee beans; that
is, assuming that there is no inefficient allocation of sales among producers).
e. Using the diagram, show how much of what was total surplus before the
introduction of the price ceiling has been lost. That is, how great is the
deadweight loss?
10. a. Consumer surplus is the area labeled CS1 and producer surplus is the area
labeled PS1 in panel (a) of the accompanying diagram.
b. Consumer surplus after the introduction of the price ceiling is made up of the
Solution

S-82 Chapter 5 Price controls and Quotas: Meddling with Markets
e. The amount of total surplus lost as a result of the introduction of the price
ceiling, the deadweight loss, is the area labeled deadweight loss in panel (b).
QE
QC
Quantity of coffee beans
Price of
coffee
QE
Quantity of coffee beans
Price
of
coffee
(a) Before the Introduction
of the Price Ceiling
(b) After the Introduction
of the Price Ceiling
Deadweight
11. The accompanying diagram shows data from the U.S. Bureau of Labor Statis-
tics on the average price of an airline ticket in the United States from 1975 until
1985, adjusted to eliminate the effect of inflation (the general increase in the
11. a. When a binding price floor—one that is set above the equilibrium price—is
removed, you should expect the price of the good to fall. From looking at the
data in the figure, you should think that the pre–1978 price floor was inef-
fective, since the price of an airline ticket actually rose after 1978. In the
accompanying diagram, the price floor, PF, is nonbinding: it is set below the
equilibrium price, PE. In that case, removing the price floor would not lead to
a decrease in price.
QE
D
S
Quantity of airline tickets
Price of
airline tick
et
b. Many things that determine the price of an average airline ticket changed in
1978; the removal of the price floor on airline tickets was just one of them.
What also changed was that airlines now could—and did—offer longer–range
flights. So although the average ticket price increased, so did the distance of
12. Many college students attempt to land internships before graduation to burnish
their resumes, gain experience in a chosen field, or try out possible careers.
The hope shared by all of these prospective interns is that they will find intern-
ships that pay more than typical summer jobs, such as waiting tables or flipping
burgers.
a. With wage measured on the vertical axis and number of hours of work on the
Solution
12. a. Here the market-clearing wage, W1, is nonbinding because it is above the
minimum wage. In this case the minimum wage has no effect on the market
for interns: the number of hours transacted in the market equilibrium, X1, is
the same as if there had been no minimum wage.
S1
Wage
Solution

Chapter 5 Price controls and Quotas: Meddling with Markets S-85
WORK IT OUT Interactive step-by-step help with solving this
problem can be found online.
13. Suppose it is decided that rent control in New York City will be abolished
and that market rents will now prevail. Assume that all rental units are iden-
tical and so are offered at the same rent. To address the plight of residents
a. Use a diagram to show the effect on the rental market of the elimination
of rent control. What will happen to the quality and quantity of rental
housing supplied?
b. Use a second diagram to show the additional effect of the income–supple–
ment policy on the market. What effect does it have on the market rent
and quantity of rental housing supplied in comparison to your answers to
part a?
c. Are tenants better or worse off as a result of these policies? Are landlords
better or worse off? Is society as a whole better or worse off?
13. a. With a price ceiling at PC, the quantity bought and sold is QC, indicated by
point A. The ceiling at PC is eliminated and the rent returns to the market
equilibrium E1, with an equilibrium rent of P1. The quantity supplied increases
from QC to the equilibrium quantity Q1. At the same time, you should expect
the quality of rental housing to improve. As you learned in this chapter, one
of the inefficiencies caused by price ceilings is inefficiently low quality. As
the rent returns to the equilibrium rent, landlords again have the incentive to
invest in the quality of their apartments in order to attract renters.
Q1
S
QCQuantity of apartments
Monthly
rent
Solution
S-86 Chapter 5 Price controls and Quotas: Meddling with Markets
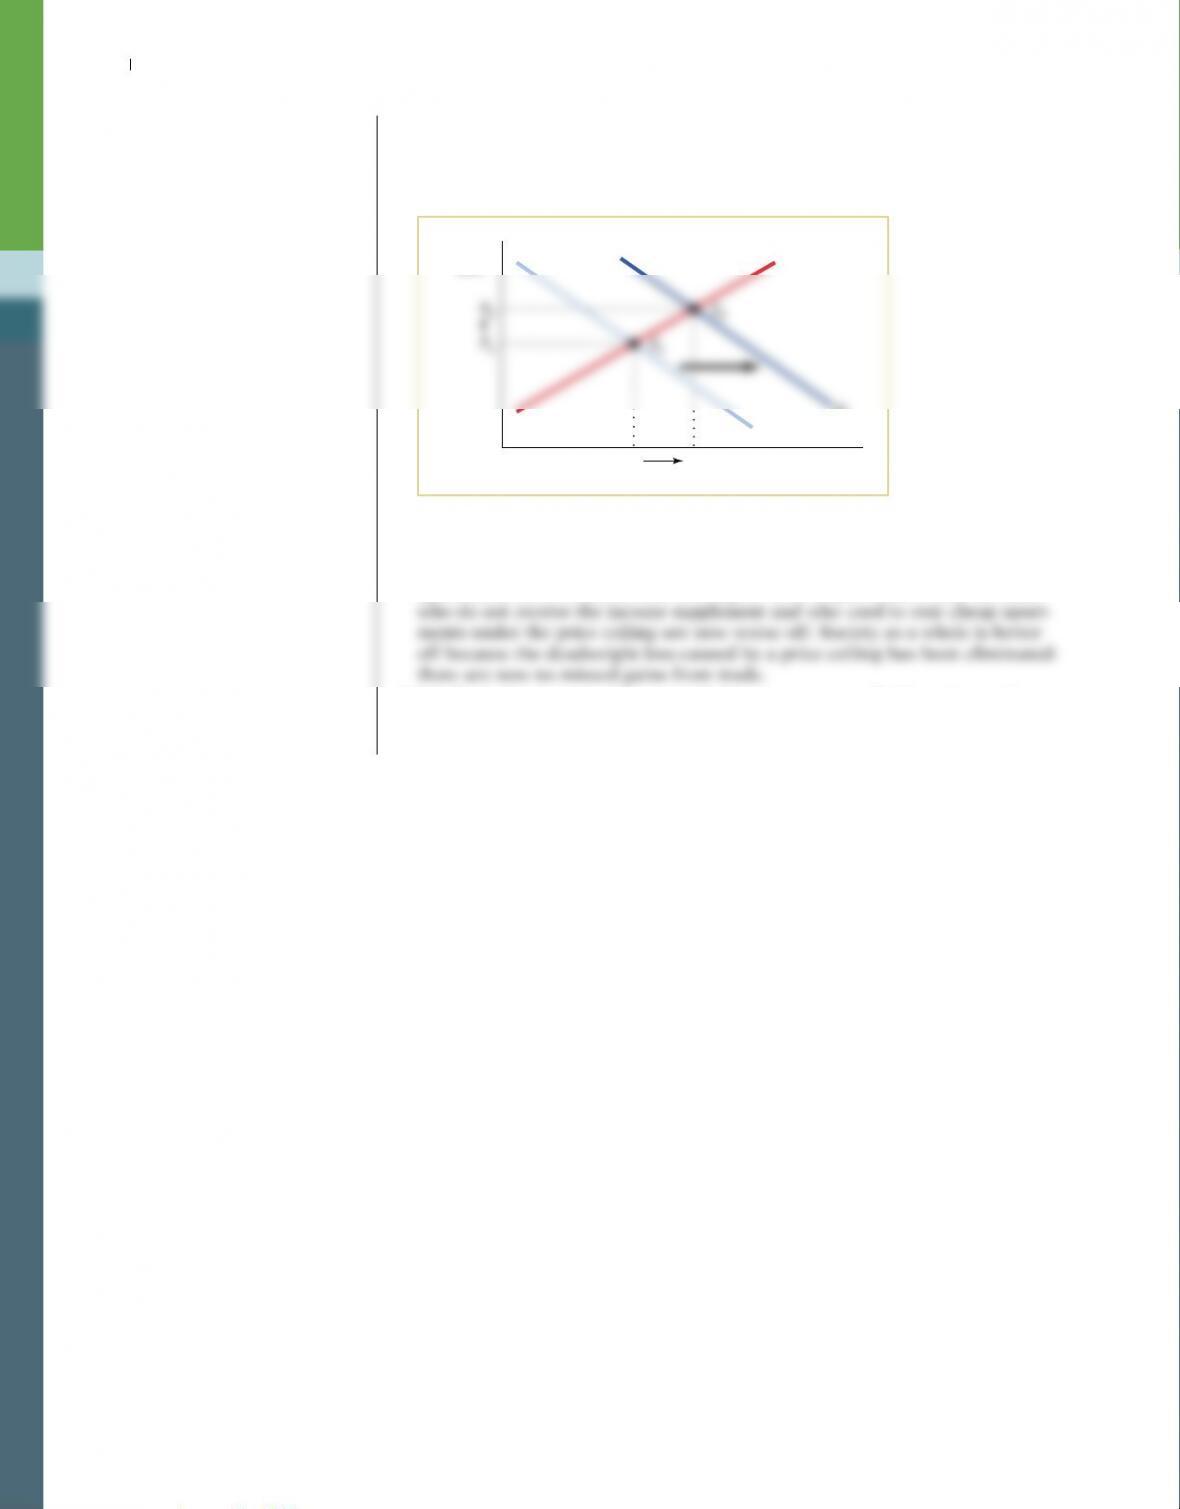
b. The income–supplement policy causes a rightward shift of the demand curve
from D1 to D2. This results in an increase in the equilibrium rent, from P1 to
P2, and an increase in the equilibrium quantity, from Q1 to Q2, as the equilib-
rium changes from E1 to E2.
Q2
D1
D2
S
Q1Quantity of apartments
Monthly
rent
c. Landlords are clearly better off as a result of these two policies: more land-
lords rent out apartments, and at a higher monthly rent. It is not clear whether
tenants are better or worse off. Some tenants who previously could not get
apartments can now do so, but at a higher rent. In particular, those tenants
d. It is likely that tenants who currently live in rent–controlled housing are better
organized than people who cannot currently find rental housing. And more
organized groups can generally exert greater influence over city policy.