80
WHAT’S NEW IN THE EIGHTH EDITION:
A new question has been added to the Problems and Applications section.
LEARNING OBJECTIVES:
By the end of this chapter, students should understand:
➢ the meaning of the elasticity of demand.
➢ what determines the elasticity of demand.
➢ the meaning of the elasticity of supply.
➢ what determines the elasticity of supply.
➢ the concept of elasticity in three very different markets (the market for wheat, the market for oil, and
the market for illegal drugs).
CONTEXT AND PURPOSE:
Chapter 5 is the second chapter of a three-chapter sequence that deals with supply and demand and how
markets work. Chapter 4 introduced supply and demand. Chapter 5 shows how much buyers and sellers
respond to changes in market conditions. Chapter 6 will address the impact of government policies on
competitive markets.
KEY POINTS:
• The price elasticity of demand measures how much the quantity demanded responds to changes in
the price. Demand tends to be more elastic if close substitutes are available, if the good is a luxury
rather than a necessity, if the market is narrowly defined, or if buyers have substantial time to react
to a price change.
5
ELASTICITY AND ITS
APPLICATION
Chapter 5/Elasticity and Its Application ❖ 81
• The price elasticity of demand is calculated as the percentage change in quantity demanded divided
by the percentage change in price. If quantity demanded moves proportionately less than the price,
then the elasticity is less than one, and demand is said to be inelastic. If quantity demanded moves
proportionately more than the price, then the elasticity is greater than one, and demand is said to be
elastic.
• Total revenue, the total amount paid for a good, equals the price of the good times the quantity sold.
For inelastic demand curves, total revenue moves in the same direction as the price. For elastic
demand curves, total revenue moves in the opposite direction as the price.
• The income elasticity of demand measures how much the quantity demanded responds to changes in
consumers’ income. The cross-price elasticity of demand measures how much the quantity demanded
of one good responds to the price of another good.
• The tools of supply and demand can be applied in many different kinds of markets. This chapter uses
them to analyze the market for wheat, the market for oil, and the market for illegal drugs.
CHAPTER OUTLINE:
I. The Elasticity of Demand
A. Definition of elasticity: a measure of the responsiveness of quantity demanded or
quantity supplied to one of its determinants.
B. The Price Elasticity of Demand and Its Determinants
1. Definition of price elasticity of demand: a measure of how much the quantity
demanded of a good responds to a change in the price of that good, computed as
the percentage change in quantity demanded divided by the percentage change in
price.
2. Determinants of the Price Elasticity of Demand
a. Availability of Close Substitutes: the more substitutes a good has, the more elastic its
demand.
82 ❖ Chapter 5/Elasticity and Its Application
d. Time Horizon: goods tend to have more elastic demand over longer time horizons.
C. Computing the Price Elasticity of Demand
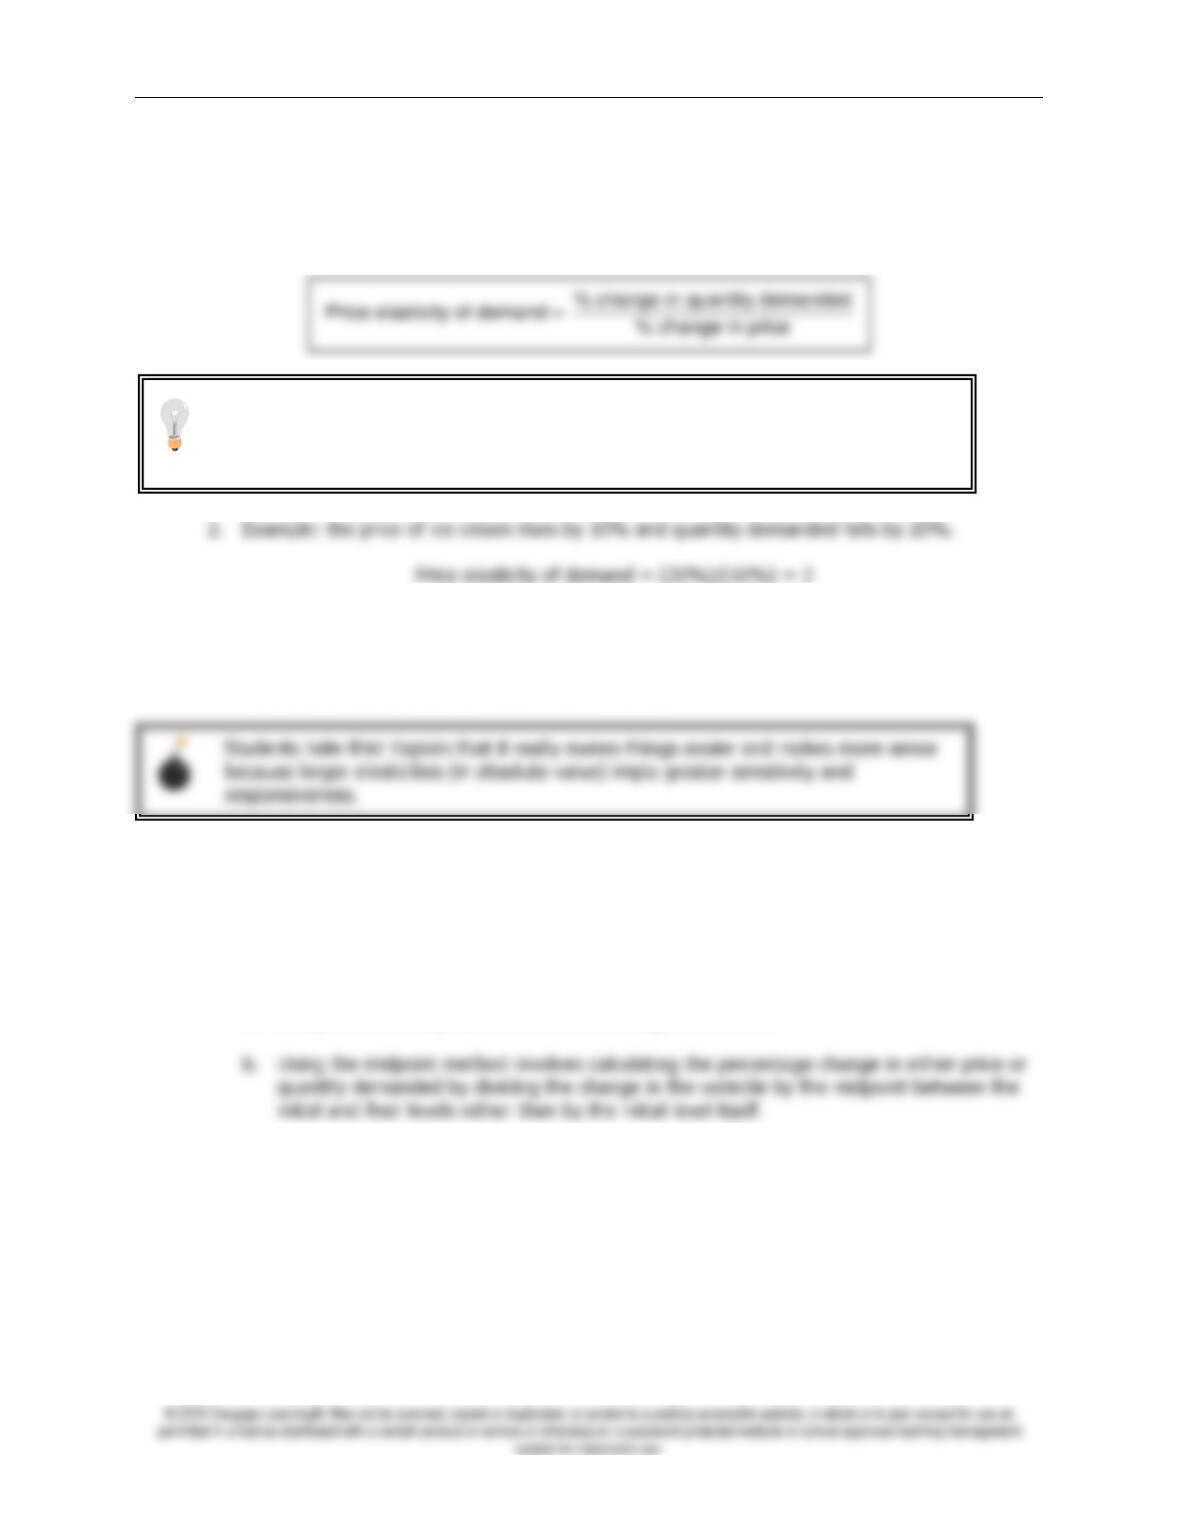
1. Formula
3. Because there is an inverse relationship between price and quantity demanded (the price of
ice cream rose by 10% and the quantity demanded fell by 20%), the price elasticity of
demand is sometimes reported as a negative number. We will ignore the minus sign and
concentrate on the absolute value of the elasticity.
D. The Midpoint Method: A Better Way to Calculate Percentage Changes and Elasticities
1. Because we use percentage changes in calculating the price elasticity of demand, the
elasticity calculated by going from one point to another on a demand curve will be different
from an elasticity calculated by going from the second point to the first. This difference arises
because the percentage changes are calculated using a different base.
a. A way around this problem is to use the midpoint method.
c. Example: the price rises from $4 to $6 and quantity demanded falls from 120 to 80.
% change in price = (6 − 4)/5 × 100 = 40%
% change in quantity demanded = (120 − 80)/100 x 100 = 40%
price elasticity of demand = 40/40 = 1
Work through a few elasticity calculations, starting with the example in the book. For
principles of economics courses where there is no mathematical prerequisite, this
may be difficult for some students. Working through a few simple examples will help
to alleviate some of the students’ anxiety. Show every step of the algebra involved.
Chapter 5/Elasticity and Its Application ❖ 83
E. The Variety of Demand Curves
1. Classification of Elasticity
a. When the price elasticity of demand is greater than one, demand is defined to be elastic.
b. When the price elasticity of demand is less than one, the demand is defined to be
inelastic.
c. When the price elasticity of demand is equal to one, the demand is said to have unit
elasticity.
To clearly show the differences between relatively elastic and relatively inelastic
demand curves, draw a graph showing a relatively flat demand curve and one
showing a relatively steep demand curve. Show that any given change in price will
result in a larger change in quantity demanded if the demand curve is relatively flat.
Use the same method when discussing the shape of the supply curve later in the
chapter.
Activity 1—How the Ball Bounces
Type: In-class demonstration
Topics: Elastic, inelastic
Materials needed: One rubber ball and one “dead” ball. The “dead” ball is made of
shock-absorbing material and doesn’t bounce. Museum stores and
magic shops carry them.
Time: 1 minute
Class limitations: Works in any size class
Purpose
This quick, but memorable, demonstration can be used to introduce the concepts of elastic
and inelastic.
Instructions
Bring two students to the front of the class. Give each of them a ball and ask them to bounce
Figure 1
84 ❖ Chapter 5/Elasticity and Its Application
2. In general, the flatter the demand curve that passes through a given point, the more elastic
the demand.
3. Extreme Cases
4.
FYI: A Few Elasticities from the Real World
Make sure that you provide several examples of goods with these types of demand
curves. You may want to point out that students will see the perfectly elastic demand
curve again when competitive firms are discussed.
Chapter 5/Elasticity and Its Application ❖ 85
F. Total Revenue and the Price Elasticity of Demand
1. Definition of total revenue: the amount paid by buyers and received by sellers of a
good, computed as the price of the good times the quantity sold.
Activity 2—Ranking Elasticities
Type: In-class assignment
Topics: The determinants of price elasticity of demand
Materials needed: None
Time: 20 minutes
Class limitations: Works in any size class
Purpose
The intent of this exercise is to get students to think about varying degrees of elasticity and
the factors that determine demand elasticity.
Instructions
Give the students the following list of goods. Ask them to rank them from most to least
elastic.
1. beef
If they have difficulty, these hints can be helpful:
1. How narrowly defined is the market?
2. What substitutes are available for the good?
3. Do consumers think of this good as a necessity or a luxury?
Common Answers and Points for Discussion
A typical ranking:
1. European vacation (luxury, many other vacation destinations)
Figure 2
Another term for price times quantity is “total expenditure.” This term is sometimes
used in questions found in the study guide and test bank. It is also important to
point this out when discussing the market for illegal drugs at the end of the chapter.
86 ❖ Chapter 5/Elasticity and Its Application
2. If demand is inelastic, the percentage change in price will be greater than the percentage
change in quantity demanded.
a. If price rises, quantity demanded falls, and total revenue will rise (because the increase
in price will be larger than the decrease in quantity demanded).
b. If price falls, quantity demanded rises, and total revenue will fall (because the fall in price
will be larger than the increase in quantity demanded).
3. If demand is elastic, the percentage change in quantity demanded will be greater than the
percentage change in price.
4. If demand is unit elastic, the percentage change in price will be equal to the percentage
change in quantity demanded.
a. If price rises, quantity demanded falls, and total revenue will remain the same (because
G. Elasticity and Total Revenue along a Linear Demand Curve
Students find the relationship between changes in total revenue and elasticity difficult
to understand. It may take several thorough discussions of this material before
students will be able to master it.
Figure 3
Point out the usefulness of elasticity from a business owner’s point of view. Students
should be able to see why a firm’s manager would want to know the elasticity of
demand for the firm’s products.
Chapter 5/Elasticity and Its Application ❖ 87
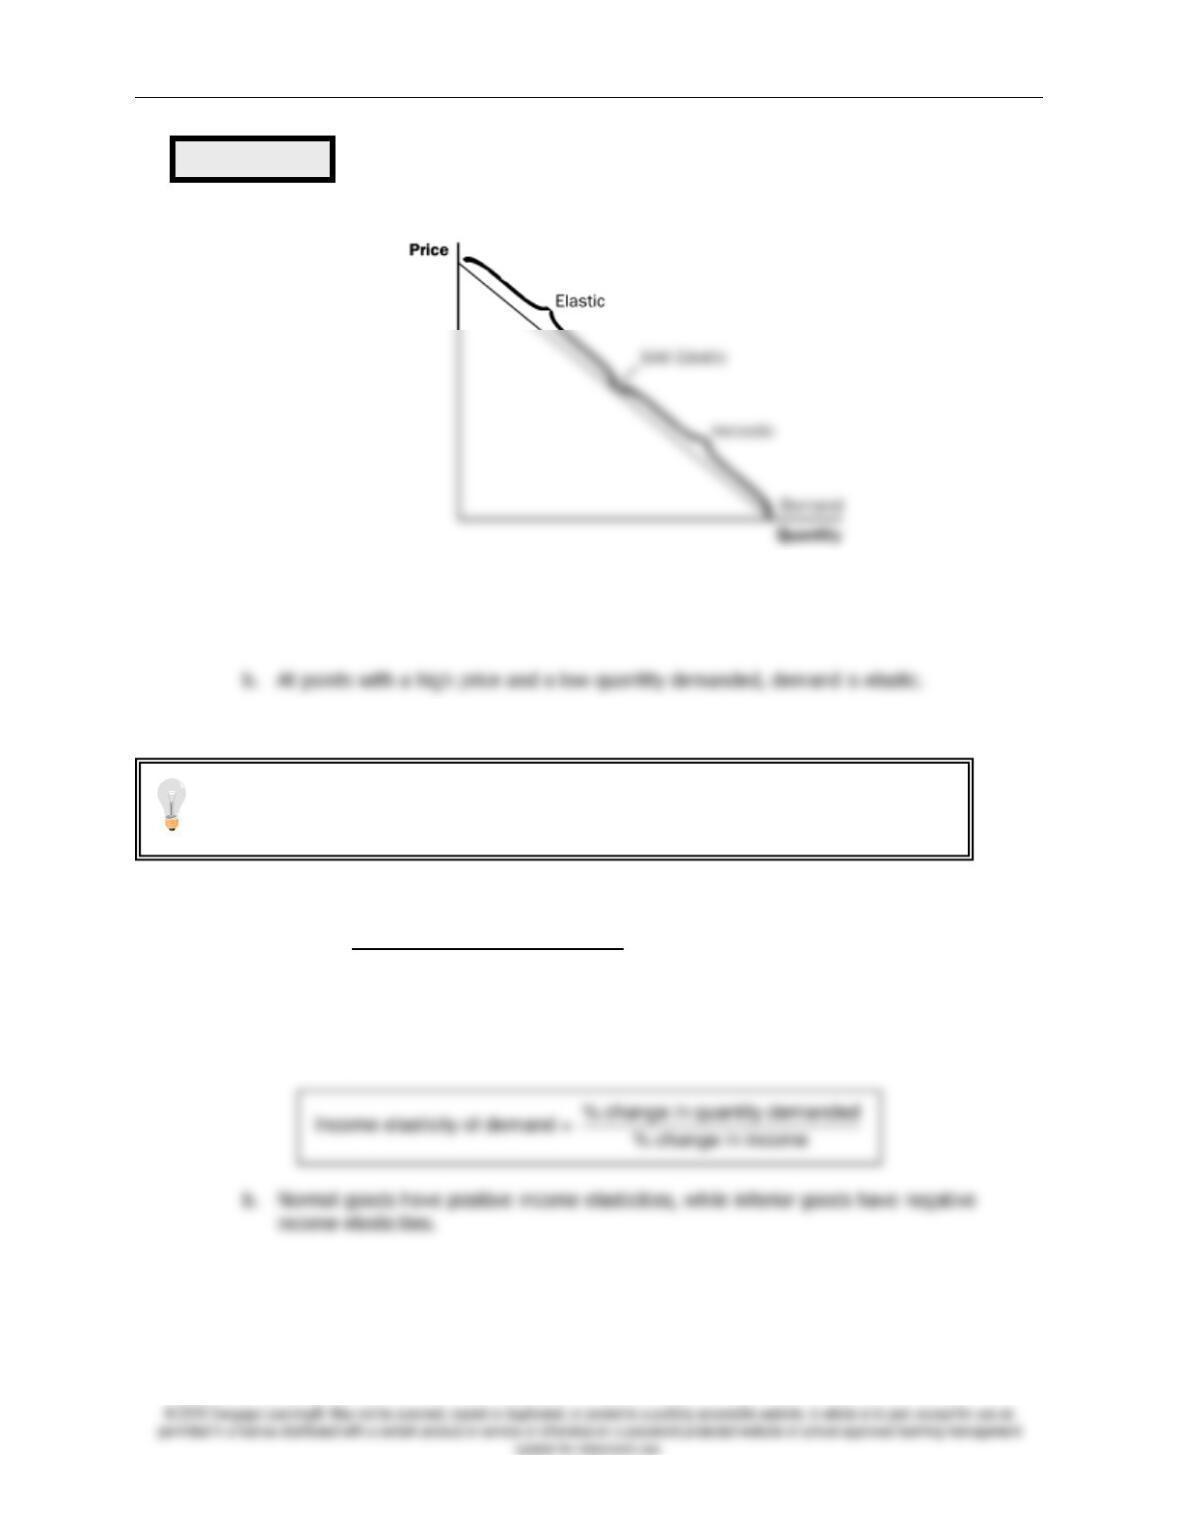
1. The slope of a linear demand curve is constant, but the elasticity is not.
a. At points with a low price and a high quantity demanded, demand is inelastic.
2. Total revenue also varies at each point along the demand curve.
H. Other Demand Elasticities
1. Definition of income elasticity of demand: a measure of how much the quantity
demanded of a good responds to a change in consumers’ income, computed as the
percentage change in quantity demanded divided by the percentage change in
income.
a. Formula
Figure 4
Note that when demand is elastic and price falls, total revenue rises. Also point out
that once demand is inelastic, any further decrease in price results in a decrease in
total revenue.
88 ❖ Chapter 5/Elasticity and Its Application
c. Necessities tend to have small income elasticities, while luxuries tend to have large
income elasticities.
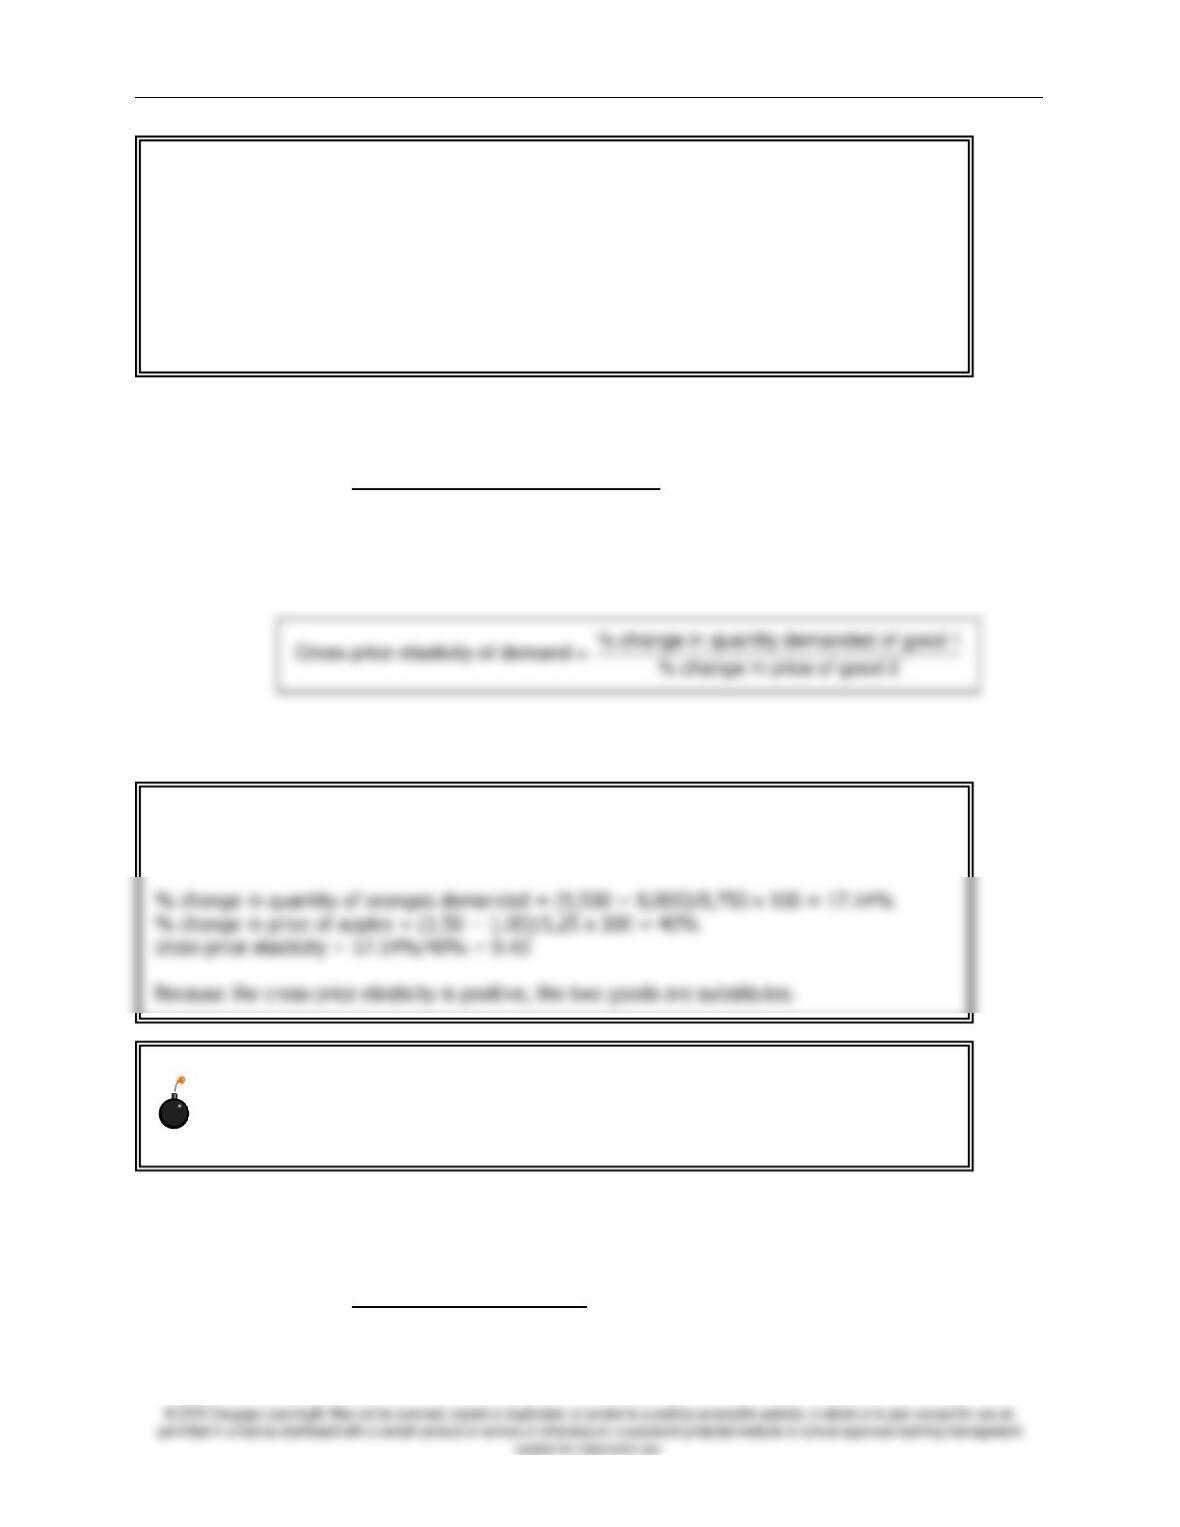
2. Definition of cross-price elasticity of demand: a measure of how much the quantity
demanded of one good responds to a change in the price of another good,
computed as the percentage change in the quantity demanded of the first good
divided by the percentage change in the price of the second good.
a. Formula
b. Substitutes have positive cross-price elasticities, while complements have negative cross-
price elasticities.
II. The Elasticity of Supply
A. The Price Elasticity of Supply and Its Determinants
1. Definition of price elasticity of supply: a measure of how much the quantity
supplied of a good responds to a change in the price of that good, computed as
the percentage change in quantity supplied divided by the percentage change in
price.
ALTERNATIVE CLASSROOM EXAMPLE:
John’s income rises from $20,000 to $22,000 and the quantity of hamburger he buys each
week falls from 2 pounds to 1 pound.
% change in quantity demanded = (1−2)/1.5 x 100 = -66.67%
% change in income = (22,000 −20,000)/21,000 x 100 = 9.52%
income elasticity = 66.67%/9.52% = -7.00
Point out that hamburger is an inferior good for John.
% change in price of apples = (1.50 − 1.00)/1.25 x 100 = 40%
cross-price elasticity = 17.14%/40% = 0.43
ALTERNATIVE CLASSROOM EXAMPLE:
The price of apples rises from $1.00 per pound to $1.50 per pound. As a result, the quantity
of oranges demanded rises from 8,000 per week to 9,500.
Make sure that you explain to students why the signs of the income elasticity and the
cross-price elasticity matter. This will undoubtedly lead to some confusion because
we ignore the sign of the own-price elasticity of demand. You may want to put
together a table to present this distinction to students.
Chapter 5/Elasticity and Its Application ❖ 89
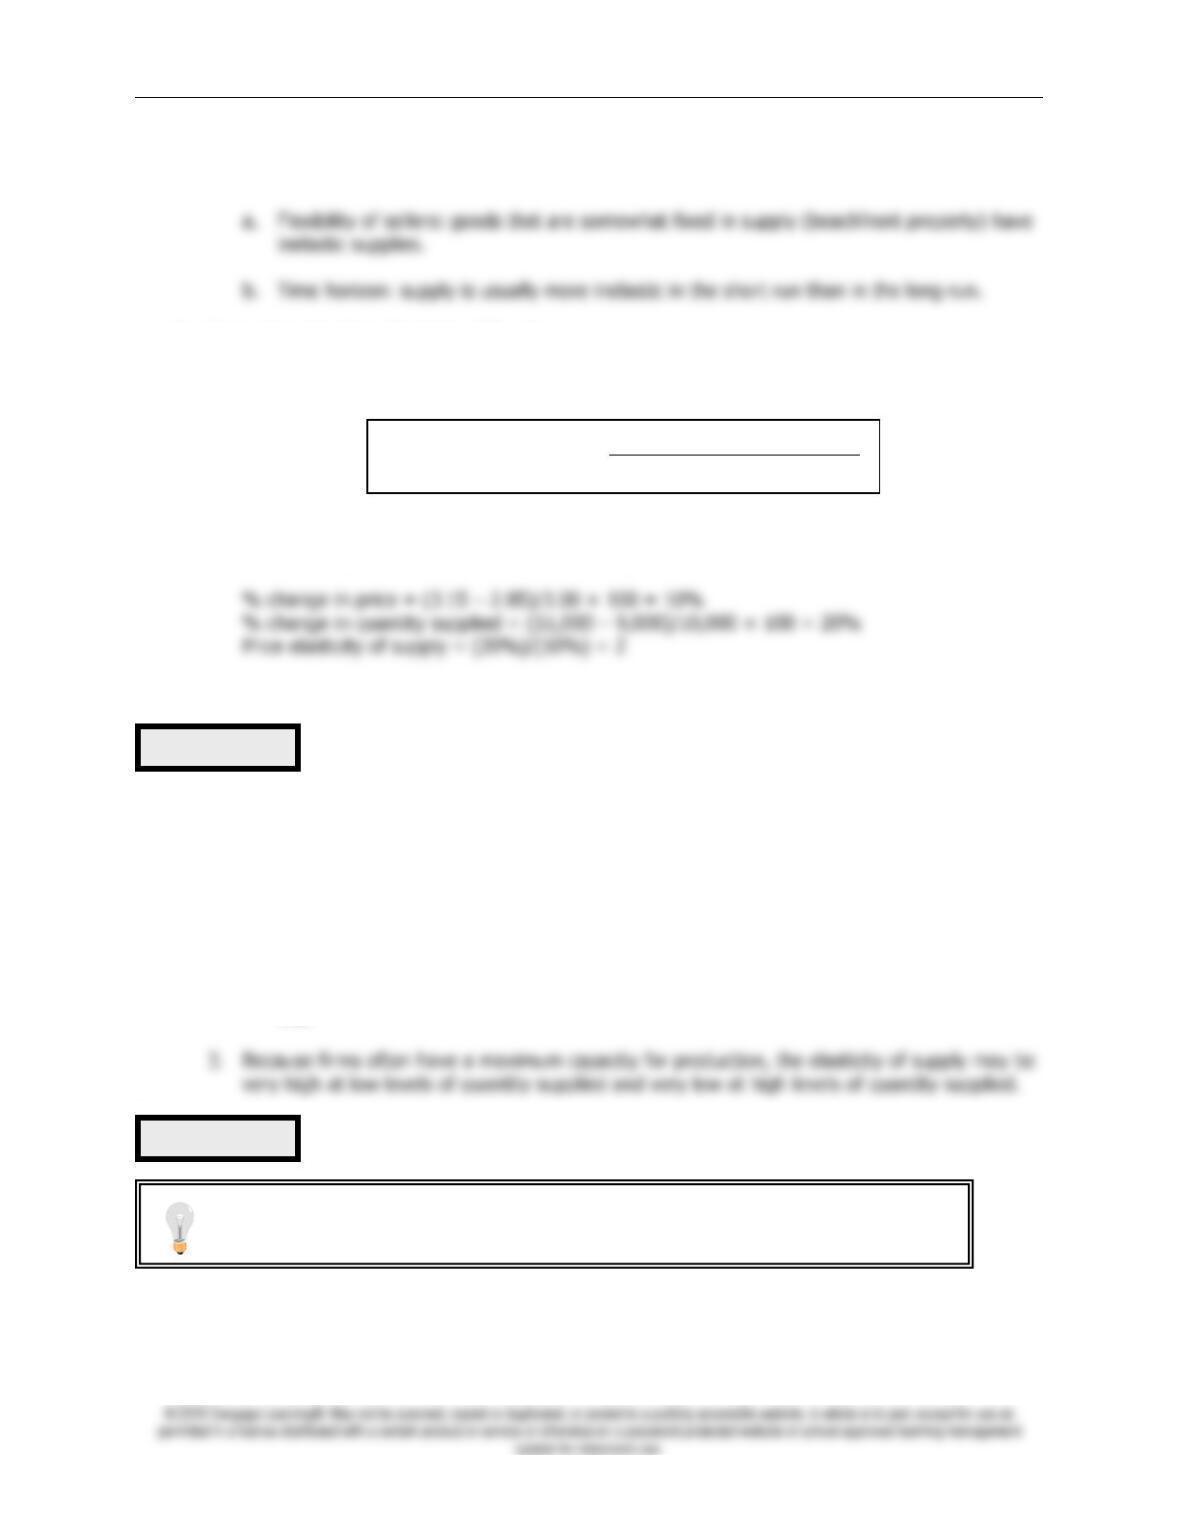
2. Determinants of the Price Elasticity of Supply
B. Computing the Price Elasticity of Supply
1. Formula
2. Example: the price of milk increases from $2.85 per gallon to $3.15 per gallon and the
quantity supplied rises from 9,000 to 11,000 gallons per month.
C. The Variety of Supply Curves
1. In general, the flatter the supply curve that passes through a given point, the more elastic
the supply.
2. Extreme Cases
a. When the elasticity is equal to zero, the supply is said to be perfectly inelastic and is a
vertical line.
b. When the elasticity is infinite, the supply is said to be perfectly elastic and is a horizontal
line.
III. Three Applications of Supply, Demand, and Elasticity
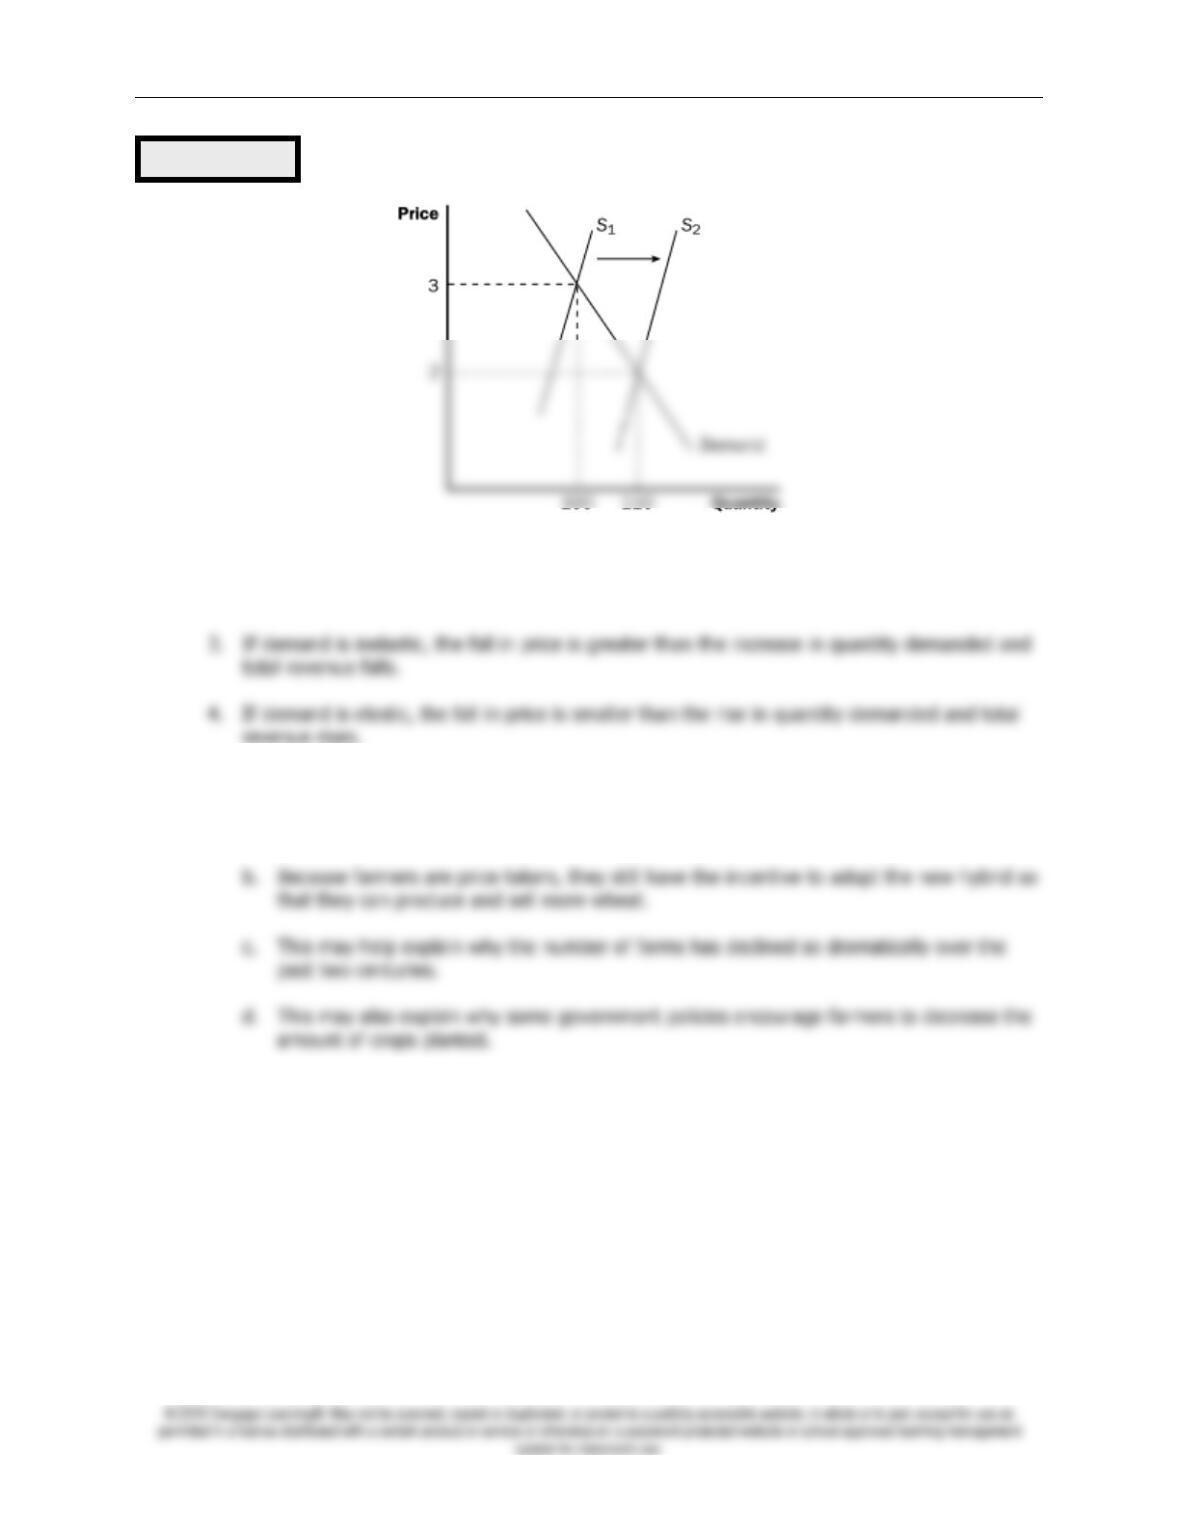
A. Can Good News for Farming Be Bad News for Farmers?
% change in quantity supplied
Price elasticity of supply = % change in price
Figure 5
Figure 6
Again, you may want to present several examples of goods that may have supply
curves like these.
90 ❖ Chapter 5/Elasticity and Its Application
1. A new hybrid of wheat is developed that is more productive than those used in the past.
What happens?
2. Supply increases, price falls, and quantity demanded rises.
revenue rises.
5. In practice, the demand for basic foodstuffs (like wheat) is usually inelastic.
a. This means less revenue for farmers.
B. Why Did OPEC Fail to Keep the Price of Oil High?
Figure 7
Chapter 5/Elasticity and Its Application ❖ 91
1. In the 1970s and 1980s, OPEC reduced the amount of oil it was willing to supply to world
markets. The decrease in supply led to an increase in the price of oil and a decrease in
quantity demanded. The increase in price was much larger in the short run than the long run.
Why?
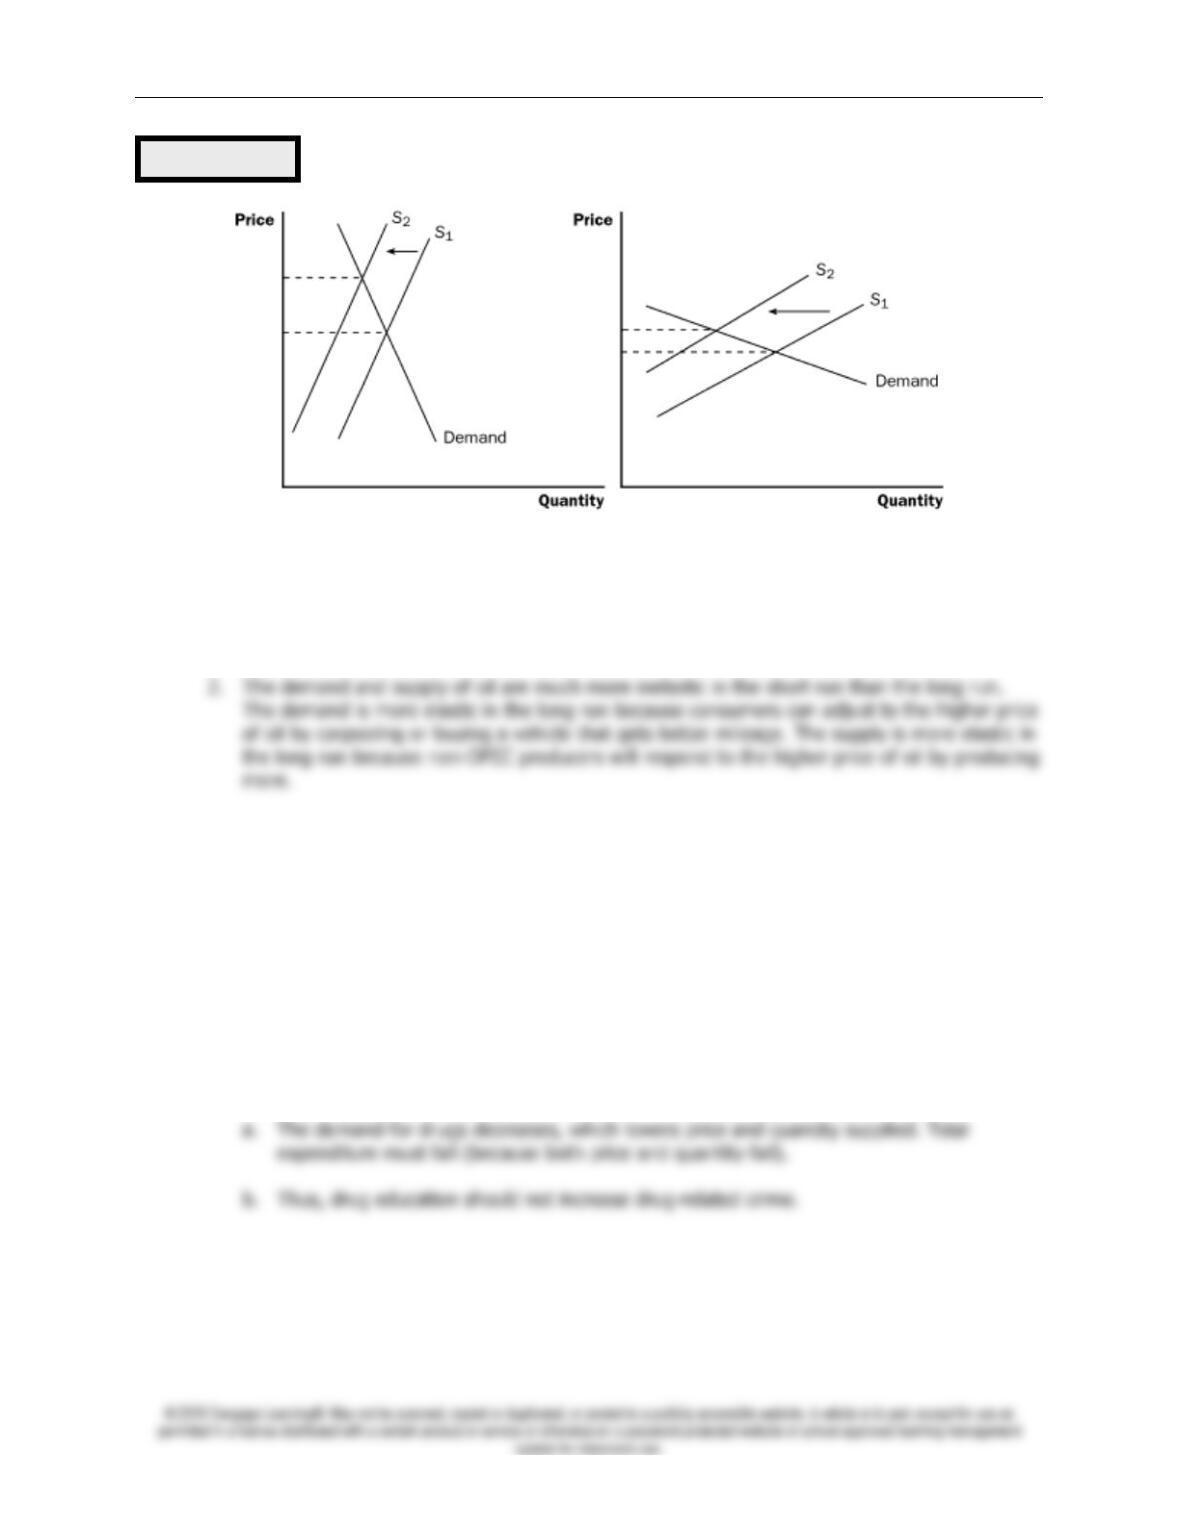
C. Does Drug Interdiction Increase or Decrease Drug-Related Crime?
1. The federal government increases the number of federal agents devoted to the war on
drugs. What happens?
a. The supply of drugs decreases, which raises the price and leads to a reduction in
quantity demanded. If demand is inelastic, total expenditure on drugs (equal to total
revenue) will increase. If demand is elastic, total expenditure will fall.
b. Thus, because the demand for drugs is likely to be inelastic, drug-related crime may rise.
2. What happens if the government instead pursued a policy of drug education?
Figure 8
Short Run
Long Run
92 ❖ Chapter 5/Elasticity and Its Application
SOLUTIONS TO TEXT PROBLEMS:
Quick Quizzes
1. The price elasticity of demand is a measure of how much the quantity demanded of a good
responds to a change in the price of that good, computed as the percentage change in
3. A drought that destroys half of all farm crops could be good for farmers (at least those
unaffected by the drought) if the demand for the crops is inelastic. The shift to the left of
the supply curve leads to a price increase that will raise total revenue if the price elasticity of
Figure 9
(a) Drug Interdiction
(b) Drug Education
Chapter 5/Elasticity and Its Application ❖ 93
Chapter Quick Quiz
1. a
Questions for Review
1. The price elasticity of demand measures how much quantity demanded responds to a change
2. The determinants of the price elasticity of demand include the availability of close
3. An elasticity greater than one means that demand is elastic. When the elasticity is greater
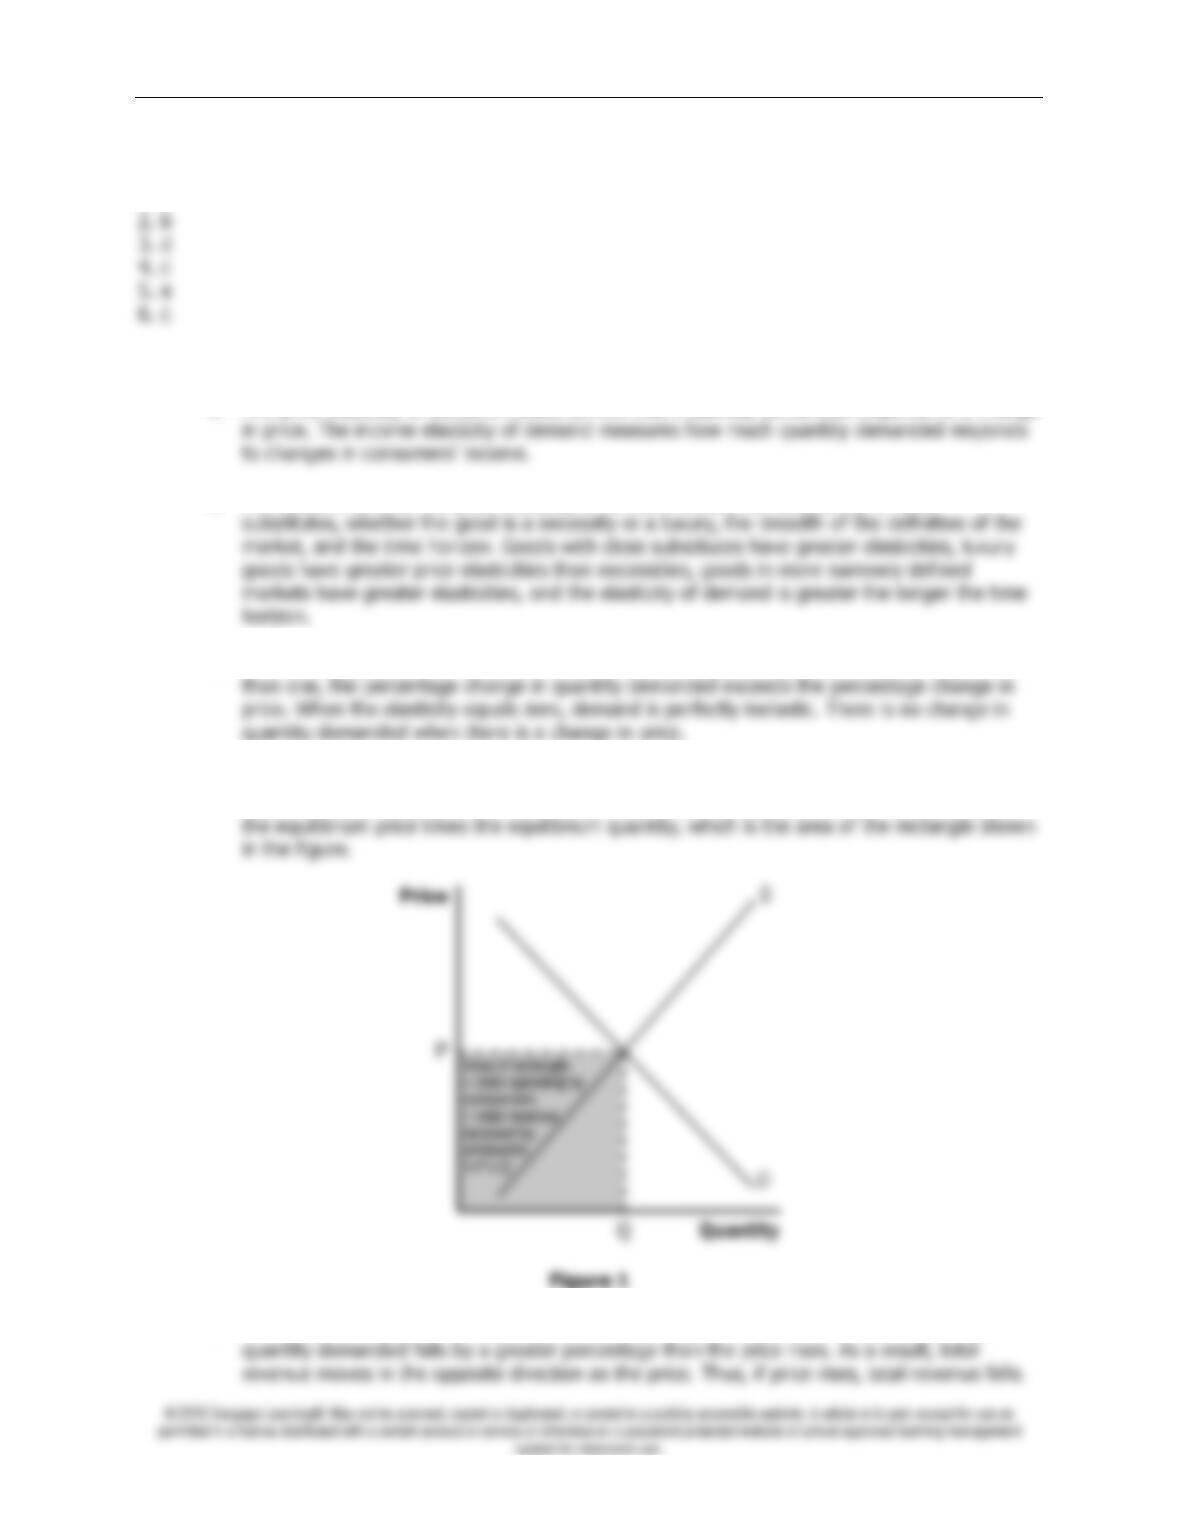
4. Figure 1 presents a supply-and-demand diagram, showing the equilibrium price, P, the
equilibrium quantity, Q, and the total revenue received by producers. Total revenue equals
5. If demand is elastic, an increase in price reduces total revenue. With elastic demand, the
94 ❖ Chapter 5/Elasticity and Its Application
7. The price elasticity of supply is calculated as the percentage change in quantity supplied
8. If a fixed quantity of a good is available and no more can be made, the price elasticity of
9. Destruction of half of the fava bean crop is more likely to hurt fava bean farmers if the
demand for fava beans is very elastic. Destruction of half of the crop causes the supply
Problems and Applications
1. a. Mystery novels have more elastic demand than required textbooks because mystery
novels have close substitutes and are a luxury good, while required textbooks are a
b. Beethoven recordings have more elastic demand than classical music recordings in
general. Beethoven recordings are a narrower market than classical music recordings, so
Quantity
Figure 2
Chapter 5/Elasticity and Its Application ❖ 95
4. If quantity demanded fell, price must have increased according to the law of demand. For a
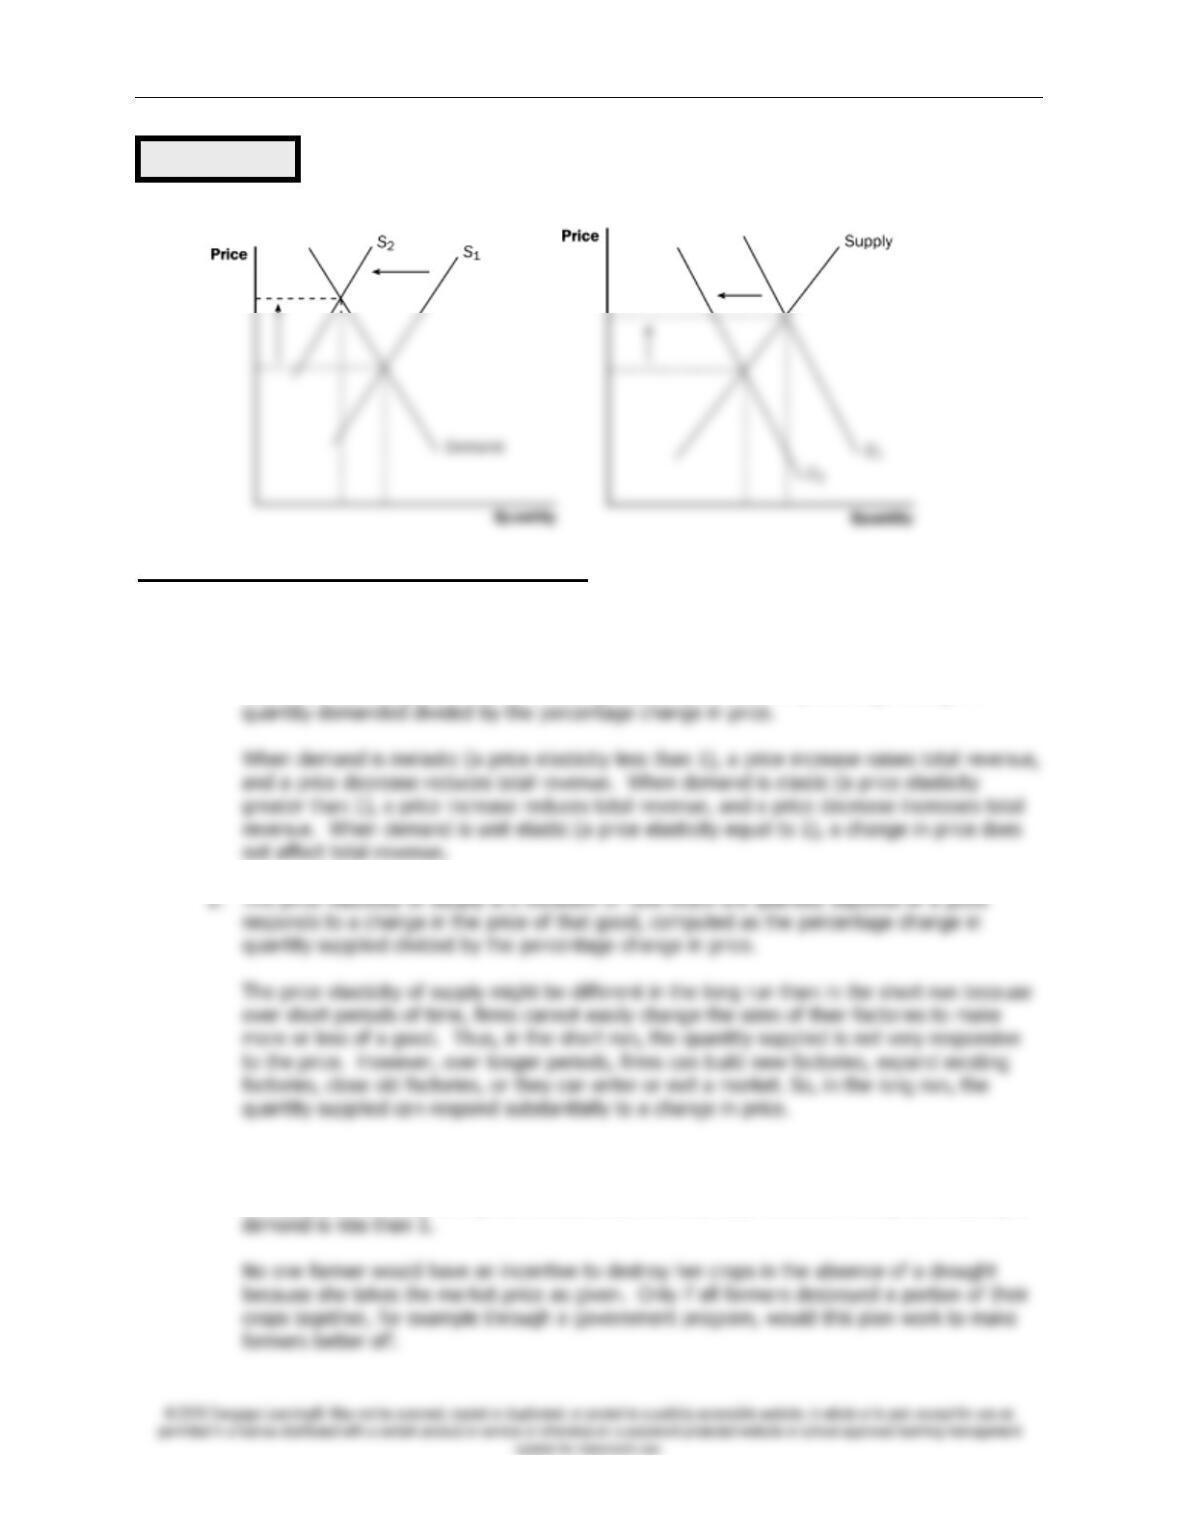
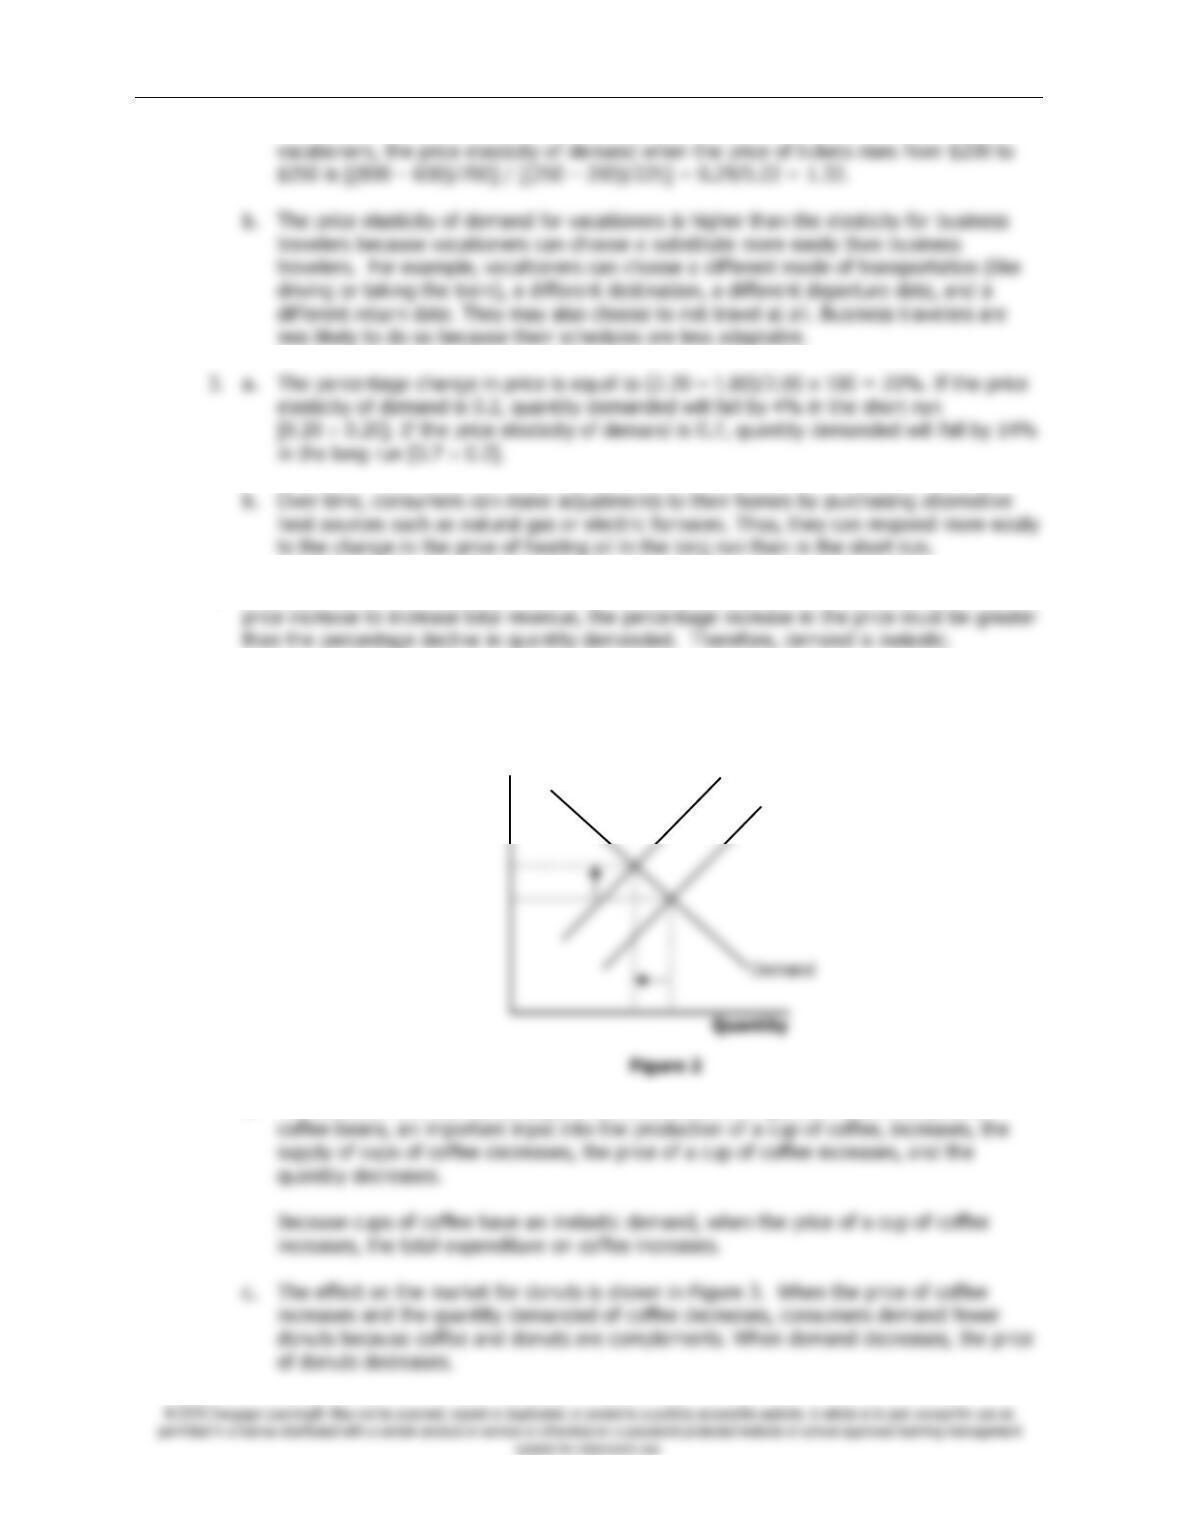
5. a. The effect on the market for coffee beans is shown in Figure 2. When a hurricane
destroys half of the crop, the supply of coffee beans decreases, the price of coffee beans
increases, and the quantity decreases.
b. The effect on the market for cups of coffee is shown in Figure 2. When the price of
Price
S1
S2
D2
D2
D1
Price of
coffee
Price of
coffee
D
Figure 3
96 ❖ Chapter 5/Elasticity and Its Application
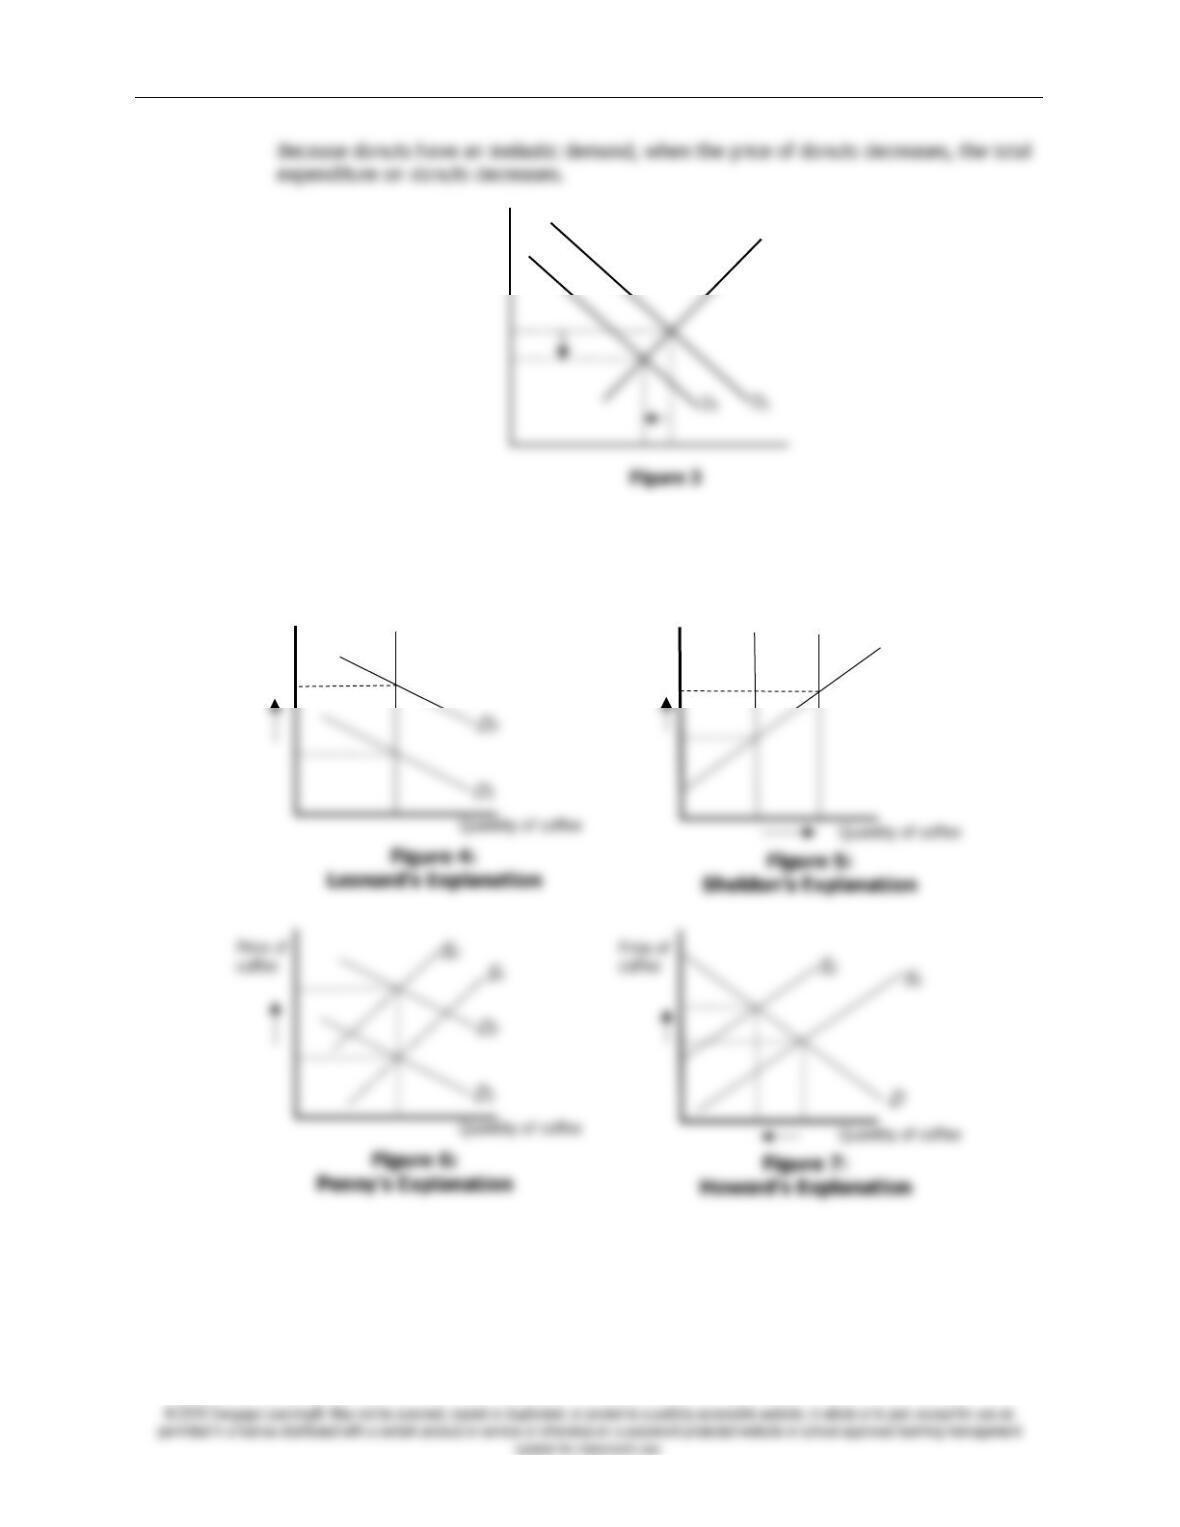
6. If the price of coffee rose sharply while the quantity sold remained the same, the
explanations offered by Leonard, Penny, and Raj could be correct while the explanations
offered by Sheldon and Howard are incorrect. See Figures 4-8 below for illustrations of each
explanation.
Price
Supply
S
Price of
coffee
Price of
coffee
S
D1
D2
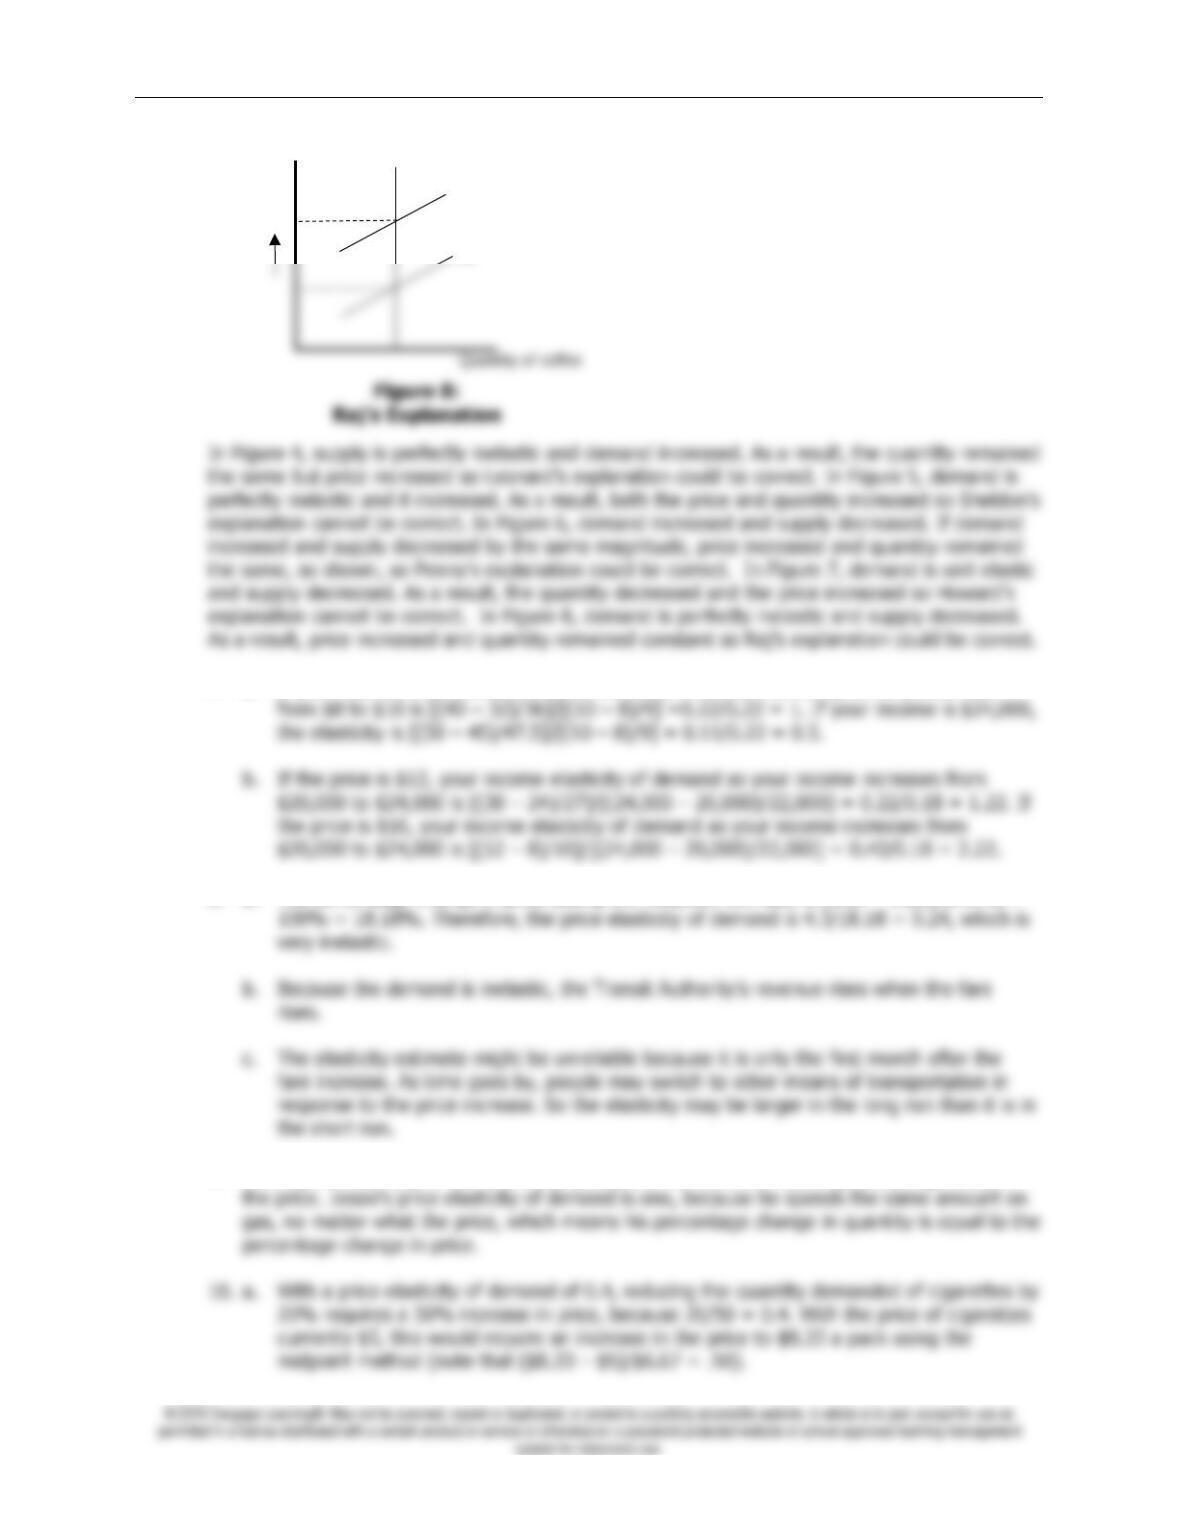
Chapter 5/Elasticity and Its Application ❖ 97
7. a. If your income is $20,000, your price elasticity of demand as the price of pizzas rises
8. a. The percentage change in price (using the midpoint formula) is (1.50 – 1.25)/(1.375) ×
9. Walt’s price elasticity of demand is zero, because he wants the same quantity regardless of
D
S2
S1
Price of
coffee
98 ❖ Chapter 5/Elasticity and Its Application
b. The policy will have a larger effect five years from now than it does one year from now.
c. Because teenagers do not have as much income as adults, they are likely to have a
11. To determine whether you should increase or decrease the price of admissions, you need to
12. A worldwide drought could increase the total revenue of farmers if the price elasticity of
demand for grain is inelastic. The drought reduces the supply of grain, but if demand is