1
2
3
4
5
6
7
8
9
10
11
12
13
14
26
27
28
29
30
31
32
33
34
35
36
37
38
39
40
41
42
43
44
45
46
47
48
49
50
51
52
53
54
56
57
58
The easiest way to solve this problem is to use Excel’s PV function. Click fx, then financial, then PV. Then fill in the
menu items as shown in our snapshot in the screen shown just below.
59
60
61
62
63
64
65
66
67
68
69
70
74
75
76
77
78
data table to show the bond’s value at a range of rates, i.e., to show the bond’s sensitivity to changes in interest
rates. This is done below.
A B C D E F G H I J K L M N O P Q R S T
12/9/2012
Situation
Finding the “Fair Value” of a Bond
First, we list the key features of the bond as “model inputs”:
Years to Mat: 10
Coupon rate: 10%
Annual Pmt: $100
Par value = FV: $1,000
Going rate, rd:10%
Value of bond = $1,000.00
complete the operation and get the table.
Chapter 5. Mini Case
Sam Strother and Shawna Tibbs are vice-presidents of Mutual of Seattle Insurance Company and co-directors of the
company’s pension fund management division. A major new client, the Northwestern Municipal Alliance, has
requested that Mutual of Seattle present an investment seminar to the mayors of the represented cities, and Strother
and Tibbs, who will make the actual presentation, have asked you to help them by answering the following
questions. Because the Boeing Company operates in one of the league’s cities, you are to work Boeing into the
presentation.
a. What are the key features of a bond? Answer: See Chapter 5 Mini Case Show
d. How is the value of a bond determined? What is the value of a 10-year, $1,000 par value bond with a 10 percent
annual coupon if its required rate of return is 10 percent?
Thus, this bond sells at its par value. That situation always exists if the going rate is
equal to the coupon rate.
The PV function can only be used if the payments are constant, but that is normally the case for bonds.
b. What are call provisions and sinking fund provisions? Do these provisions make bonds more or less risky?
e. (1.) What would be the value of the bond described in Part d if, just after it had been issued, the expected inflation
rate rose by 3 percentage points, causing investors to require a 13 percent return? Would we now have a discount
or a premium bond?
We could simply go to the input data section shown above, change the value for r from 10% to 13%. You can set up a
15
16
17
18
19
20
23
24
25
c. How is the value of any asset whose value is based on expected future cash flows determined? Answer: See
A call provision that allows the issuer to redeem the bond at a specified time before the maturity date. If interest
rates fall, the issuer can refund the bonds and issue new bonds at a lower rate. Because of this, borrowers are
willing to pay more and lenders require more on callable bonds.
In a sinking fund provision, the issuer pays off the loan over its life rather than all at the maturity date. A sinking
fund reduces the risk to the investor and shortens the maturity. This is not good for investors if rates fall after
79
80
81
82
83
84
85
86
A B C D E F G H I J K L M N O P Q R S T
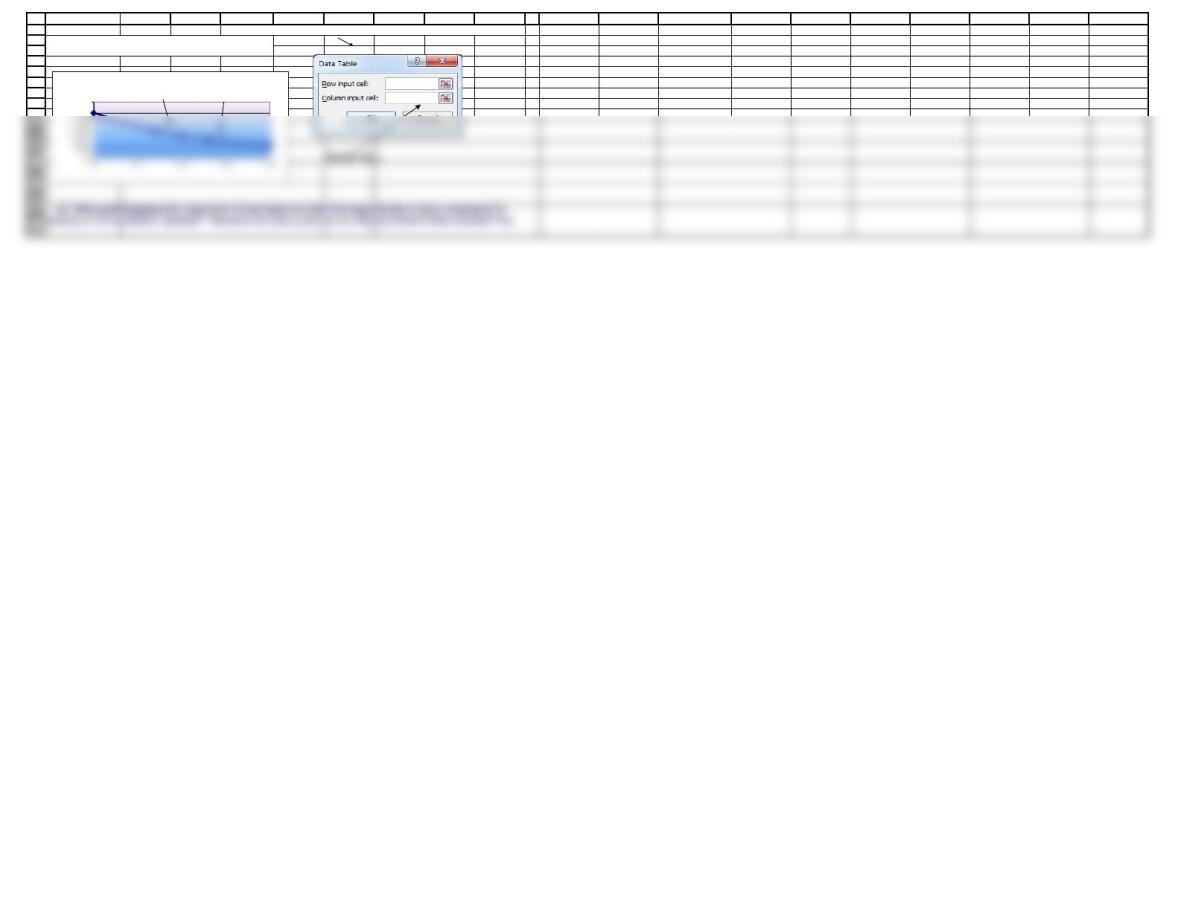
To make the data table, first type the headings, then type the rates in
cells in the left column. Since the input values are listed down a column,
type the formula in the row above the first value and one cell to the right
of the column of values (this is B73; note that the formula in B73 actually
just refers to the bond pricing formula above in B60). Select the range of
cells that contains the formulas and values you want to substitute
(A73:B78). Then click Data, What-If-Analysis, and then Data Table to get
the menu. The input data are in a column, so put the cursor on “column
input cell” and enter the cell with the value for r (B37), then Click OK to
complete the operation and get the table.
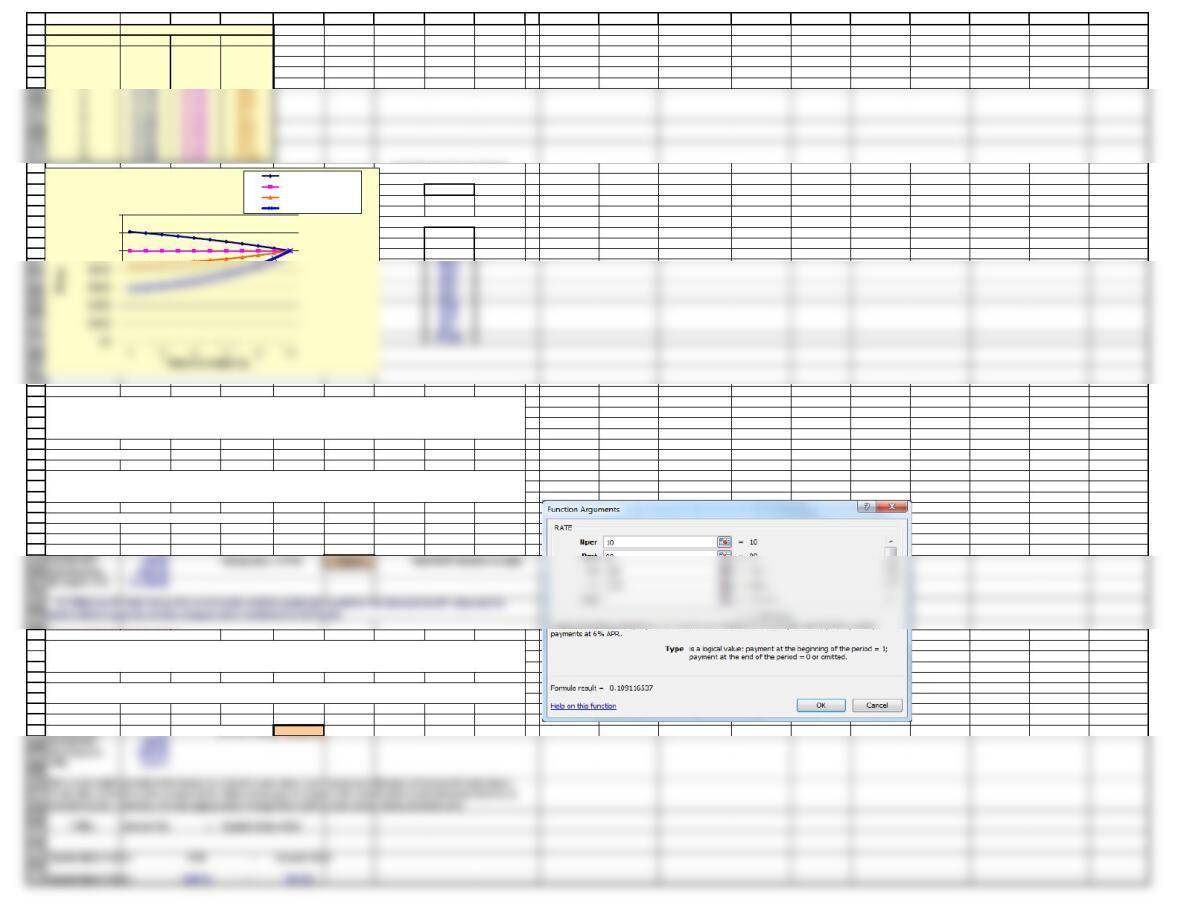
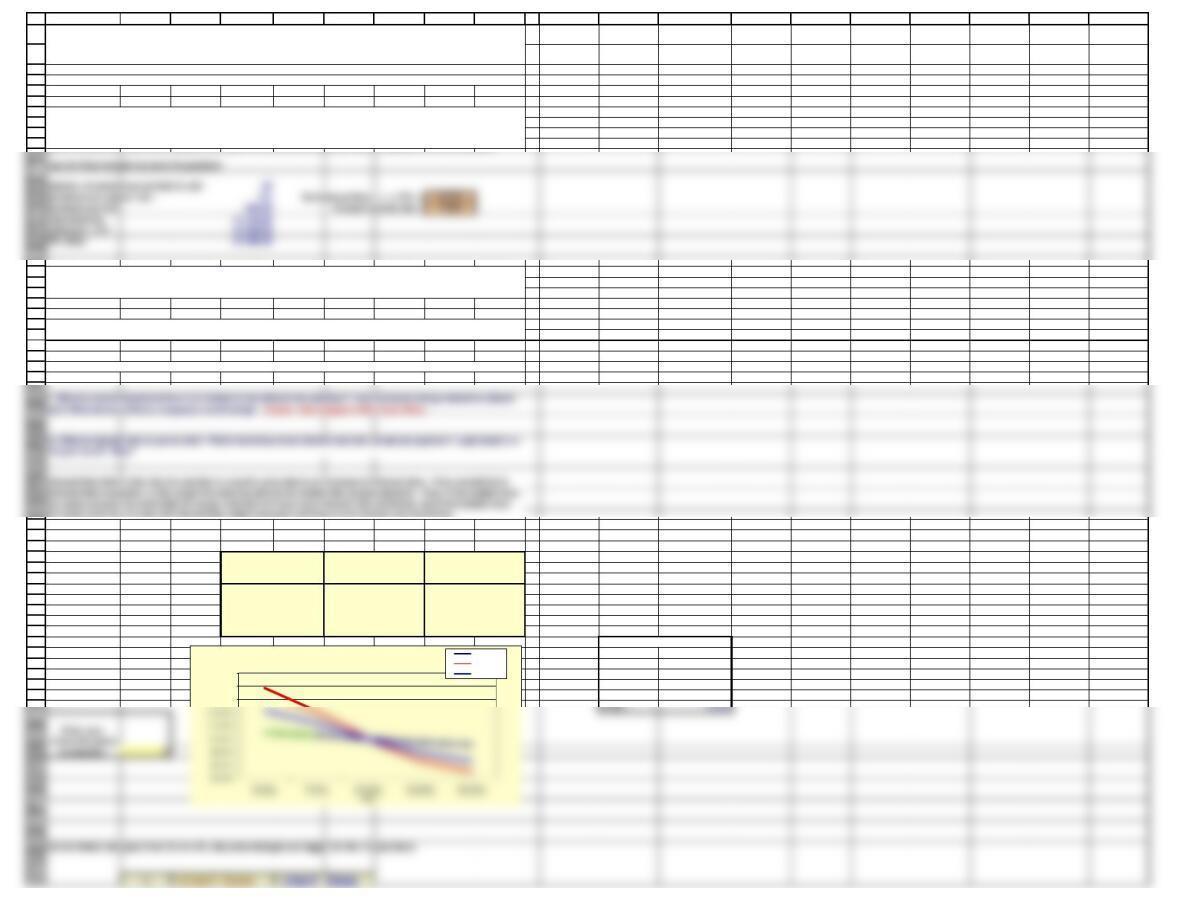
We can use the data table to construct a graph that
shows the bond’s sensitivity to changing rates.
$2,500
Interest Rate Sensitivity of a 10-Year Bond
Value at 7%
Value at 13%
87
88
89
90
91
92
93
94
95
96
97
99
100
101
102
103
104
112
113
114
115
116
117
118
119
120
121
122
123
124
125
126
127
128
129
130
131
132
$640
$667
$701
$741
$789
$847
$917
133
134
135
136
137
138
139
140
141
142
143
144
145
146
147
148
149
150
151
152
153
154
155
Annual Pmt: $90.00 Going rate, r =YTM: 10.91% See RATE function at right.
Current price: $887.00
Par value = FV: $1,000.00
(2.) What are the total return, the current yield, and the capital gains yield for the discount bond? (Assume the
bond is held to maturity and the company does not default on the bond.)
156
157
158
159
160
161
162
163
164
165
166
167
168
169
170
171
172
173
174
175
176
177
178
179
Annual Pmt: $90.00
Current price: $887.00
Current Yield
Capital Gains Yield = YTM – Current Yield
Capital Gains Yield = 10.91% – 10.15%
The current yield provides information on a bond‘s cash return, but it gives no indication of the bond’s total return.
To see this, consider a zero coupon bond. Since zeros pay no coupon, the current yield is zero because there is no
interest income. However, the zero appreciates through time, and its total return clearly exceeds zero.
A B C D E F G H I J K L M N O P Q R S T
N7% 10% 13%
0$1,211 $1,000 $837
1$1,195 $1,000 $846
2$1,179 $1,000 $856
3$1,162 $1,000 $867
You pick the rate for a bond:
Your choice:
20%
Resulting bond prices
$581
$597
$616
Yield to Maturity (YTM)
Use the Rate function to solve the problem.
Years to Mat: 10
Coupon rate: 9%
Current and Capital Gains Yields
Par value $1,000.00
Coupon rate: 9%
Current Yield =
10.15%
f. (1.) What is the yield to maturity on a 10-year, 9 percent annual coupon, $1,000 par value bond that sells for
$887.00? That sells for $1,134.20? What does the fact that a bond sells at a discount or at a premium tell you about
the relationship between rd and the bond’s coupon rate? What is the yield-to-maturity of the bond?
The current yield is the annual interest payment divided by the bond’s current price. The current yield provides
information regarding the amount of cash income that a bond will generate in a given year. However, it does not
account for any capital gains or losses that will be realized if the bond is held to maturity or call.
Simply divide the annual interest payment by the price of the bond. Even if the bond made semiannual payments,
we would still use the annual interest.
If rates fall, the bond goes to a premium, but it moves towards par as maturity approaches. The reverse hold if rates
rise and the bond sells at a discount. If the going rate remains equal to the coupon rate, the bond will continue to
sell at par. Note that the above graph assumes that interest rates stay constant after the initial change. That is most
unlikely–interest rates fluctuate, and so do the prices of outstanding bonds.
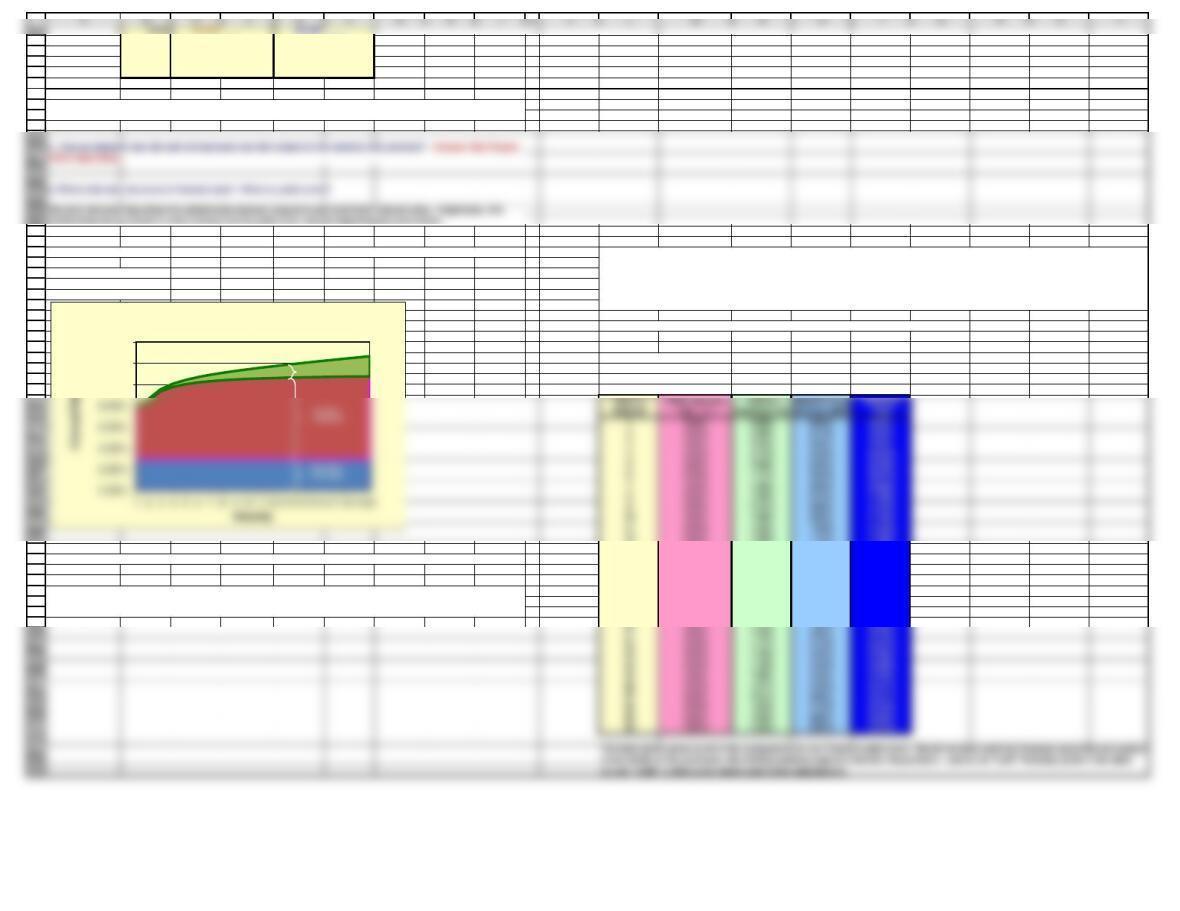
Value of Bond in Given Year:
$1,000
$1,200
$1,400
Value of the bond over time Rates fall to 7%
Rates stay the same
Rates increase to 13%
Your choice
105
106
107
108
109
110
111
4$1,143 $1,000 $880
5$1,123 $1,000 $894
6$1,102 $1,000 $911
7$1,079 $1,000 $929
8$1,054 $1,000 $950
9$1,028 $1,000 $973
180
181
182
183
184
185
186
187
201
202
203
204
205
206
207
208
209
210
211
212
213
214
215
216
217
218
219
220
221
222
223
224
225
226
Value of bond = $83.4737 or $834.74
Settlement (today) 3/25/2014
Maturity 12/31/2023
Coupon rate 10.00%
Going rate, r 13.00%
Redemption (par value) 100
Frequency (for semiannual) 2
the correct price. See the example below.
227
228
229
230
231
232
233
234
235
236
237
238
239
240
241
242
243
244
245
246
247
248
249
250
251
252
253
254
255
256
257
258
259
Accrued interest = $2.3333 or $23.33
Suppose the bond’s price is $1,150. You can also calculate the yield using the YIELD function, as shown below.
Curent price 1,150.00$
Settlement (today) 1/1/2014
Maturity 12/31/2023
Coupon rate 10.00%
Redemption (par value) 100
Frequency (for semiannual) 2
Basis (360 or 365 day year) 0
A B C D E F G H I J K L M N O P Q R S T
Capital Gains Yield = 0.76%
Bonds with Semiannual Coupons
Excel Bond Functions
Suppose today’s date is January 1, 2014, and the bond matures on December 31, 2023
Settlement (today) 1/1/2014
Maturity 12/31/2023
Coupon rate 10.00%
Going rate, r 13.00%
Redemption (par value) 100
Frequency (for semiannual) 2
Basis (360 or 365 day year) 0
Basis (360 or 365 day year) 0
Value of bond = $83.6307 or $836.31
Issue date 1/1/2014
First interest date 6/30/2014
Settlement (today) 3/25/2014
Maturity 12/31/2023
Coupon rate 10.00%
Going rate, r 13.00%
Redemption (par value) 100
Frequency (for semiannual) 2
Basis (360 or 365 day year) 0
This is the value of the bond, but it does not include the accrued interest you would pay. The ACCRINT function will
calculate accrued interest, as shown below.
g. How does the equation for valuing a bond change if semiannual payments are made? Find the value of a 10-year,
semiannual payment, 10 percent coupon bond if nominal rd = 13%.
188
189
190
191
192
193
194
195
196
197
198
199
200
Periods to maturity = 10*2 = 20
Coupon rate: 10%
Semiannual pmt = $100/2 = $50.00 PV = $834.72
Future Value: $1,000.00
Periodic rate = 13%/2 = 6.5%
Note that the bond is now more valuable, because interest payments come in faster.
three modifications to our original valuation model: (1) divide the coupon payment by 2, (2) multiply the years to
maturity by 2, and (3) divide the nominal interest rate by 2.
Use the Rate function with adjusted data to solve the problem.
260
261
262
263
264
265
266
267
268
269
280
281
282
283
284
285
286
287
288
289
290
291
292
293
294
295
296
297
298
299
300
301
302
303
Interest Rate Risk is the risk of a decline in a bond’s price due to an increase in interest rates. Price sensitivity to
interest rates is greater (1) the longer the maturity and (2) the smaller the coupon payment. Thus, if two bonds have
the same coupon, the bond with the longer maturity will have more interest rate sensitivity, and if two bonds have
m. What is interest rate (or price) risk? Which bond has more interest rate risk, an annual payment 1-year bond or a
10-year bond? Why?
l. What is a bond spread and how is it related to the default risk premium? How are bond ratings related to default
304
305
306
307
308
309
310
311
312
313
314
315
316
317
318
319
320
321
322
324
325
326
327
328
329
330
331
332
333
334
335
336
337
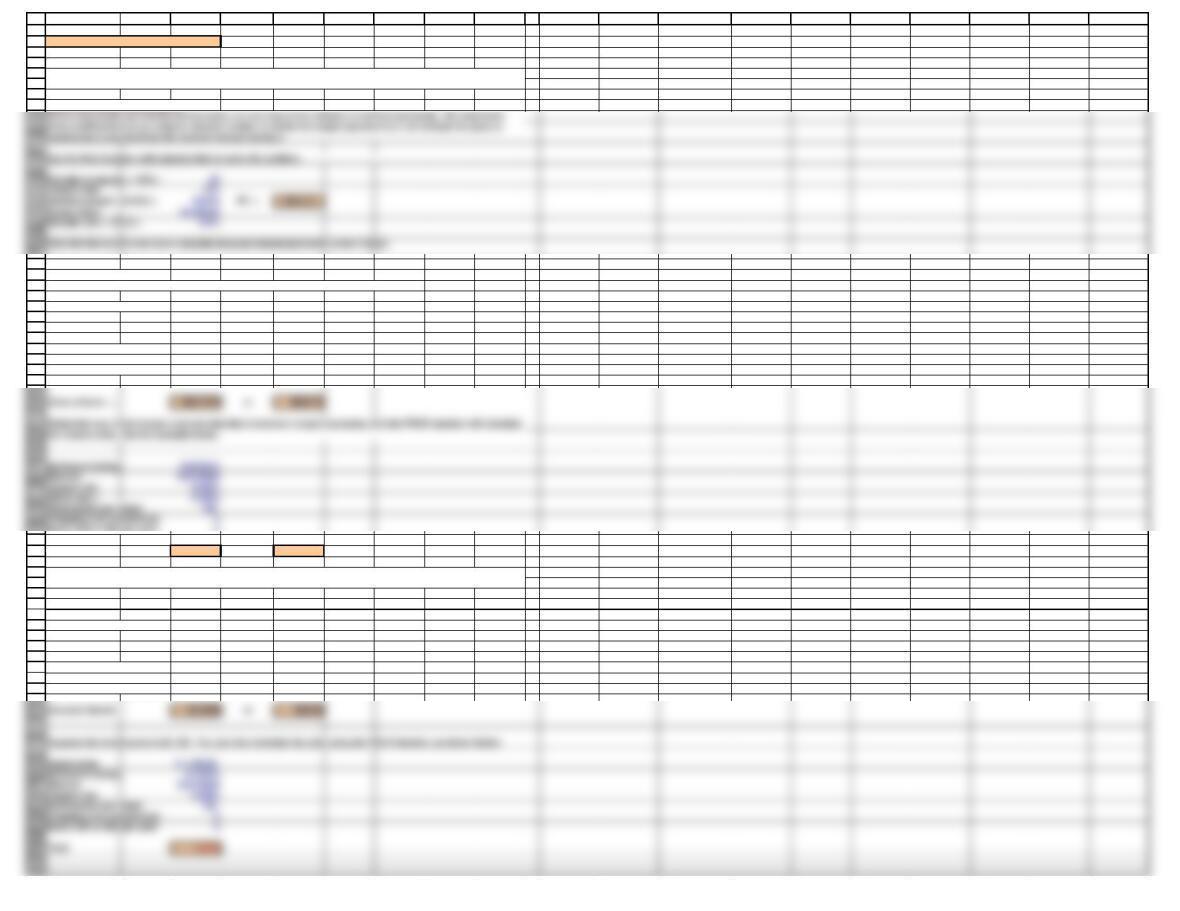
As the interst rate goes from 5% to 15%, the price changes are bigger for the 10-year bond.
A B C D E F G H I J K L M N O P Q R S T
Yield to Call
Your Choice of Maturity
Years to Mat: 10 Rate Price Rate Price Rate Price
Coupon rate: 10% $966.65 $946.77 $991.88
Annual Pmt: $100.00 5.0% 1,216.47 5.0% $1,386.09 5.0% $1,047.62
Current price: $946.77 7.0% 1,123.01 7.0% $1,210.71 7.0% $1,028.04
Par value = FV: $1,000.00 10.0% 1,000.00 10.0% $1,000.00 10.0% $1,000.00
YTM = 10.9% 13.0% 894.48 13.0% $837.21 13.0% $973.45
15.0% 832.39 15.0% $749.06 15.0% $956.52
Years to Mat: 1Scratch sheet for Your Choice
Coupon rate: 10% Years to Mat: 5
Annual Pmt: $100.00 Coupon rate: 10%
Current price: $991.88 Annual Pmt: $100.00
Par value = FV: $1,000.00
Current price:
$966.65
YTM = 10.9%
Par value = FV:
$1,000.00
the same maturity, the one with the smaller coupon payment will have more interest rate sensitivity.
h. Suppose a 10-year, 10 percent, semiannual coupon bond with a par value of $1,000 is currently selling for
$1,135.90, producing a nominal yield to maturity of 8 percent. However, the bond can be called after 5 years for a
price of $1,050.
(1.) What is the bond‘s nominal yield to call (YTC)?
(2.) If you bought this bond, do you think you would be more likely to earn the YTM or the YTC? Why?
k. Describe a way to estimate the inflation premium (IP) for a T-Year bond. Answer: See Chapter 5 Mini Case Show.
1-Yr Maturity
10-Yr Maturity
The yield to call is the rate of return investors will receive if their bonds are called. If the issuer has the right to call
the bonds, and if interest rates fall, then it would be logical for the issuer to call the bonds and replace them with
new bonds that carry a lower coupon. The yield to call (YTC) is found similarly to the YTM. The same formula is
used, but years to maturity is replaced with years to call, and the maturity value is replaced with the call price.
i. Write a general expression for the yield on any debt security (rd) and define these terms: real risk-free rate of
interest (r*), inflation premium (IP), default risk premium (DRP), liquidity premium (LP), and maturity risk premium
(MRP). Answer: See Chapter 5 Mini Case Show.
j. Define the nominal risk-free rate (rRF). What security can be used as an estimate of rRF? Answer: See Chapter 5
Mini Case Show.
$1,300.00
$1,400.00
$1,500.00
10 Yr. versus 1 Yr.
Your Choice
270
271
272
273
274
275
276
277
278
279
Use the Rate function to solve the problem.
Number of semiannual periods to call: 10
Seminannual coupon rate: 5% Semiannual Rate = I = YTC = 3.77%
Seminannual Pmt: $50.00 Annual nominal rate = 7.53%
Current price: $1,135.90
Call price = FV $1,050.00
Par value $1,000.00
340
341
342
343
344
345
346
347
348
349
350
351
352
353
354
355
356
357
o. How are interest rate risk and reinvestment rate risk related to the maturity risk premium? Answer: See Chapter
5 Mini Case Show.
358
359
360
361
362
363
364
365
366
367
368
369
370
371
372
373
374
375
376
378
379
380
381
382
383
384
385
386
10 3.00% 7.50% 0.90% 11.40%
11 3.00% 7.55% 1.00% 11.55%
387
388
389
390
391
392
393
394
395
396
397
398
399
400
401
402
403
404
405
406
407
408
409
21 3.00% 7.76% 2.00% 12.76%
22 3.00% 7.77% 2.10% 12.87%
23 3.00% 7.78% 2.20% 12.98%
24 3.00% 7.79% 2.30% 13.09%
25 3.00% 7.80% 2.40% 13.20%
26 3.00% 7.81% 2.50% 13.31%
27 3.00% 7.81% 2.60% 13.41%
28 3.00% 7.82% 2.70% 13.52%
29 3.00% 7.83% 2.80% 13.63%
we can “build” a yield curve based upon these expectations.
4.8% 38.6%
10.0% $1,000 $1,000
4.5% 33.5%
15.0% $957 $749
Hypothetical Inputs See to right for actual date used in graph.
Real risk free rate 3.00%
Expected inflation of 5% for the next 1 years.
Expected inflation of 6% for the next 1 years.
Expected inflation of 8% thereafter.
Now, we want to set up a table that encompasses all of the information for our yield curve.
INPUT DATA
Real risk free rate 3.00%
Expected inflation of 5% for the next 1 years.
Expected inflation of 6% for the next 1 years.
Expected inflation of 8% thereafter.
12 3.00% 7.58% 1.10% 11.68%
13 3.00% 7.62% 1.20% 11.82%
The yield is upward sloping due to increasing expected inflation and an increasing maturity risk premium 14 3.00% 7.64% 1.30% 11.94%
15 3.00% 7.67% 1.40% 12.07%
16 3.00% 7.69% 1.50% 12.19%
17 3.00% 7.71% 1.60% 12.31%
18 3.00% 7.72% 1.70% 12.42%
19 3.00% 7.74% 1.80% 12.54%
20 3.00% 7.75% 1.90% 12.65%
Suppose most investors expect the inflation rate to be 5 percent next year, 6 percent the following year, and 8 percent thereafter. The
real risk-free rate is 3 percent. The maturity risk premium is zero for securities that mature in 1 year or less, 0.1 percent for 2-year
securities, and then the MRP increases by 0.1 percent per year thereafter for 20 years, after which it is stable. What is the interest
rate on 1-year, 10-year, and 20-year Treasury securities? Draw a yield curve with these data. What factors can explain why this
constructed yield curve is upward sloping?
n. What is reinvestment rate risk? Which has more reinvestment rate risk, a 1-year bond or a 10-year bond?
Answer: See Chapter 5 Mini Case Show.
q. Briefly describe bankruptcy law. If a firm were to default on the bonds, would the company be immediately
liquidated? Would the bondholders be assured of receiving all of their promised payments? Answer: See Chapter 5
Mini Case Show.
10.00%
12.00%
14.00%
Hypothetical Treasury Yield Curve
MRP
339