105
CASE STUDY EXTENSION
5-5 Using Interest Rates to Forecast Inflation
Eugene Fama investigated the Fisher effect in a famous article published in 1975.1 He considered U.S.
Treasury bills and noted that the nominal interest rate is the sum of the expected real return and the
expected inflation rate. Now, suppose that the equilibrium expected real return on one–month bills is
constant. Then, the nominal interest rate determined in the market for bills contains a market prediction
about the expected inflation rate. If the market is efficient, then this prediction should make use of all
information available to market participants about future inflation.22 Under the two assumptions of
constant expected real returns and market efficiency, movements in the nominal interest rate should reflect
changes in expected inflation one for one. The nominal interest rate is then the best predictor of future
LECTURE SUPPLEMENT
5-6 Transactions Models of Money Demand
Transactions models of money demand focus on money’s role as a medium of exchange. The basic idea of
the transactions demand for money was developed independently by James Tobin and William Baumol in
The Baumol–Tobin Model of Cash Management
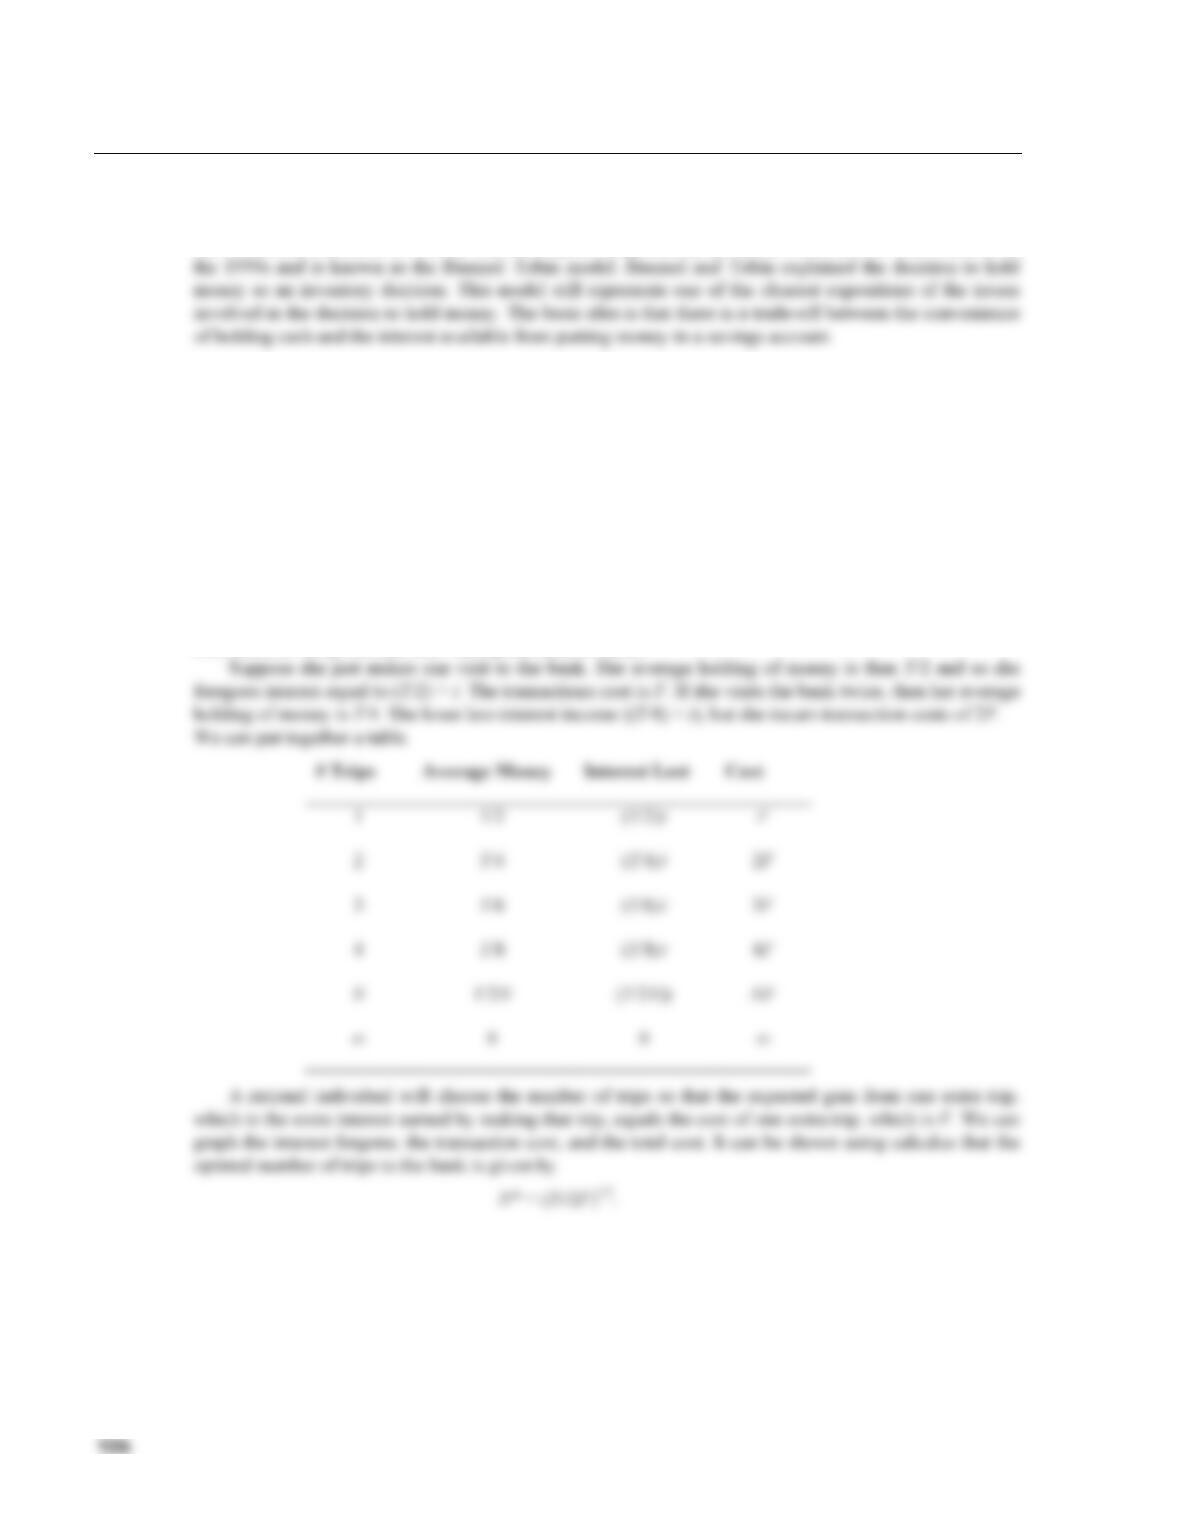
Consider an individual who plans to consume her income of Y dollars at a steady rate over the course of a
year. Suppose that, at the start of the year, she has Y dollars in her savings account. It is costly for her to go
to the bank because it takes time or effort. Suppose that the cost of a banking transaction is F and that the
interest rate is i.
She could decide to go to the bank at the start of the year, take out the entire Y dollars in the form of
cash, and spend it as she needed it. In this case she would earn no interest income but would minimize the
costs associated with her trips to the bank. At the other extreme, she could visit the bank every time she
needed to make a purchase, withdrawing exactly what she needed each time. In this case, she would earn
as much interest income as possible but would spend most of the year standing in line at the bank. The
decision she confronts is how many trips to the bank she should make each year, given that she wants to
earn interest, but given also that visiting the bank is costly.
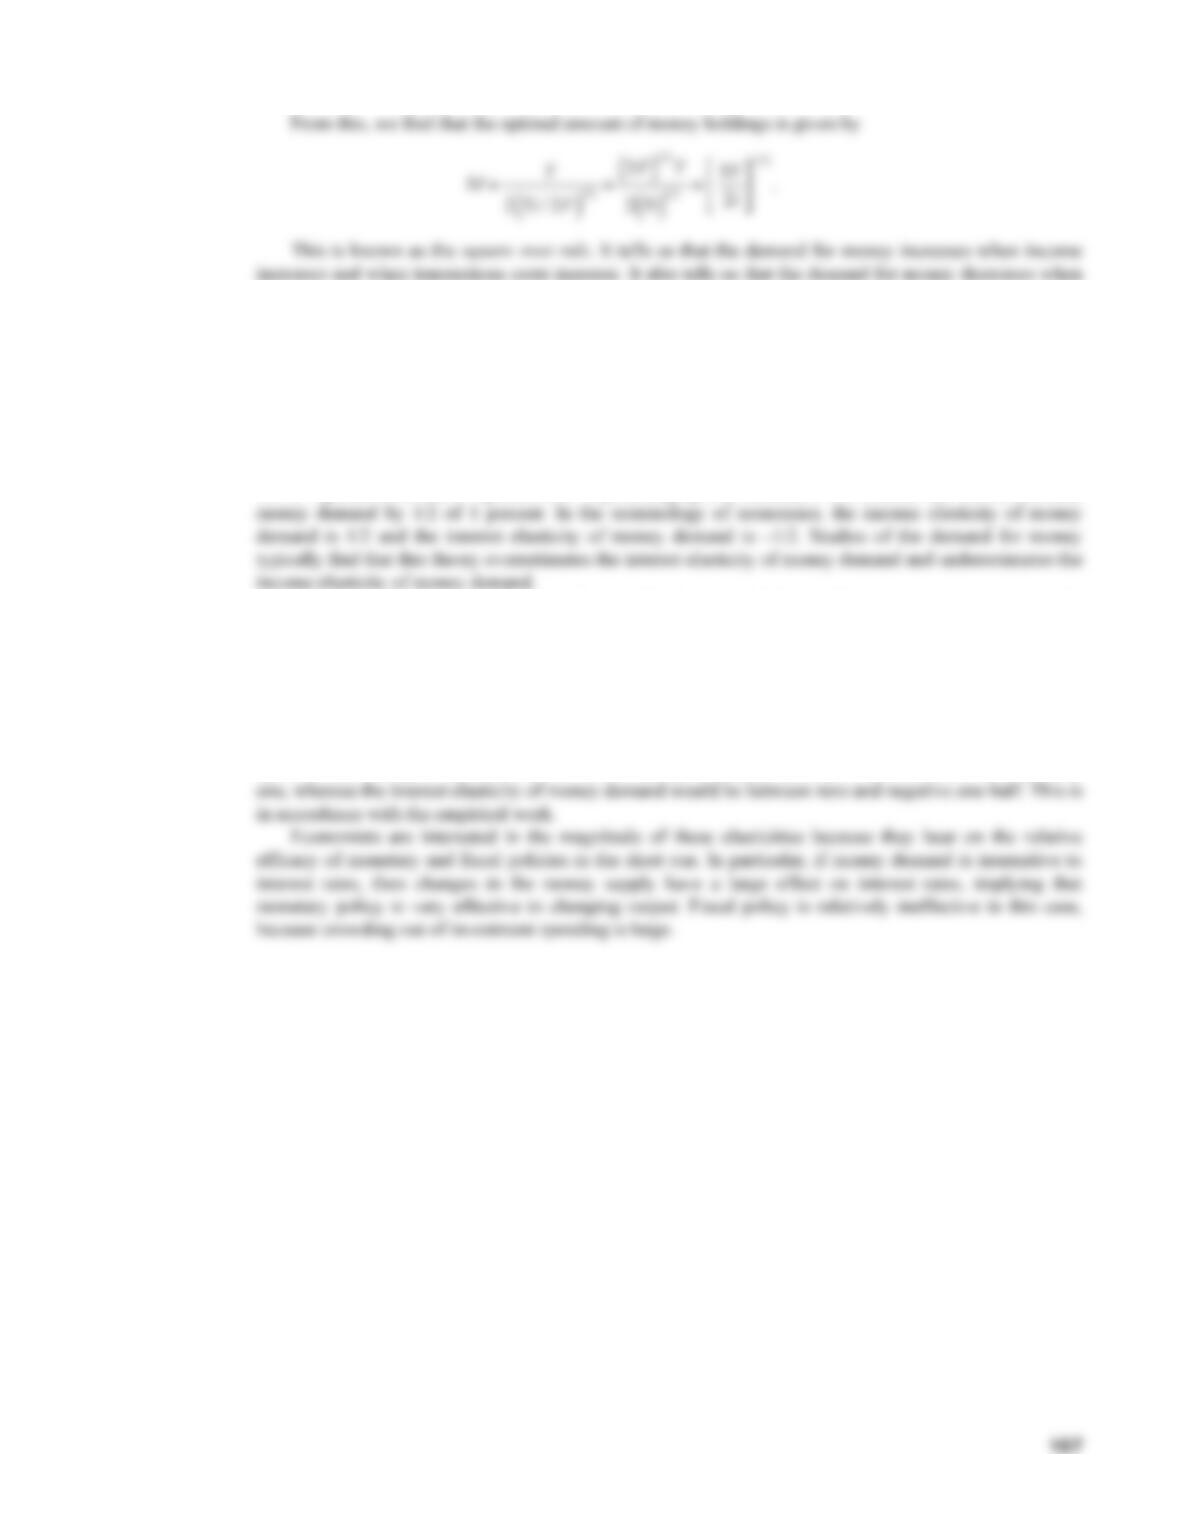
the interest rate increases. The square root rule thus provides microeconomic support for the demand for
money function that we have been using, as well as telling us that transactions costs might also matter. For
example, we might think that transactions costs have been declining over time, as information systems and
automated banking have developed. This would suggest that the demand for money has been decreasing
over time.
Empirical Studies of Money Demand
The Baumol–Tobin model predicts that a 1 percent increase in income should increase money demand by
1/2 of 1 percent and that a 1 percent (not 1-percentage–point) increase in the interest rate should decrease
The most probable reason for the failure of the Baumol–Tobin model is integer constraints. As the
model is set up, the optimal number of trips to the bank for an individual might be calculated to be 0.3, for
example. In reality, such a person will make either zero or one trip to the bank. Small changes in the
interest rate or income will not affect the number of trips to the bank for such a person. As a result, her
holdings of money will respond proportionately to changes in income and not at all to changes in interest
rates. For her, the interest elasticity of money demand is zero and the income elasticity of money demand
is one. If the world consists partly of people like her and partly of people whose behavior is well described
by the Baumol–Tobin model, then the income elasticity of money demand would be between one–half and
108
LECTURE SUPPLEMENT
5-7 Inflation and Economic Growth
1960–1990. His aim was to isolate the effects of inflation on growth by holding constant other
determinants of growth. That is, if two countries differed only in their rates of inflation, would their
growth rates also be different? According to Barro, the answer is yes. If one country had an annual
inflation rate that was 10 percentage points higher than the inflation rate in another country, the annual
growth rate of per–capita real GDP would be 0.2–0.3 percent lower in the country with the higher inflation.
For example, if the growth rate in the lower inflation country is 3 percent, the growth rate in the country
with a 10–percentage–point–higher inflation rate would be 2.7–2.8 percent. While this difference may not
seem large, after 30 years the level of real per–capita GDP in the higher inflation country would be 4–7
percent below that in the lower inflation country.2
The evidence linking inflation to lower economic growth is confirmed in Barro’s study only for
countries with annual inflation rates of 15 percent or more. Barro argues that, while the empirical evidence
cannot confirm the link between inflation and growth when inflation is below 15 percent, there is reason to
believe that such a link exists.
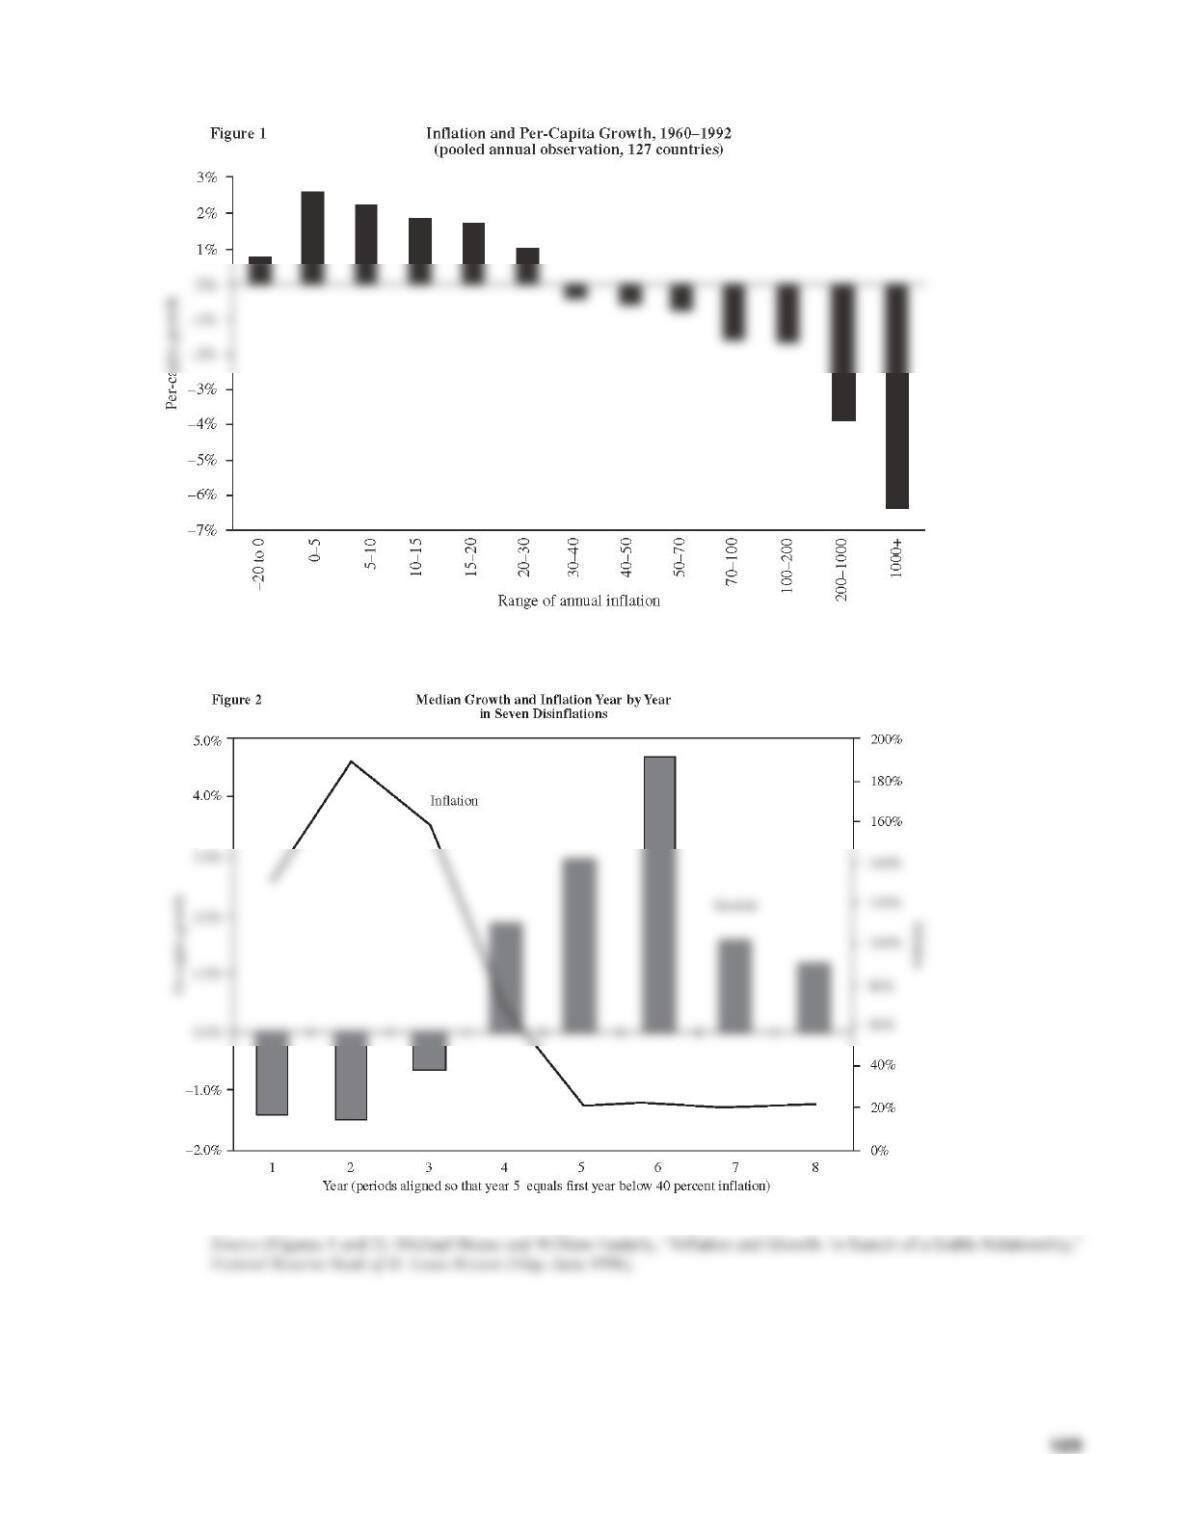
Bruno and Easterly also investigated the effects of inflation on growth. They studied 127 countries
over the period 1960–1992. Using the annual observations for each country, Figure 1 provides a simple
illustration of the link between inflation and growth. When annual inflation was in the 0–5 percent range,
the corresponding growth rate was close to 3 percent. However, as inflation rose, the annual growth rate
110
ADVANCED TOPIC
5-8 The Welfare Costs of Inflation and the Optimum Quantity of Money
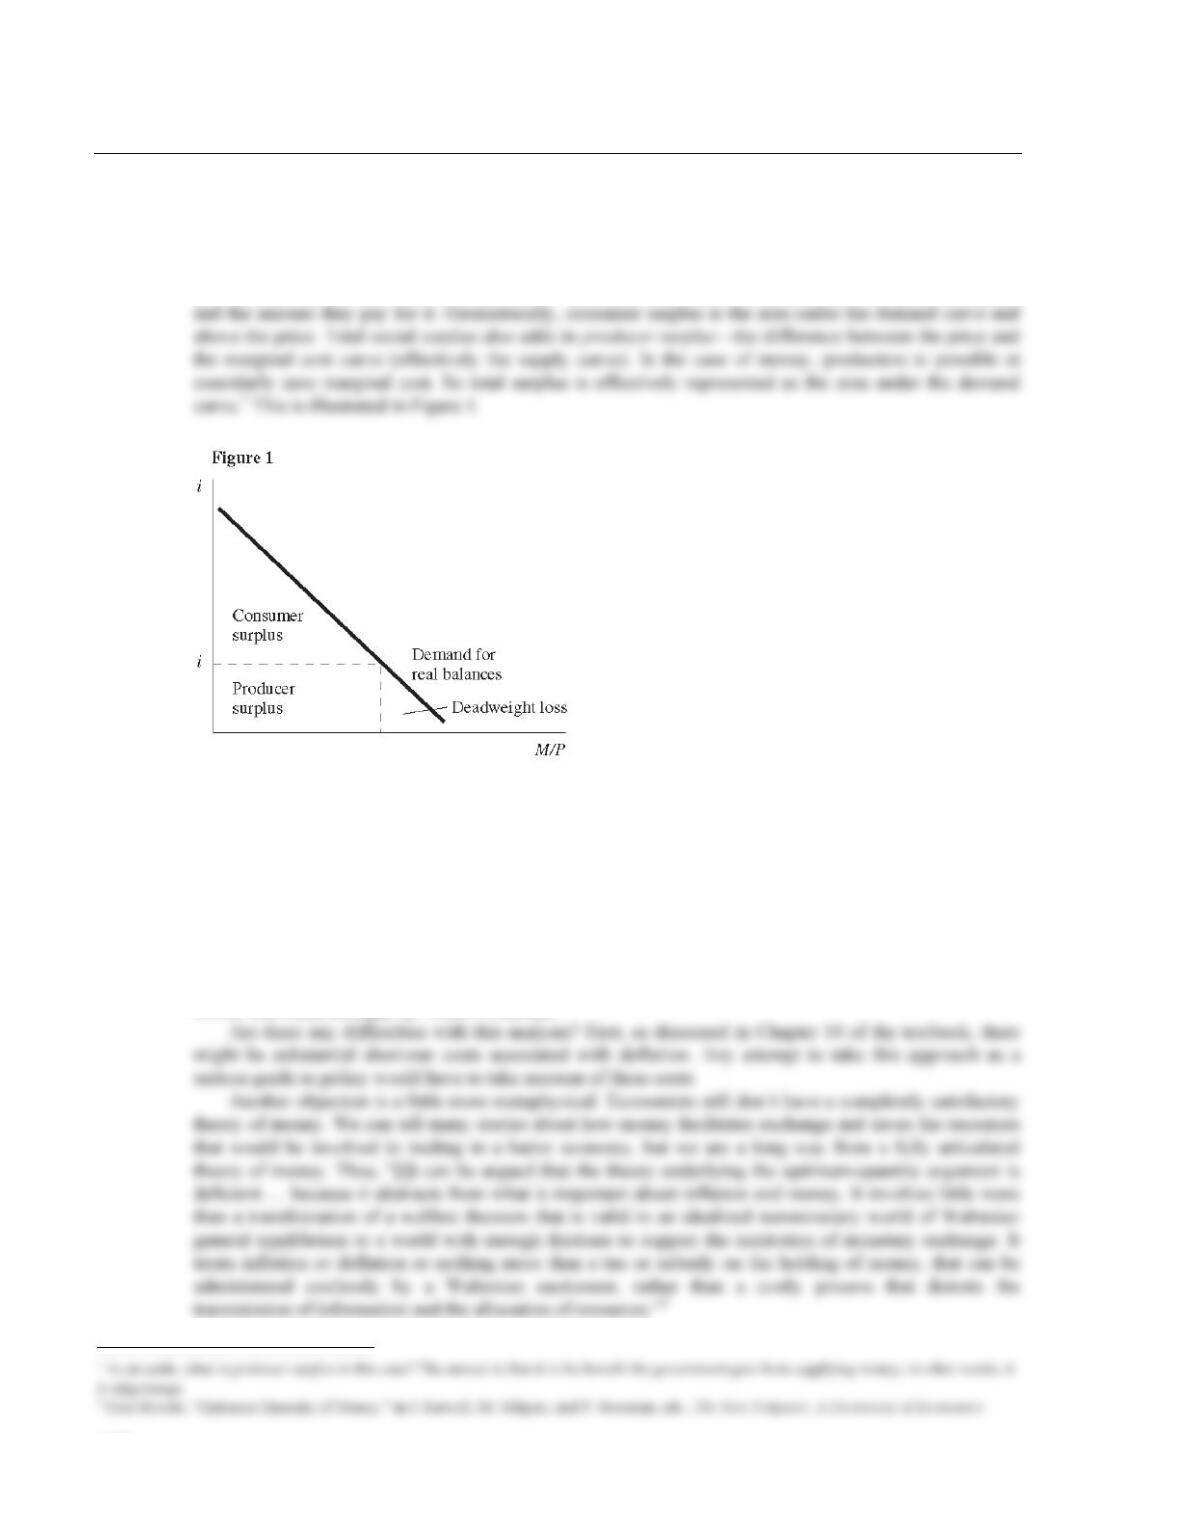
Here, we analyze “shoe–leather” costs of inflation a bit more formally. The demand for money can be
represented as depending on the “price” of money—the nominal interest rate. This demand curve also
gives us a means of measuring the benefit of holding money. Microeconomics suggests that we can
measure this benefit as consumer surplus—the difference between the benefit consumers get from a good
Total social surplus is maximized (that is, the deadweight loss eliminated) by driving the nominal rate
of interest down to zero. There is then no cost to holding money rather than interest–bearing assets. From
the Fisher equation,
i = r + π
so it follows that setting the nominal interest rate to zero would be equivalent to maintaining deflation at a
rate equal to the real interest rate. Thus, if the real interest rate is 3 percent, then this analysis suggests that
the monetary authorities should try to ensure 3 percent deflation. In this case the monetary authorities
would effectively be paying a real interest rate of r on currency. This argument for the optimum quantity of
money was made strongly by Milton Friedman.
111
A third problem with this simple argument is based on public finance considerations. Governments
need to levy taxes to finance their expenditures. From a microeconomic point of view, taxes introduce
microeconomic distortions and so may get in the way of optimal resource allocation. Basic principles of
taxation then suggest that it is good to use a combination of taxes to try to minimize such distortions. In
this case, it would be desirable to use the inflation tax in combination with other taxes.3
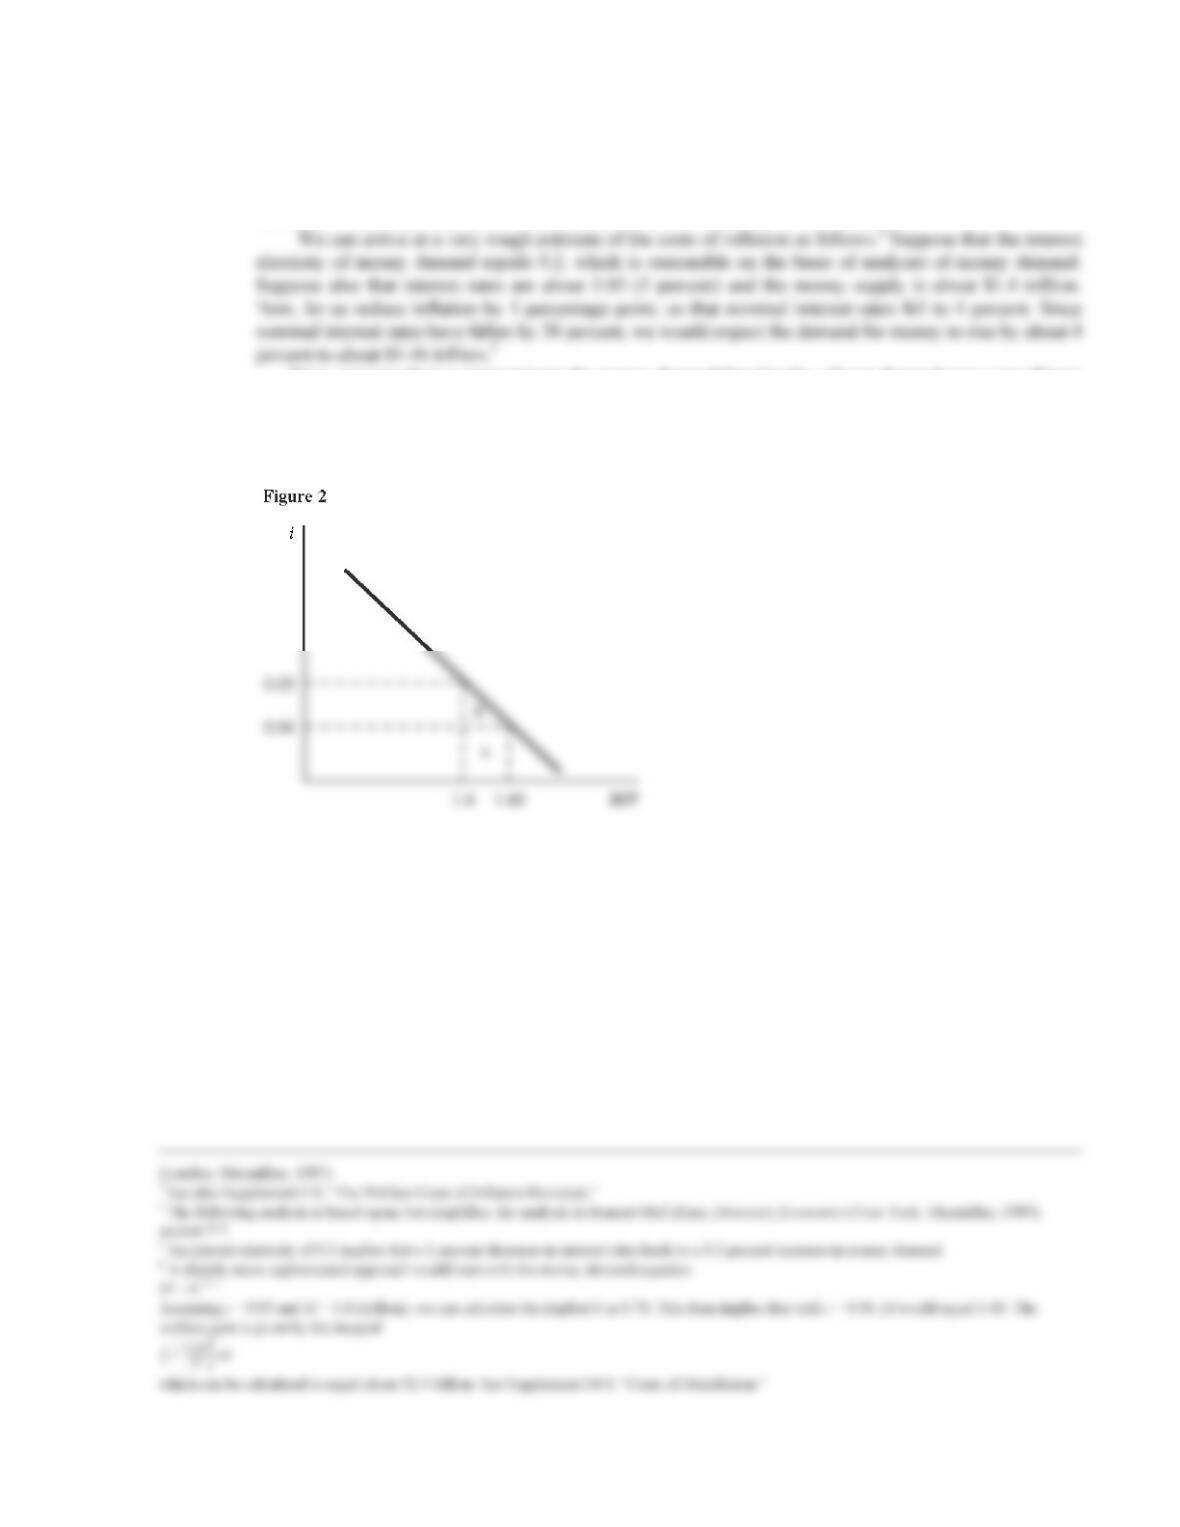
Now, suppose that we approximate the money demand function by a linear demand curve (see Figure
2). In this case, the increase in consumer surplus is given by A + B. Since the rectangle A has area (0.06 ×
0.04) and the triangle B has area (0.5 × 0.06 × 0.01), this equals $ 2.7 billion, or about two–hundredths of a
percent of GDP.6
112
ADDITIONAL CASE STUDY
5-9 The Welfare Costs of Inflation Revisited
Rao Aiyagari has pointed out that analyses of the welfare cost of inflation should take account of the fact
that currency is held by operators in the underground economy.1 According to a Federal Reserve study
cited by Aiyagari, adult U.S. residents hold only about 12–14 percent of U.S. currency. Other studies
suggest that businesses hold about 3 percent of currency.2 Over 80 percent of currency is held by residents
of other countries or those in the underground economy. Any estimate of the “shoe–leather” costs of
inflation needs to be revised down accordingly, at least if policymakers are primarily concerned with the
welfare of law–abiding U.S. citizens.
The inflation tax may be the only way of taxing those engaged in illegal activities. On the basis of
studies estimating the size of the underground economy to be about 10 percent of the above–ground
economy and estimating that currency in the underground economy is about 6 percent of total currency,
Aiyagari estimates that 5 percent inflation implies an effective income tax rate on the underground
ADDITIONAL CASE STUDY
5-10 Indexation
One response to unanticipated inflation is indexation. In times of relatively high inflation, labor (and some
other) contracts often contain indexation provisions. In the mid– to late 1970s, cost of living adjustment
(COLA) clauses were a common feature of U.S. union contracts: More than half of all workers covered by
union contracts were under contracts featuring COLA provisions. Such clauses generally specify a given
dollar increase for a given increase in the CPI. Indexation provisions are often limited by “triggers,” so
that they come into effect only after some minimum rate of inflation is reached. They also are sometimes
subject to “caps,” or maximum increases permitted under the contract.
Indexation, as noted, is more common in times of high inflation. (As an example, COLAs in Israeli
contracts took place twice a year up to 1980, but, as inflation rose rapidly, such adjustments took place
quarterly, then monthly.) It is unclear, though, whether it is simply high inflation that makes such
provisions more attractive to workers and firms, or whether it is instead the associated higher variability of
inflation.
114
LECTURE SUPPLEMENT
5-11 U.S. Treasury Issues Indexed Bonds
The U.S. Treasury began issuing inflation–indexed debt securities in January 1997. These securities,
known as “Treasury Inflation–Protection Securities,” or “TIPS,” have their principal and coupon payments
adjusted every six months to compensate investors for inflation. The securities have been issued in
maturities of 5, 10, and 30 years. In issuing inflation–indexed debt, the United States joins several other
countries that issue such debt, including the United Kingdom, Israel, Australia, Canada, New Zealand, and
Sweden.
To adjust for inflation, the Treasury uses the change in the consumer price index over the six months
ending roughly two months prior to the date of adjustment. This lag is the minimum possible, given the
schedule for constructing and publishing the CPI. The adjustment is not quite symmetric: in the case of
Protection Against Inflation Risk
These securities protect against inflation risk because investors are compensated for inflation regardless of
whether it is expected or unexpected. Thus, a fixed real return is guaranteed for investors holding these
Reduction of Government Financing Costs
The government’s financing costs are likely to be lower, on average, when it issues indexed debt rather
than conventional debt. This occurs because the interest rate on conventional debt exceeds the rate on
indexed debt by an amount equal to expected inflation plus a risk premium. This premium on conventional
Stabilization of Government Finances
Indexed securities fix the real cost of financing government debt because the nominal payment is adjusted
to offset the effects of inflation. This helps to stabilize the real cost of servicing the government debt. To
see this, consider a government that issued a 30–year bond at a time when inflation was high and expected
to continue at a high rate, so that the nominal interest rate on the bond also was very high. Now, suppose
that inflation actually declines sharply after a few years. The effective real interest rate on these bonds will
1 The return on indexed securities, however, is treated in the same way for tax purposes as the return on conventional securities, with income tax
levied on the nominal return. Thus, for indexed securities, the adjustment to principal is taxed even though it is not paid out until maturity. See
115
Measure of Expected Inflation
As mentioned above, the spread between the interest rate on a conventional security and the interest rate
on an indexed security of the same maturity is equal to the sum of expected inflation and an inflation–risk
premium. To the extent that the risk premium is relatively constant, then movements over time in the
spread will capture movements in expected inflation. One caveat to interpreting such movements in this
way, however, is whether indexed securities might have to pay a premium because the market is small and

116
CASE STUDY EXTENSION
5-12 A Guide to Oz
The following is a listing (more complete than in the textbook but far from exhaustive) of some of the
symbols identified by Hugh Rockoff in his Journal of Political Economy article.1 (Other writers on the
topic have suggested different interpretations for some of these symbols.)
Dorothy = America
Toto = Prohibitionist party (teetotalers)
Oz = “Fantasy counterpart to America”; Oz also equals ounce (of gold)
Cyclone (tornado) = Free Silver Movement
Silver shoes (of Wicked Witch of the East) = Silver component of bimetallism
Munchkins = Citizens of the East (!)
CASE STUDY EXTENSION
5-13 Are Monetary Allegories in the Eye of the Beholder? The Case of Mary
Poppins
Hugh Rockoff’s argument that The Wizard of Oz is a monetary allegory invites speculation that other
popular children’s movies also contain economic subtexts.1 We suggest here that the popular 1964 Walt
Disney movie Mary Poppins is in fact a thinly disguised commentary on market instability and the debate
over monetary and fiscal policy.2 As most readers undoubtedly recall, Mary Poppins tells the story of two
young children in London (Jane and Michael) and their magical nanny, Mary Poppins.
Any attempt to chart the economic significance of Mary Poppins must naturally start by considering
what the character herself represents. It can hardly be coincidence that her initials are the standard
notations for the two most important variables in monetary economics. The thesis here is that Mary
Poppins signifies Monetary Policy.
The movie is unmistakably Keynesian in its conclusions. First, when George Banks advertises the
post of nanny for Jane and Michael, a large number of applicants seek the position. The line of nannies
outside the Banks’s front door evidently signifies unemployment. Yet when Mary Poppins arrives at the
The movie’s Keynesian thesis is perhaps most evident when Jane and Michael accompany their father
to the bank. Michael wishes to spend his two pence on feeding the birds. This is reminiscent of the public
works projects advocated by Keynes and, in the movie, such a fiscal (spending) policy is clearly endorsed.
Instead, Michael is given an extended lecture (in song) of the virtues of thrift and of placing his money in
financial institutions. Another important theme of Keynesian economics, of course, is the idea that thrift
may be a social ill even if a private virtue. Michael’s view that saving will not aid the creation of wealth is
dramatically vindicated by the bank run described earlier: His cries of “I want my money” are sufficient to
reduce the confidence of other depositors and precipitate a major run on the bank. Keynes’s views on
financial market volatility are, of course, well known and are vividly illustrated in this scene.3
The interpretation of the movie proposed here leads to a much less sanguine view of the final scene
than the ostensibly happy ending might suggest. Michael’s two pence are ultimately spent on materials for
a kite. Distrust of financial markets is nowhere clearer than in a closing scene in which the entire bank
staff is engaged in (check?) kiting.

LECTURE SUPPLEMENT
5-14 How to Stop a Hyperinflation
The sensitivity of real money balances to the nominal interest rate complicates the problem of stopping a
hyperinflation. If the quantity theory were completely true and the nominal interest rate did not affect
money demand, then stopping a hyperinflation would be easy: The central bank would merely need to stop
printing money. As soon as the quantity of money stabilized, the price level would stabilize.
How to Stop Inflation When Real Balances Depend on the Nominal Interest Rate
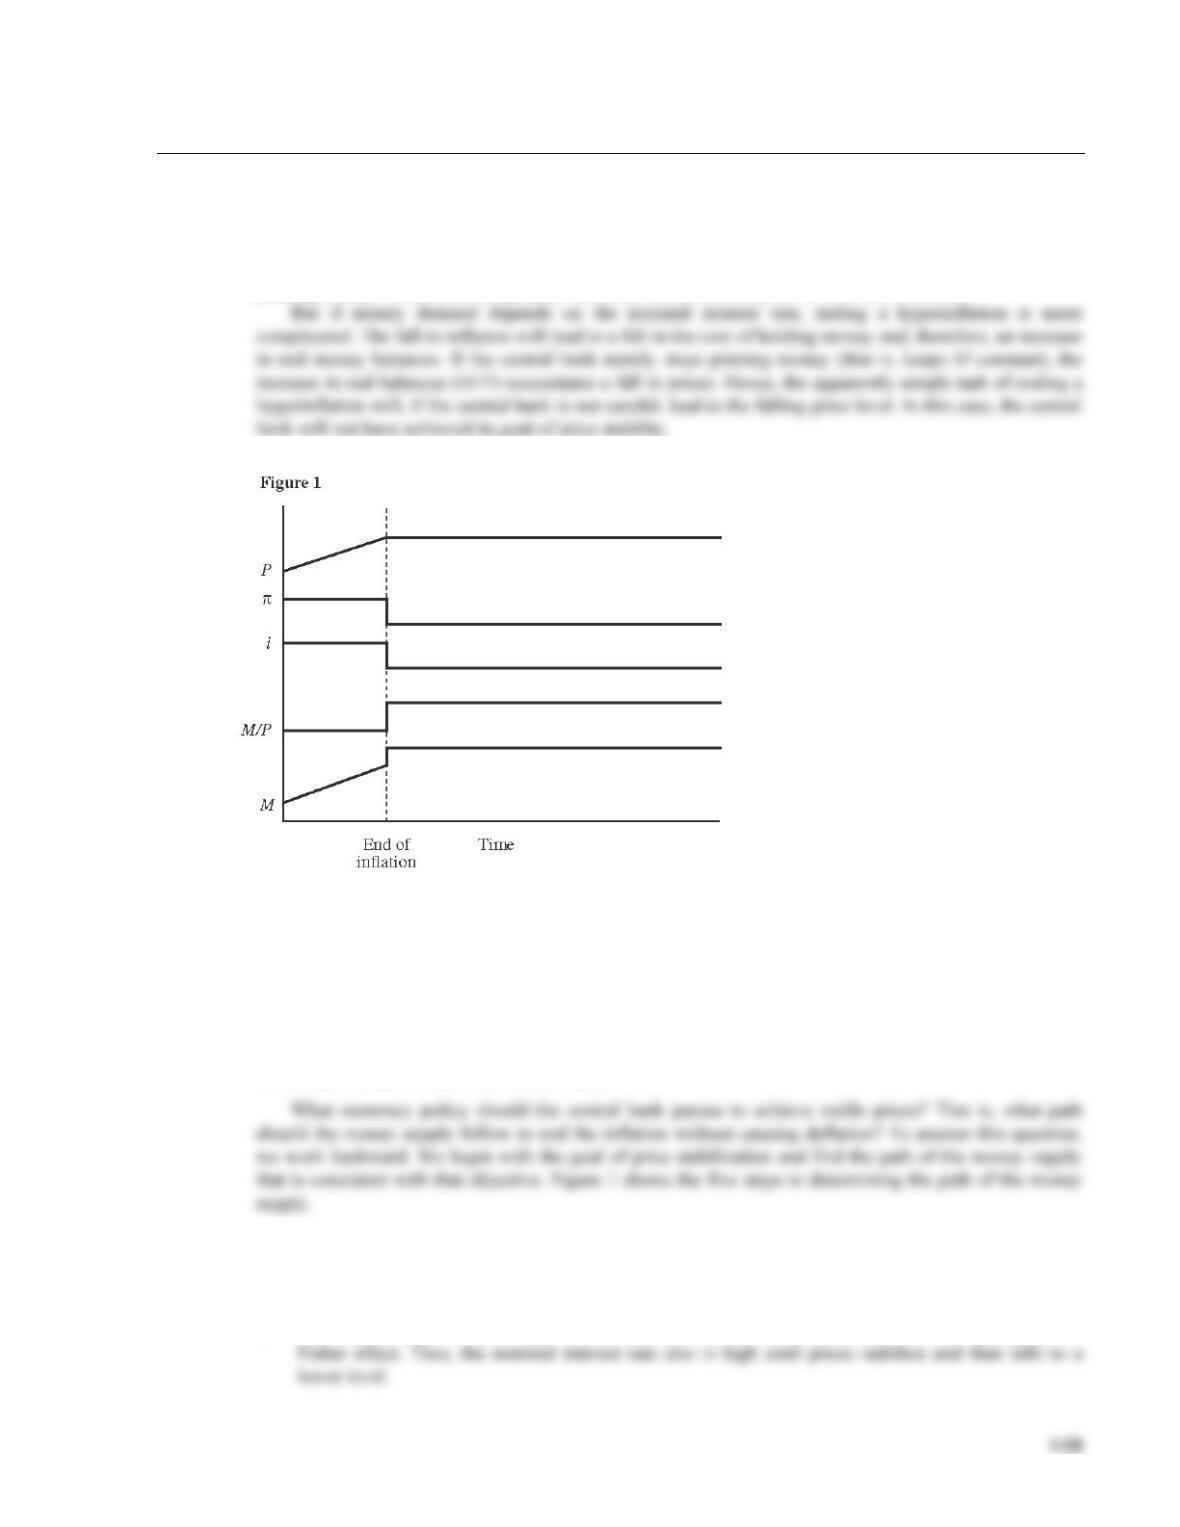
By examining the paths we expect the key monetary variables to follow, we can derive the path that the
money supply must follow to end inflation. (1) At the top is the desired path of the price level P. (2) Next
is the rate of inflation π, which is high until the period of price stability, when it drops to zero. (3) The
nominal interest rate i adjusts one–for–one with the rate in inflation. (4) The fall of the nominal interest rate
leads to a jump up in real balances M/P. (5) The path of the money supply M then depends on the path of
the price level P and the path of real balances M/P.
Note: Each variable is drawn on its own scale.
1. The desired path of the price level is at the top of the figure. The price level is rising during the
hyperinflation. Then, the new monetary policy goes into effect and prices stabilize.
2. Next is the rate of inflation π, which is the growth in the price level. It is high until the period of price
stability, when it drops to zero.
3. The nominal interest rate i adjusts one–for–one with the rate of inflation. This is required by the
120
5. Since we now know the path of the price level P and the path of real balances M/P, we can infer the
required path of money M. At the moment the hyperinflation ends, the money supply must jump up
to accommodate the increase in real balances. After the jump, the money supply stays constant to
ensure price stability.
An important issue that this analysis does not address is the central bank’s credibility. For expected
inflation and the nominal interest rate to fall, people must believe that the central bank will stop printing so
much money. This expectation is hard to create in the midst of a hyperinflation. Indeed, if the central bank
does not achieve credibility, expected inflation and the nominal interest rate will not fall, real balances will
not rise, and the jump in the money supply will lead to more inflation.
ADDITIONAL CASE STUDY
5-15 The Israeli Hyperinflation
Ending hyperinflations, as the textbook notes, requires that the central bank have credibility at the time
that reforms are undertaken. Recent attempts to stop hyperinflations usually entail an entire package of
reforms to aid the transition from high to low inflation and to help maintain policymakers’ credibility.
An example is the Israeli hyperinflation in the early 1980s.1 Israel’s problems began in the mid–1970s.
however. It entailed cuts in the deficit, suspension of wage contracts, and a price freeze. The budget deficit
was cut to about 3 percent of GNP and inflation fell to 2 percent by the fourth quarter of 1985. Real wages
fell in the second half of 1985 but recovered by mid–1986, and unemployment was not strongly affected.
A particularly important element of the Israeli reform package involved an appropriate rule for
monetary policy. In Israel, the package entailed using monetary policy to fix the exchange rate relative to
LECTURE SUPPLEMENT
5-16 Additional Readings
Monetary economics is a subdiscipline of economics that is very closely related to macroeconomics but
that pays particular attention to financial institutions. A number of good textbooks exist, such as Gary
Smith, Money, Banking, and Financial Intermediation (Lexington, Mass.: D.C. Heath, 1991) and