Chapter 5
Future Population Trends
Note: Special icons in the margin identify problems requiring a computer or calculator .
◼ Solutions to Problems
1. To calculate the population of Fantasia in the year 2001, we must first find the population of each age
group. Given that of 100 zero-year-olds in the year 2000, and the probability of surviving to age one
is 1, we conclude that in the year 2001, there will be 100 one-year-olds. Similar calculations reveal
3. Libya currently has high fertility, rapid population growth, and a population age structure heavily
4. Population growth in 1950–2000 (denoted by subscript A) for the more developed country group,
,
A
n
is 0.8 percent, and predicted population growth in 2000–2050 (denoted by subscript B) for the same
If given a value for
and
, we can solve the equation above to find an exact ratio for the differences
in the steady state. Assuming that
= 1/3 and
= 0.05, then
5. In 2025: each of the 60 million 0–20 year-olds from 2005 will have had 1 girl and moved on to the
next age bracket; half of the 40 million 21–40 year-olds will have died; and all the 41–60 year-olds
6. Immediately after fertility declines to zero, the working age fraction of the population will begin to
rise. This is because the fraction of the population made up of children will fall (as some children
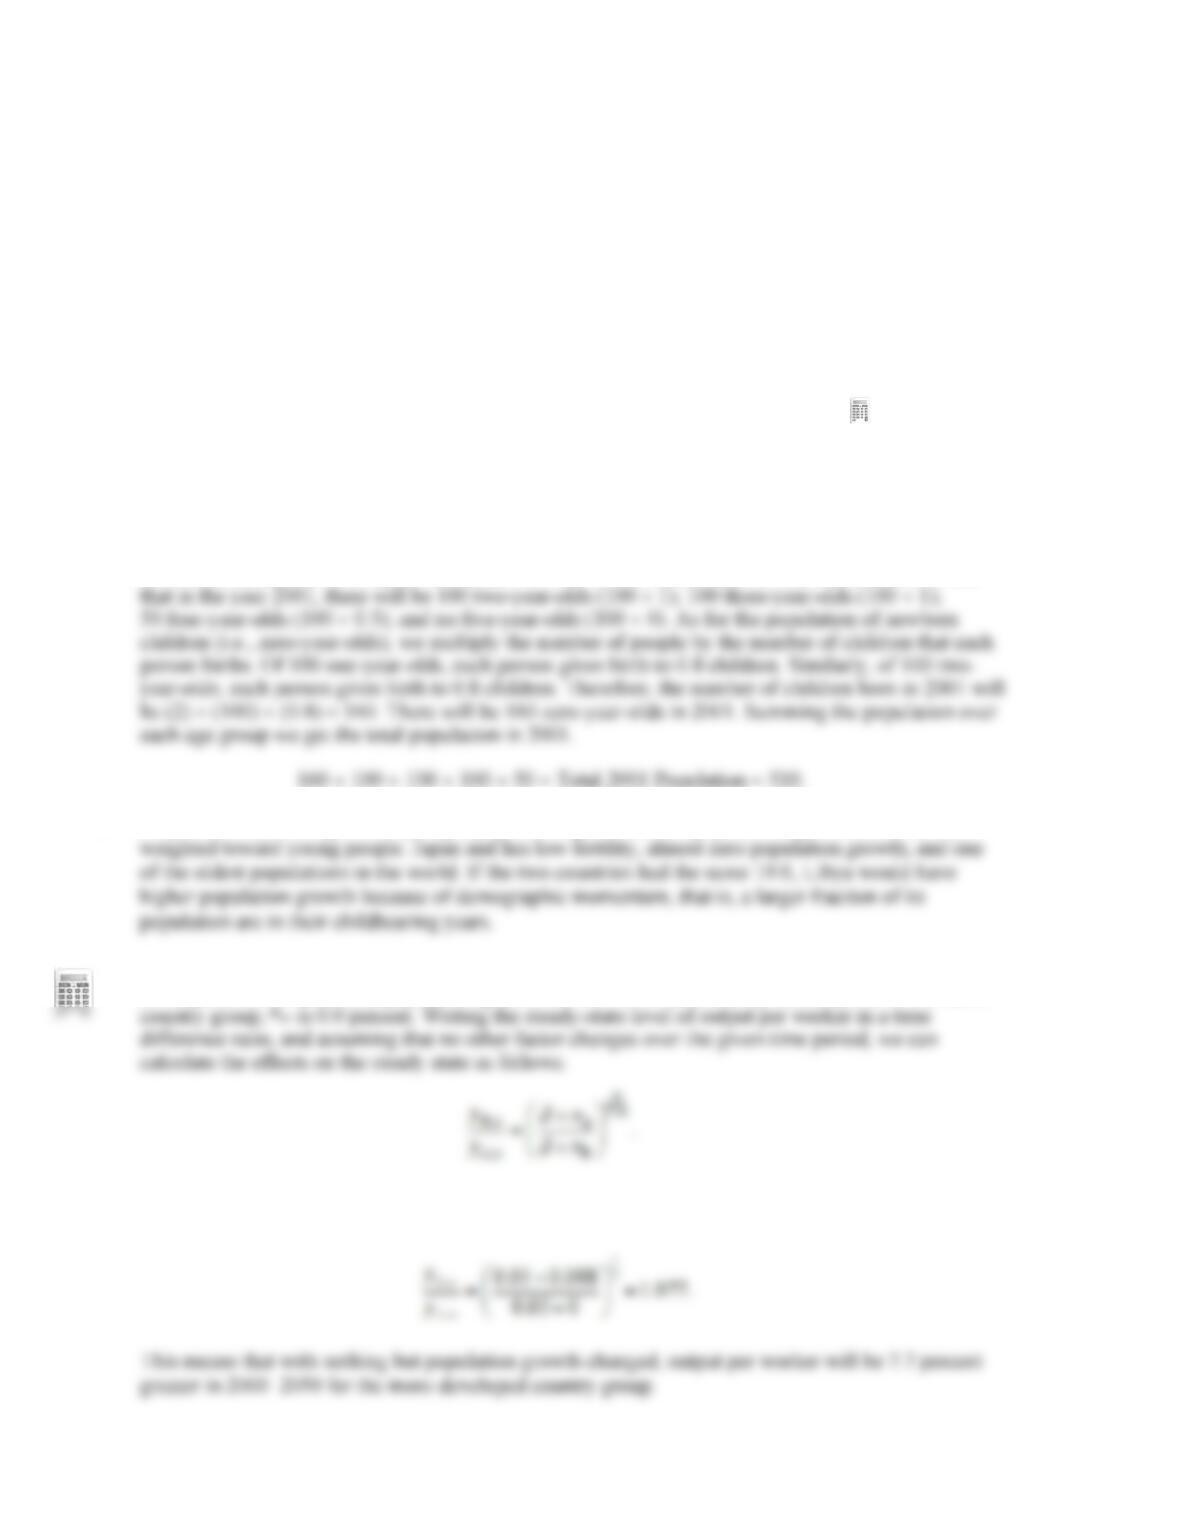
7. Calculating the growth rate of the percentage of the population that is of working age, g, the equation
becomes,
8. The statement is not necessarily true. Higher fertility will lower the fraction of the population made
up of working-age adults until the newly born children reach working age. Thus, in the short run
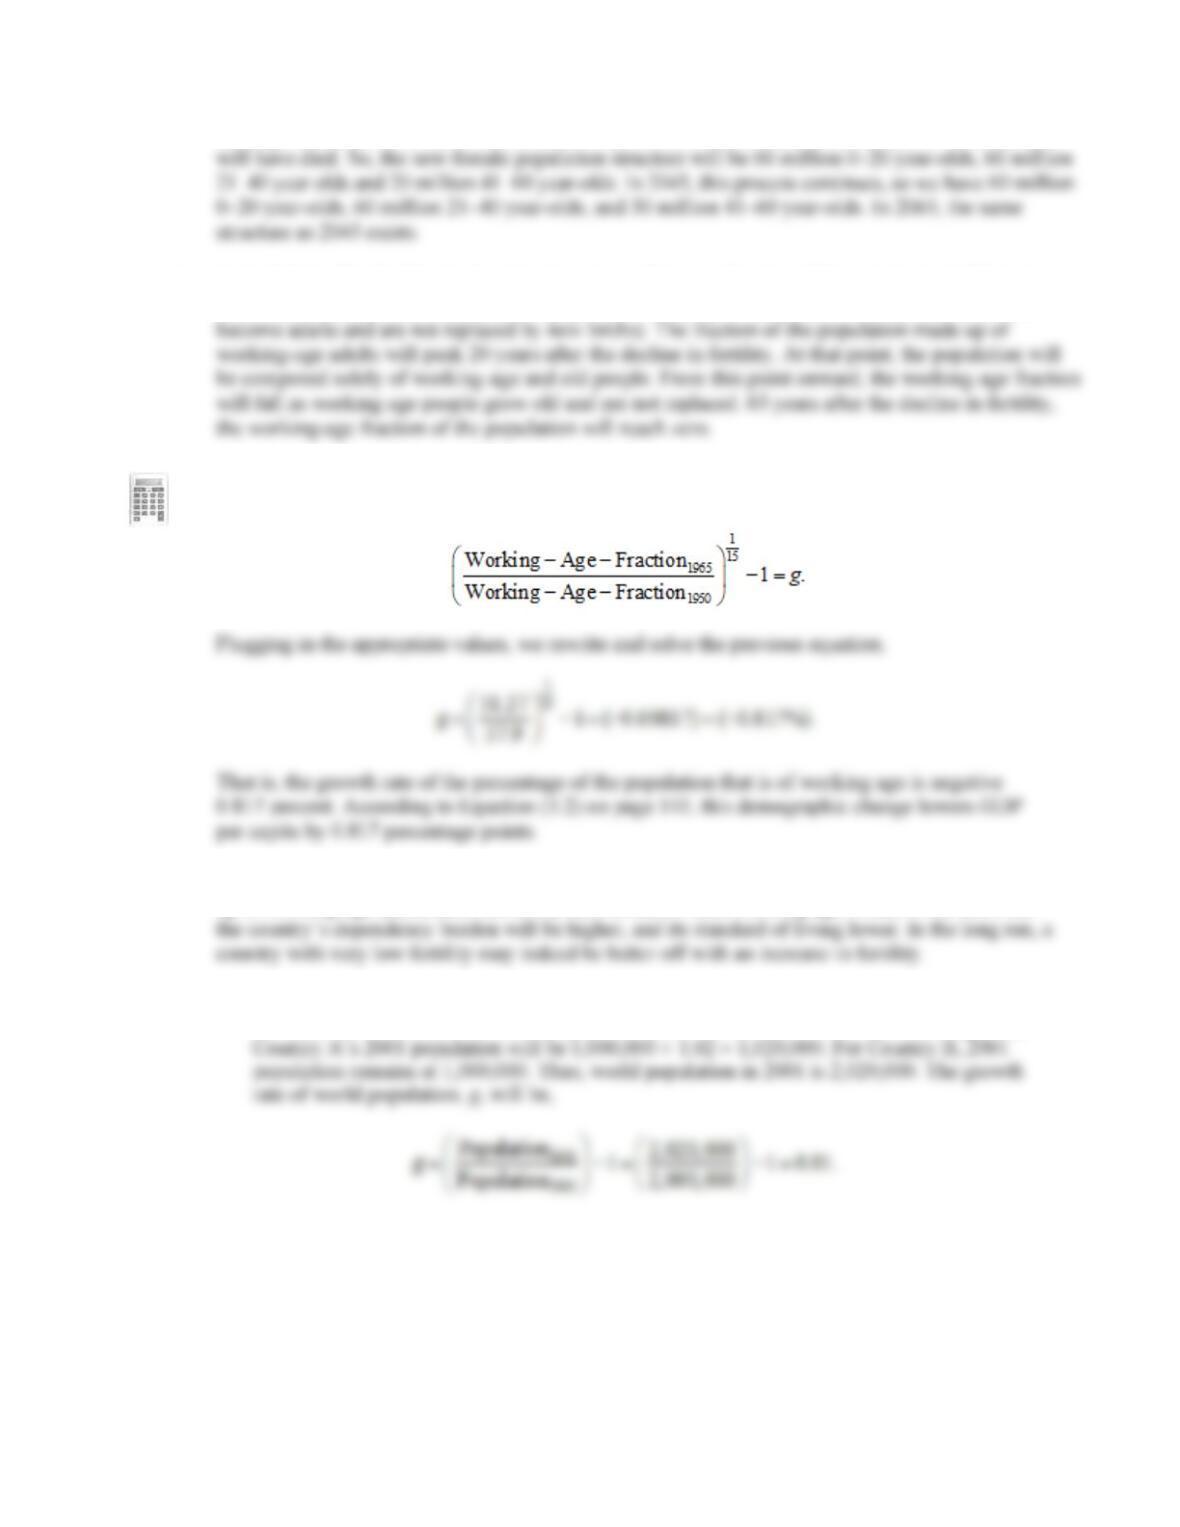
9. a. To calculate the world population in any year, we add each country’s respective populations
for that year. Therefore, the world population in 2000 is 2,000,000. For the following year,
22 Weil • Economic Growth, Second Edition
Intuitively, Country B’s population continues to grow, making Country A’s population a miniscule
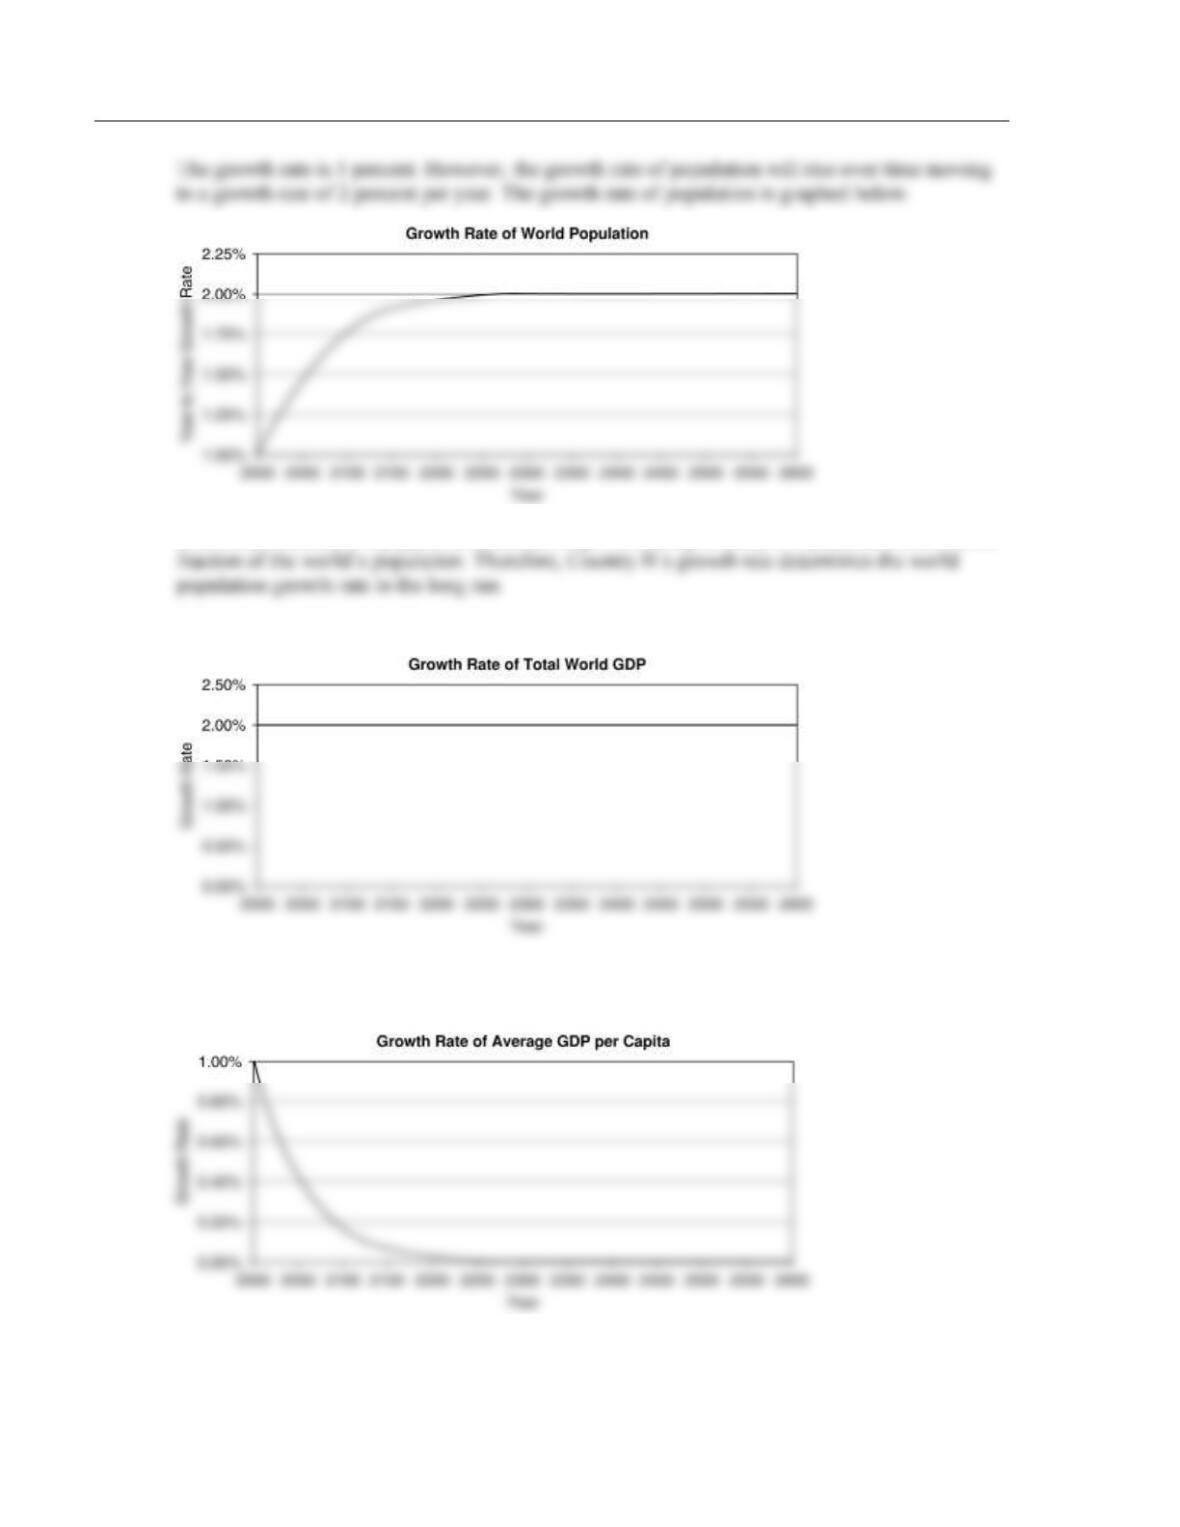
b. Below is a graph showing the growth rate of total world GDP (not per capita).
c. Below is a graph showing the growth rate of average GDP per capita.