Chapter 5 The Open Economy 41
5–15.
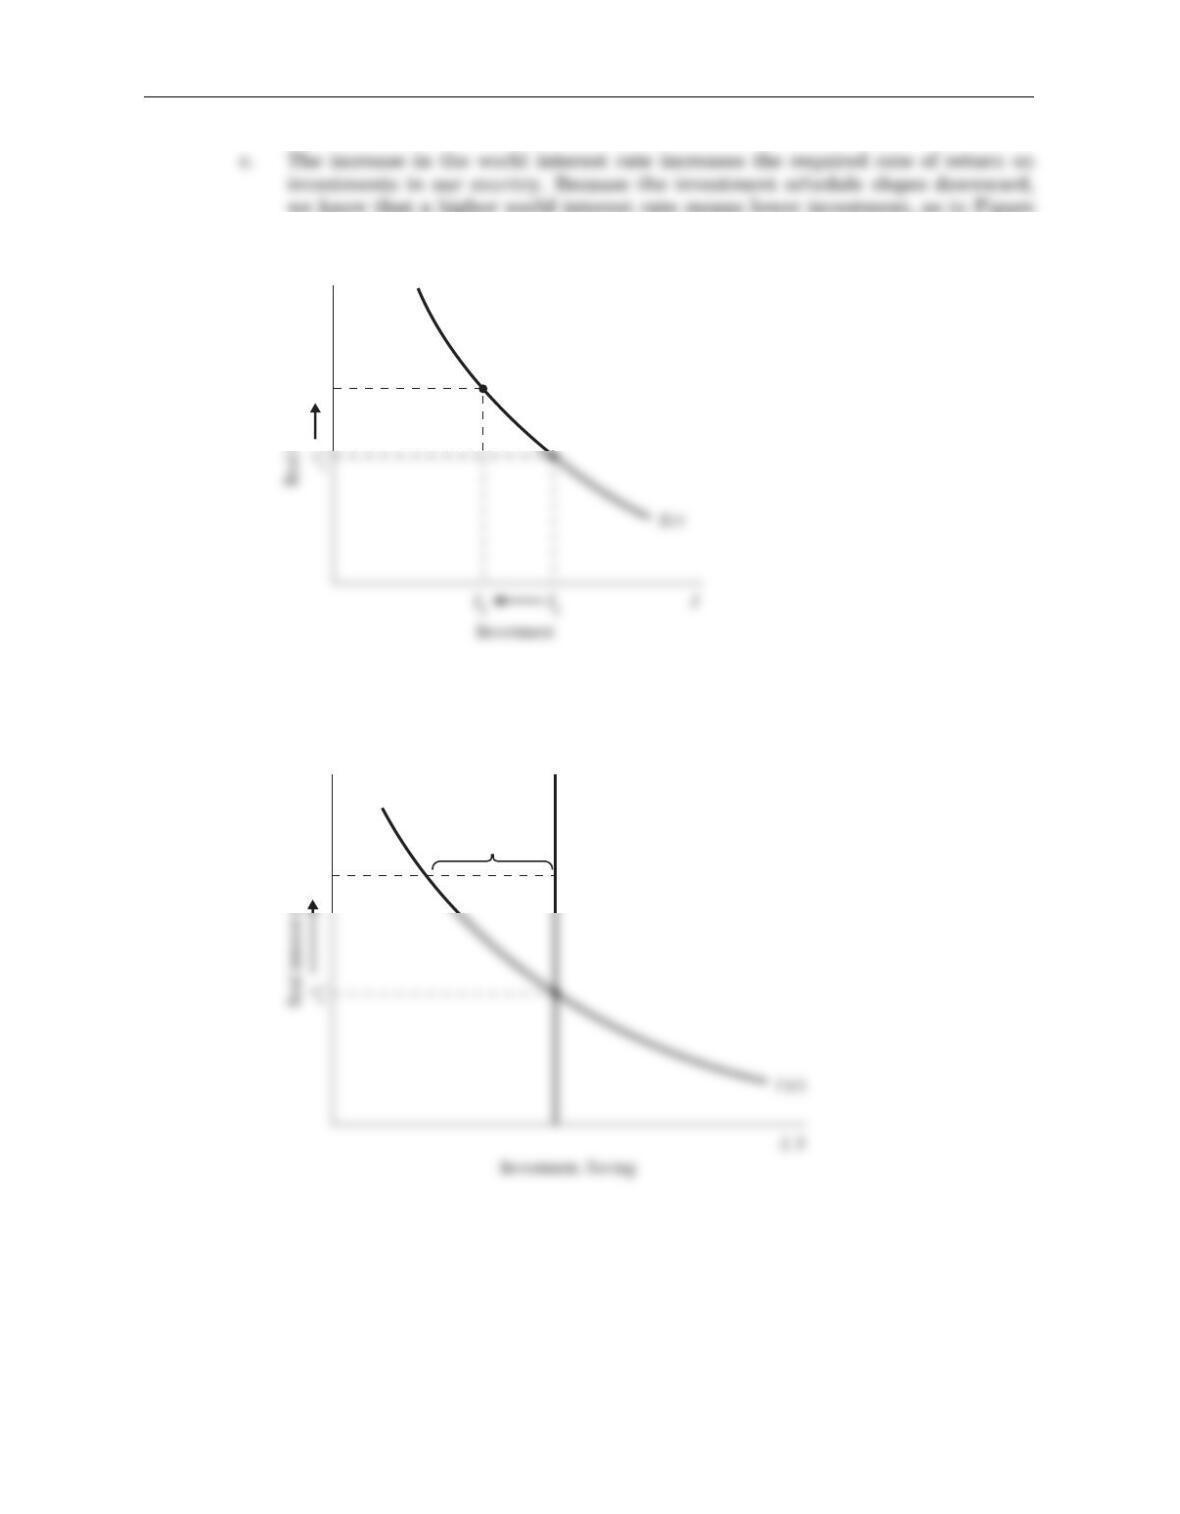
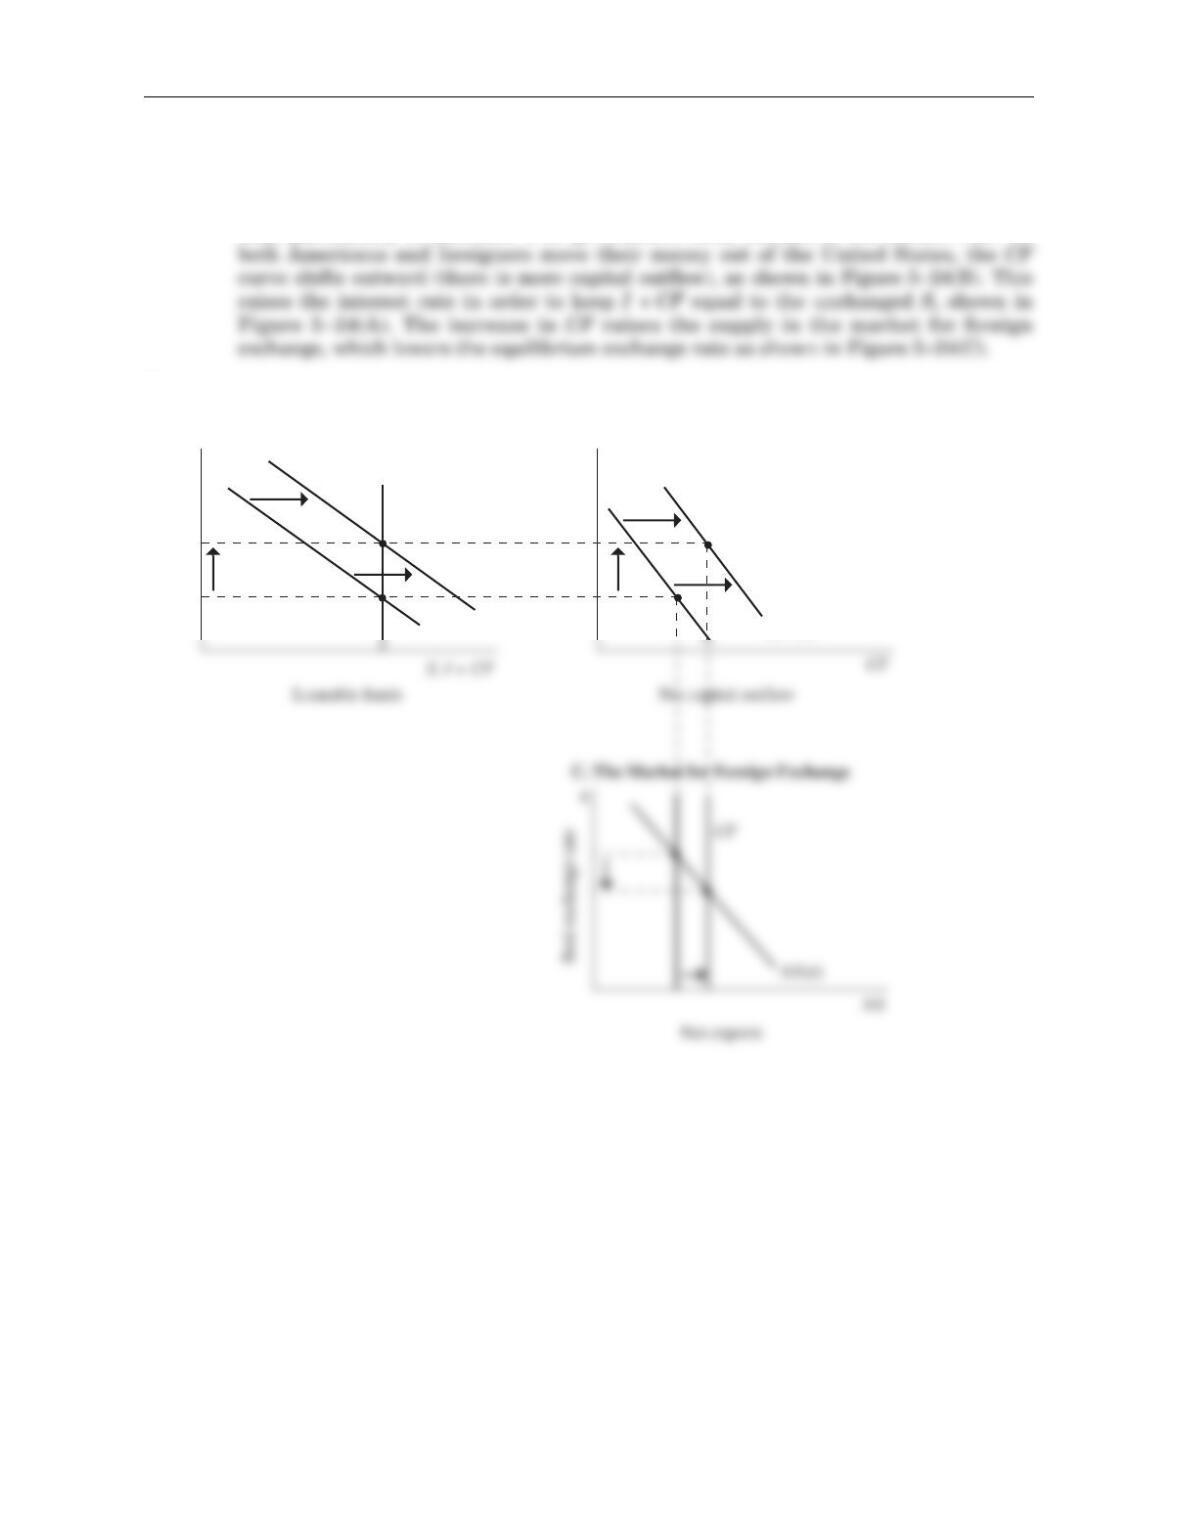
d. Given that our saving has not changed, the higher world interest rate means that
our trade balance increases, as in Figure 5–16.
S
r
r2
*
Trade
surplus
Figure 5–16
r
r2
*
Figure 5–15
e. To bring about the required increase in the trade balance, the real exchange rate
must fall. Our goods become less expensive relative to foreign goods, so that
exports increase and imports decrease, as in Figure 5–17.
10. The easiest way to tell if your friend is right or wrong is to consider an example.
Suppose that ten years ago, an American hot dog cost $1, while a Mexican taco cost 10
pesos. Since $1 bought 10 pesos ten years ago, it cost the same amount of money to buy
a hot dog as to buy a taco. Since total U.S. inflation has been 25 percent, the American
hot dog now costs $1.25. Total Mexican inflation has been 100 percent, so the Mexican
11. a. The Fisher equation says that
i = r +
π
e
where
i= the nominal interest rate
r= the real interest rate (same in both countries)
πe= the expected inflation rate.
42 Answers to Textbook Questions and Problems
∋
(S – I)1(S – I)2
Figure 5–17
Chapter 5 The Open Economy 43
b. As in the text, we can express the nominal exchange rate as
e= ε× (PCan/PUS),
where
ε = the real exchange rate
% change in e= (πCan – πUS).
Because people know that purchasing-power parity holds, they expect this rela-
tionship to hold. In other words, the expected change in the nominal exchange
rate equals the expected inflation rate in Canada minus the expected inflation
rate in the United States. That is,
est rate is 12 percent, while the U.S. nominal interest rate is 8 percent. We con-
clude from this that the expected change in the nominal exchange rate is 4 per-
cent. Therefore,
ethis year = 1 C$/US$.
enext year = 1.04 C$/US$.
More Problems and Applications to Chapter 5
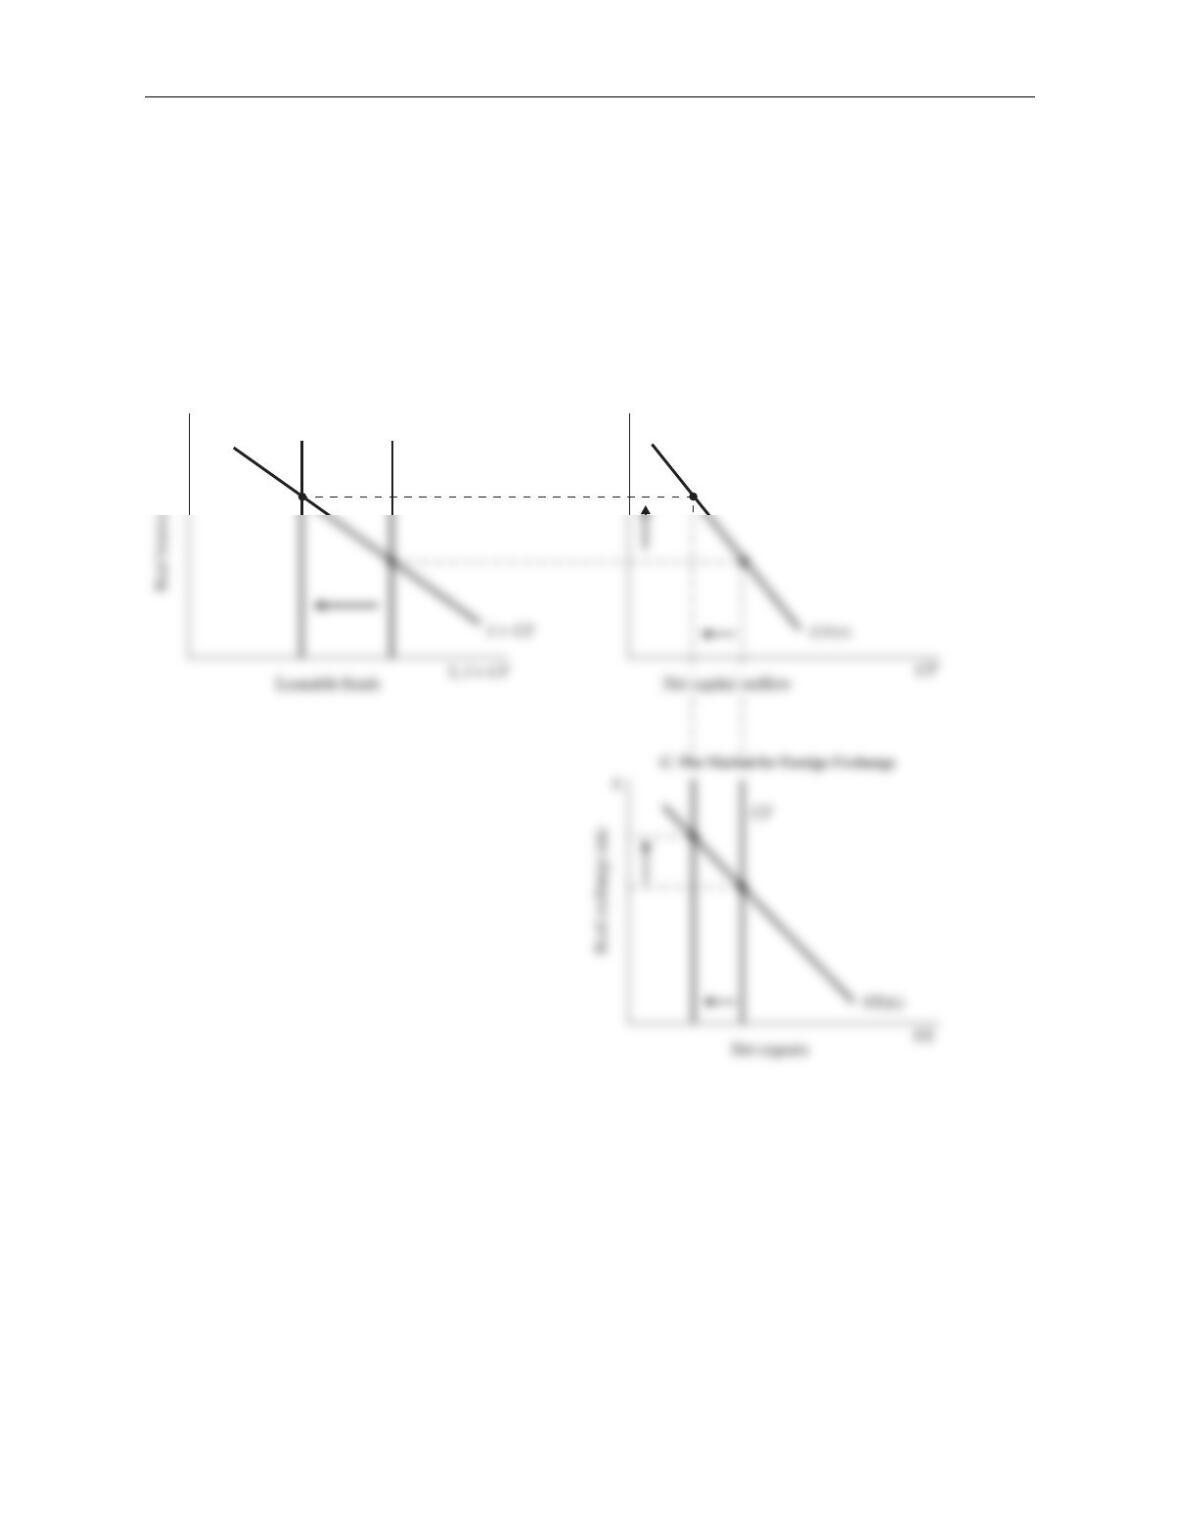
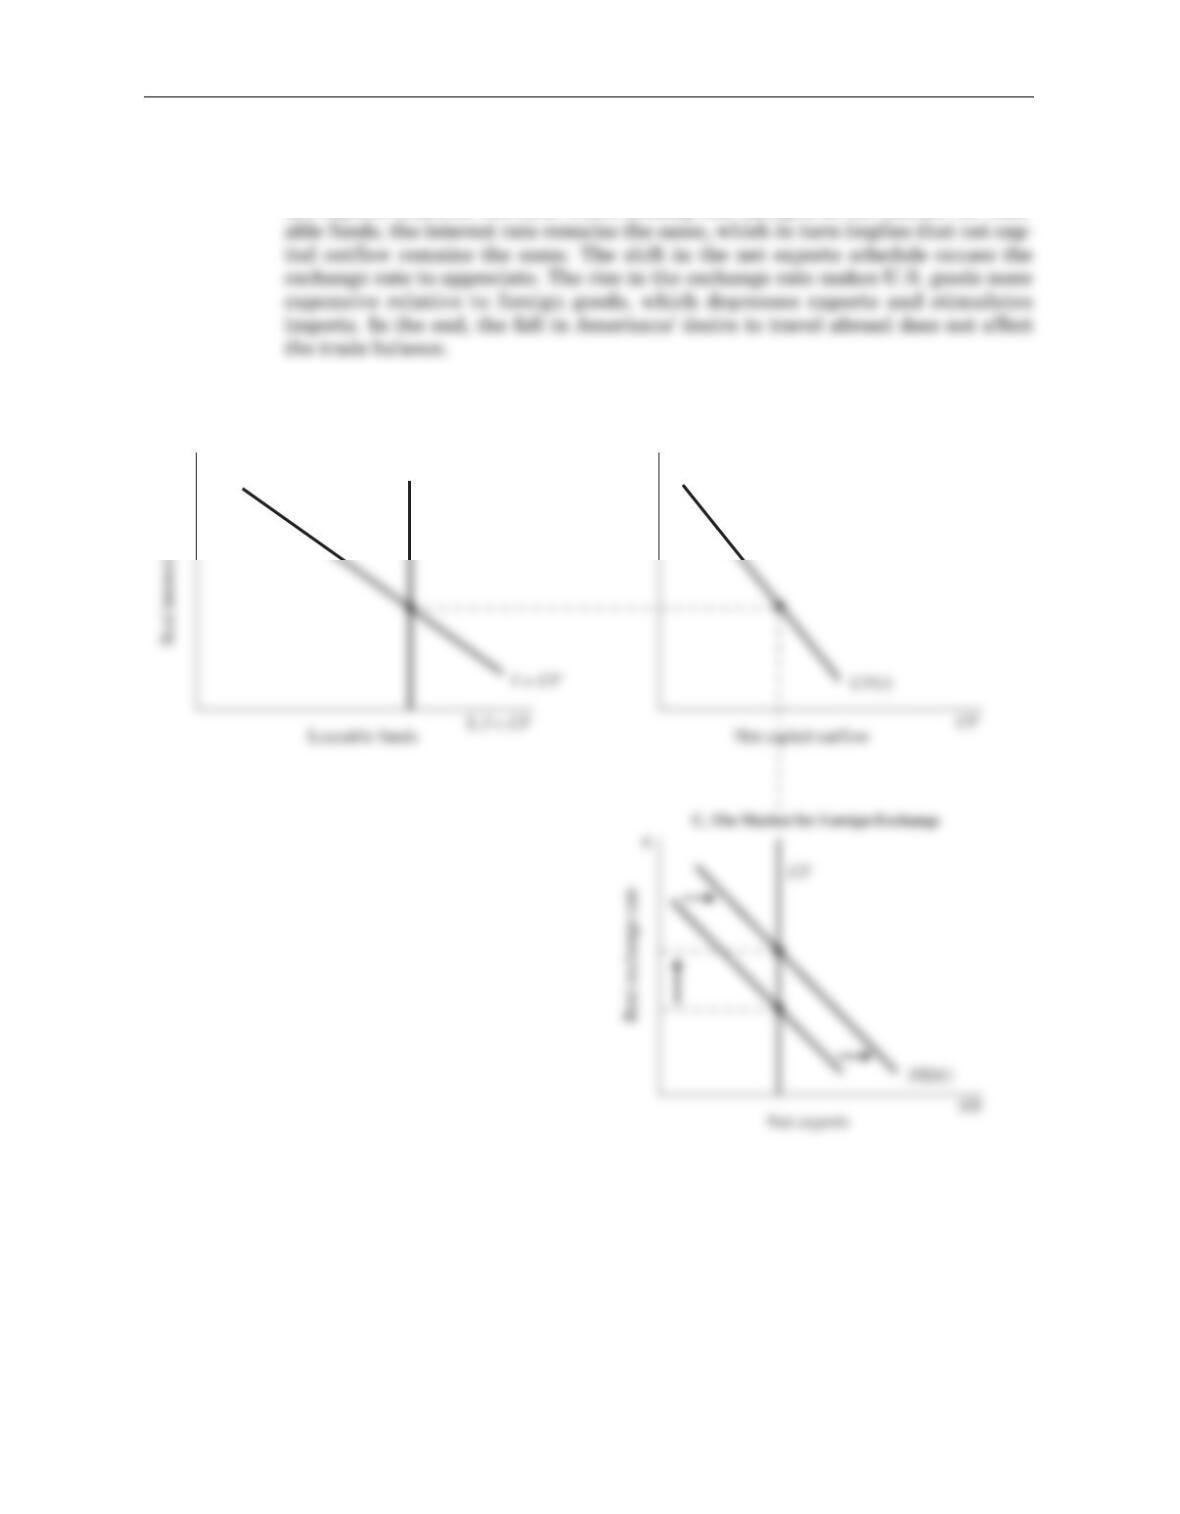
1. a. As shown in Figure 5–18, an increase in government purchases reduces national
saving. This reduces the supply of loans and raises the equilibrium interest rate.
This causes both domestic investment and net capital outflow to fall. The fall in
net capital outflow reduces the supply of dollars to be exchanged into foreign cur-
rency, so the exchange rate appreciates and the trade balance falls.
44 Answers to Textbook Questions and Problems
A. The Market for Loanable Funds B. Net Capital Outflow
S
rr
Figure 5–18
Chapter 5 The Open Economy 45
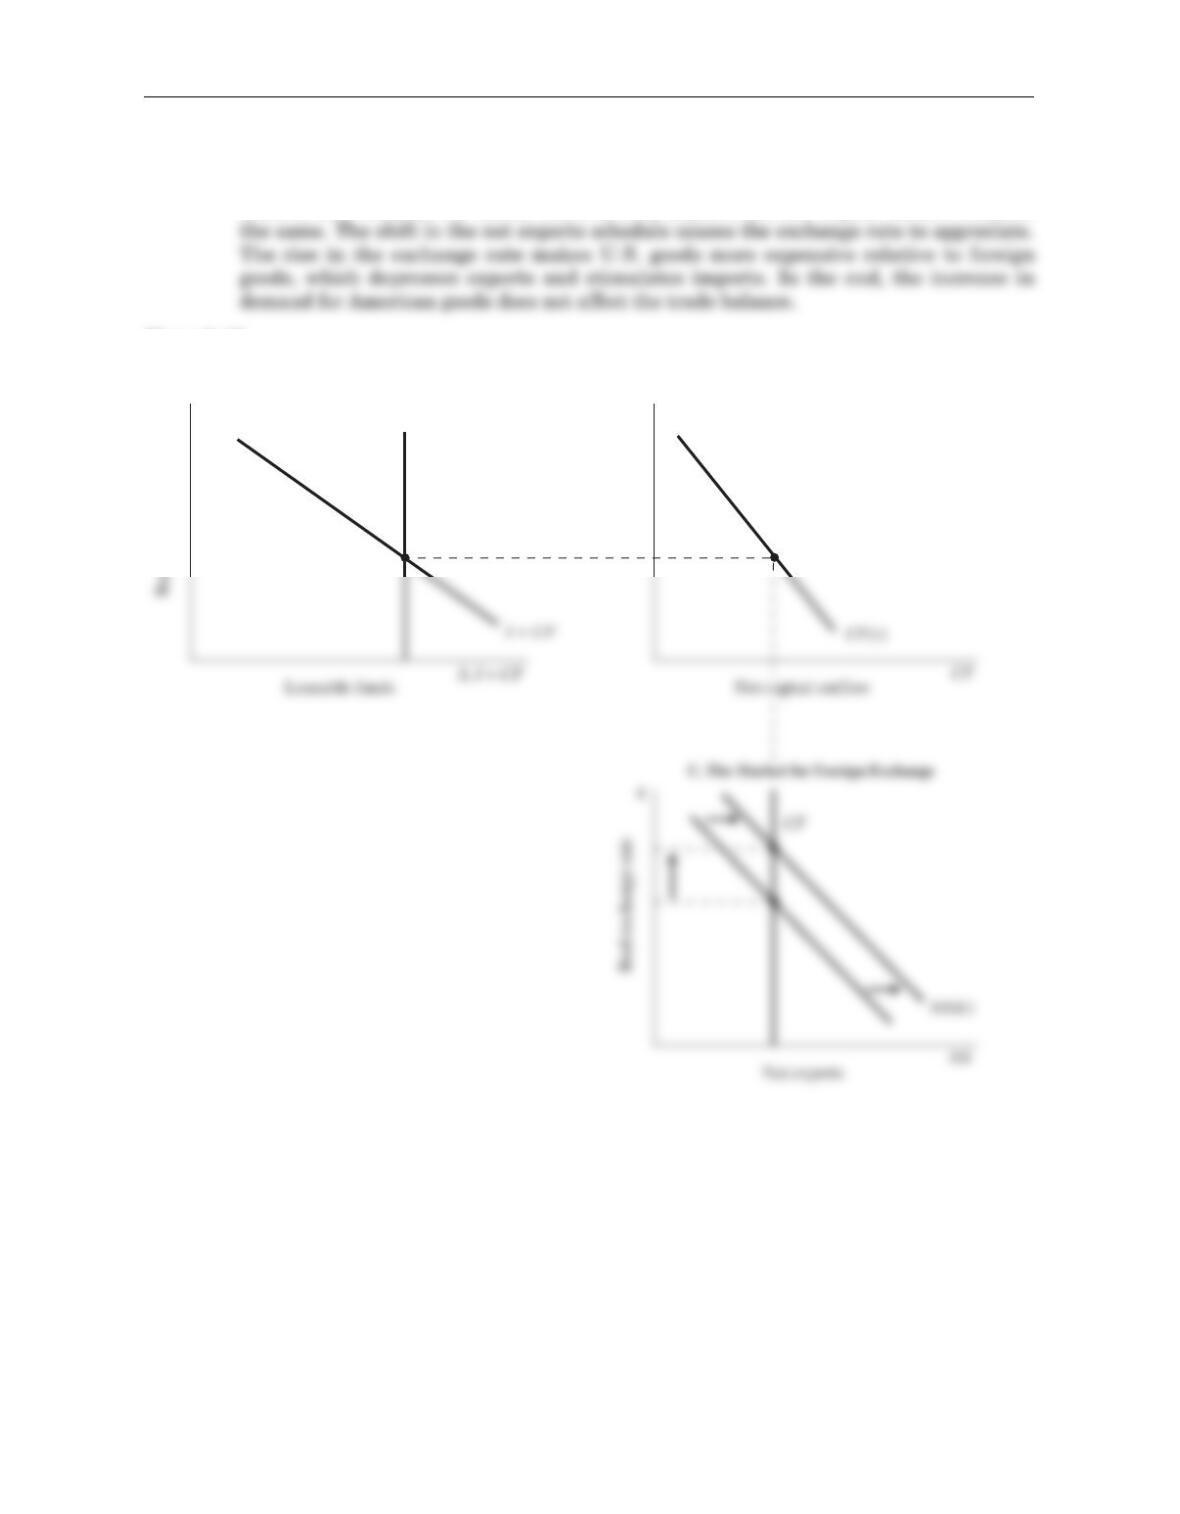
b. As shown in Figure 5–19, the increase in demand for exports shifts the net exports
schedule outward. Since nothing has changed in the market for loanable funds, the
interest rate remains the same, which in turn implies that net capital outflow remains
A. The Market for Loanable Funds B. Net Capital Outflow
S
rr
Figure 5–19
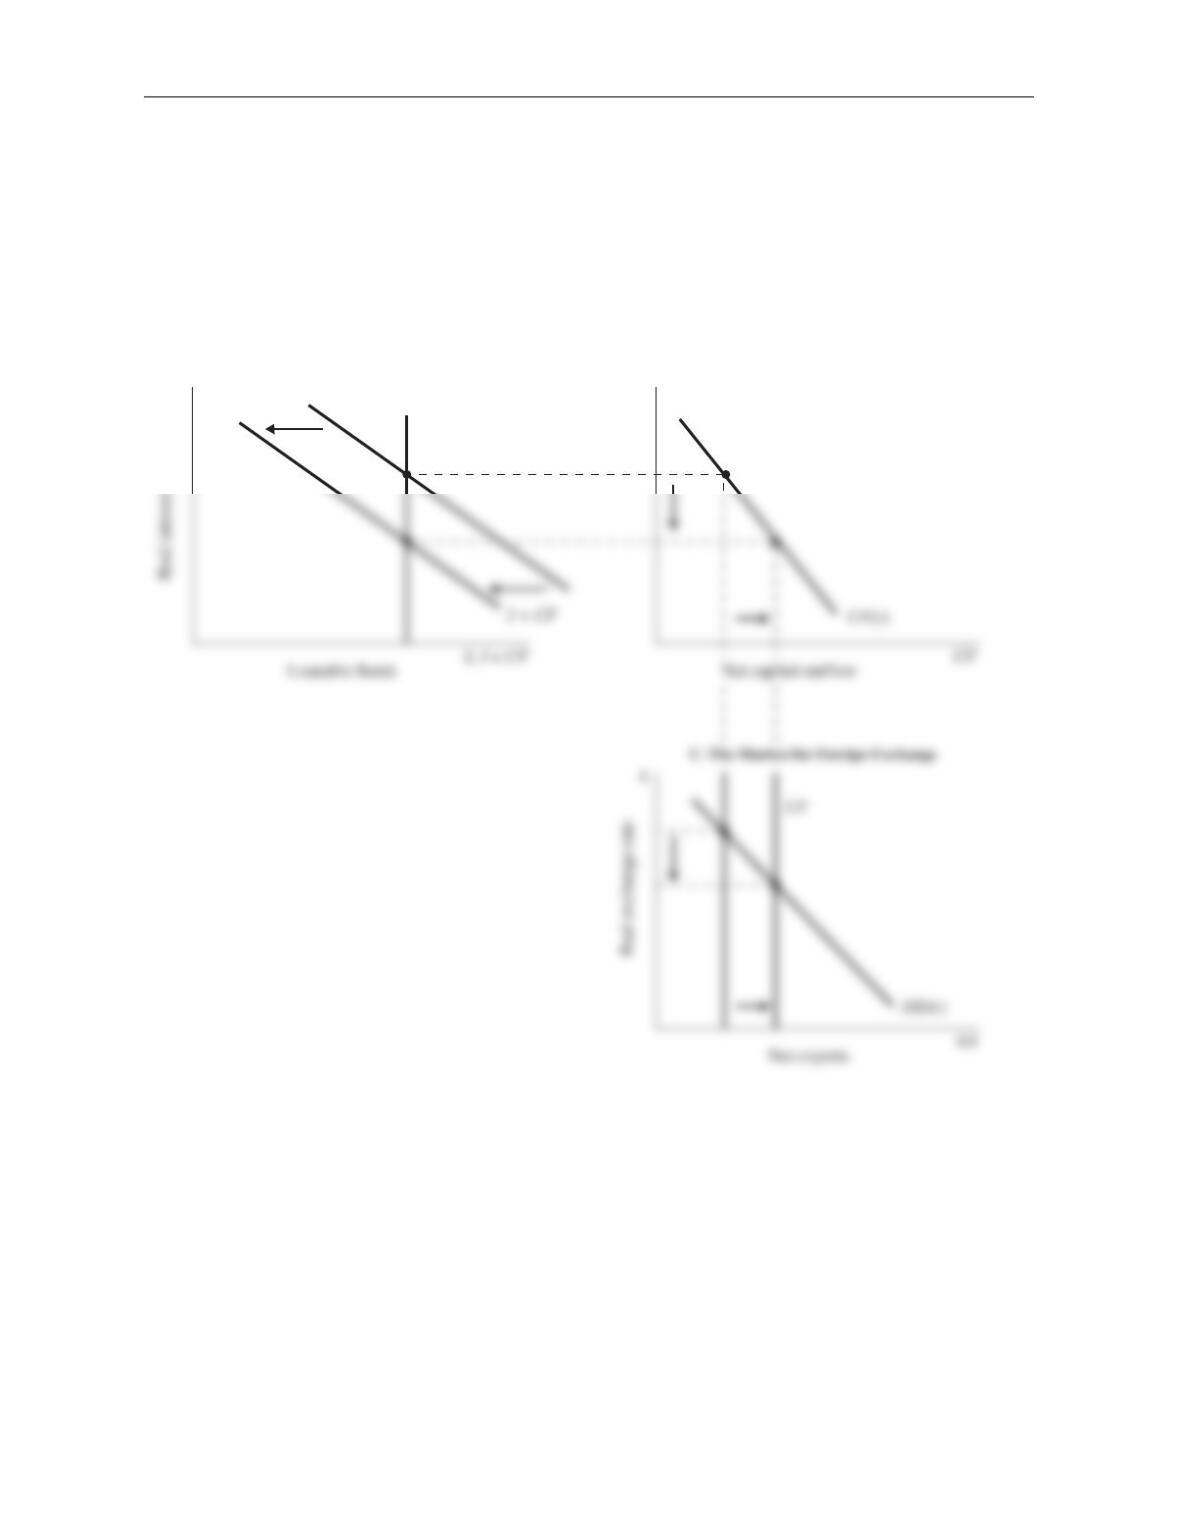
c. As shown in Figure 5–20, the U.S. investment demand schedule shifts inward.
The demand for loans falls, so the equilibrium interest rate falls. The lower inter-
est rate increases net capital outflow. Despite the fall in the interest rate, domes-
tic investment falls; we know this because I+ CF does not change, and CF rises.
The rise in net capital outflow increases the supply of dollars in the market for
foreign exchange. The exchange rate depreciates, and net exports rise.
46 Answers to Textbook Questions and Problems
A. The Market for Loanable Funds B. Net Capital Outflow
S
rr
Figure 5–20
Chapter 5 The Open Economy 47
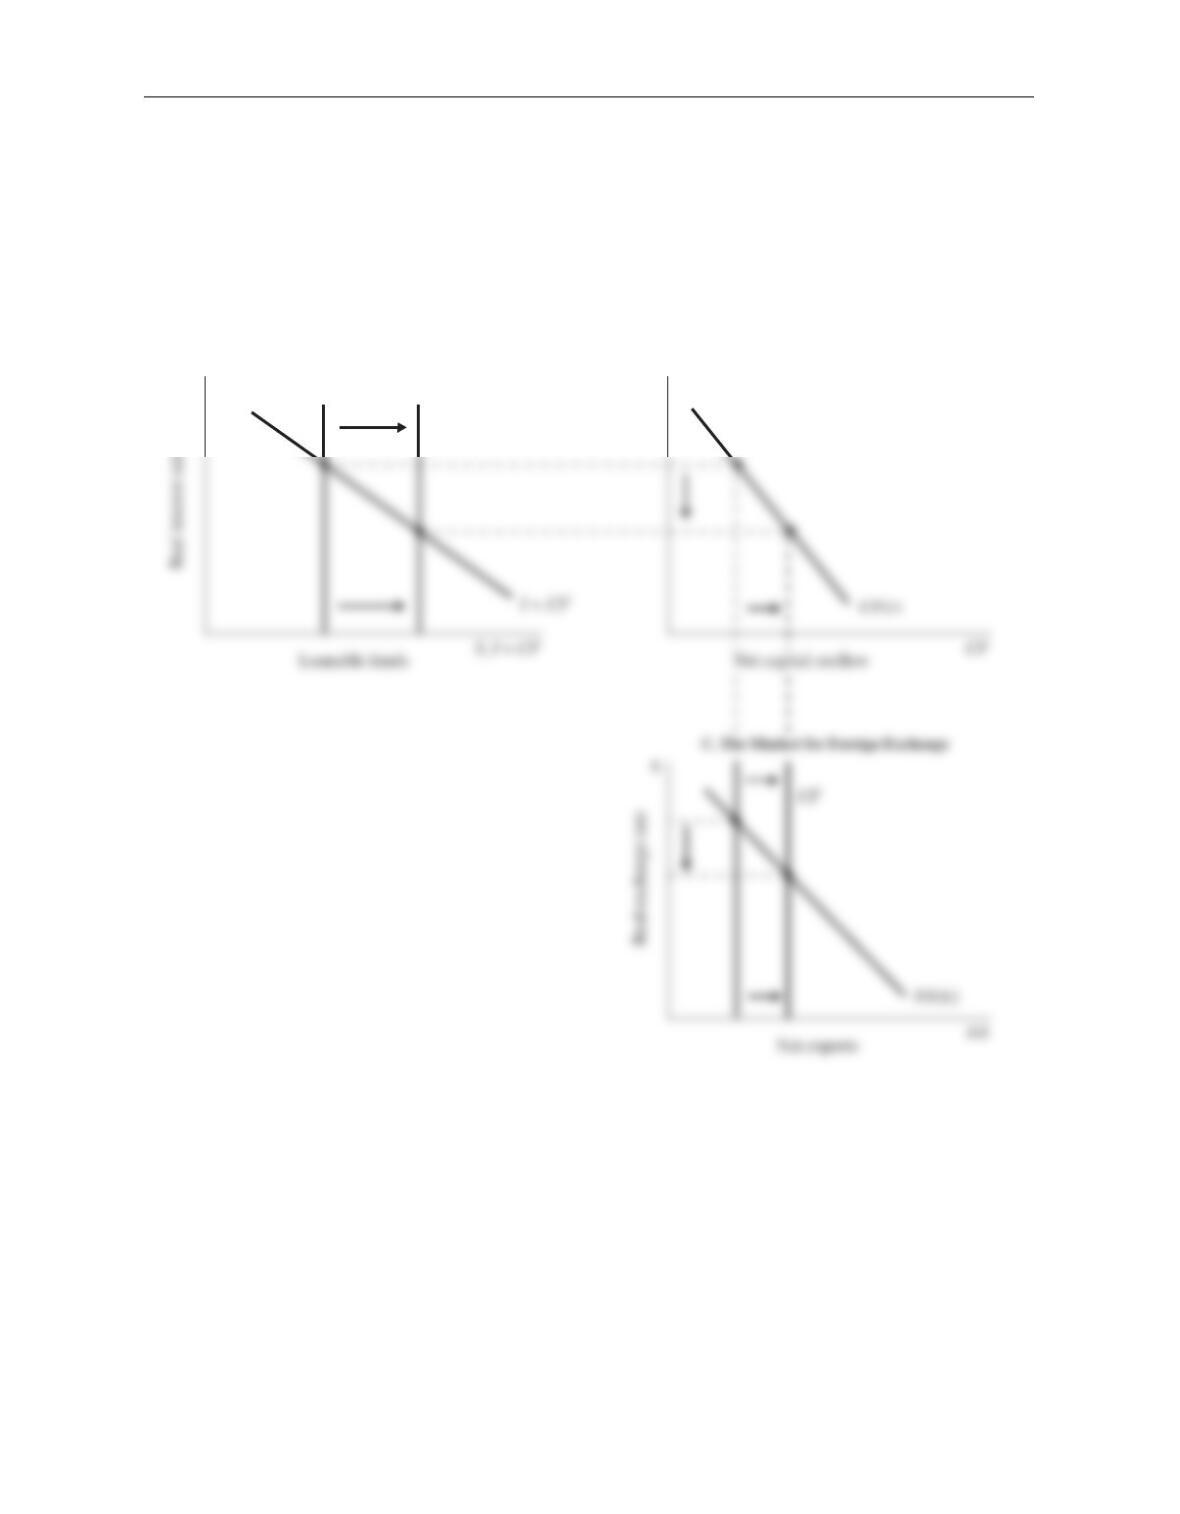
d. As shown in Figure 5–21, the increase in saving increases the supply of loans and
lowers the equilibrium interest rate. This causes both domestic investment and
net capital outflow to rise. The increase in net capital outflow increases the supply
of dollars to be exchanged into foreign currency, so the exchange rate depreciates
and the trade balance rises.
A. The Market for Loanable Funds B. Net Capital Outflow
S
rr
Figure 5–21
e. The reduction in the willingness of Americans to travel abroad reduces imports,
since foreign travel counts as an import. As shown in Figure 5–22, this shifts the
net exports schedule outward. Since nothing has changed in the market for loan-
48 Answers to Textbook Questions and Problems
A. The Market for Loanable Funds B. Net Capital Outflow
S
rr
Figure 5–22
Chapter 5 The Open Economy 49
f. As shown in Figure 5–23, the net capital outflow schedule shifts in. This reduces
demand for loans, so the equilibrium interest rate falls and investment rises. Net
capital outflow falls, despite the fall in the interest rate; we know this because
A. The Market for Loanable Funds B. Net Capital Outflow
S
rr
Figure 5–23
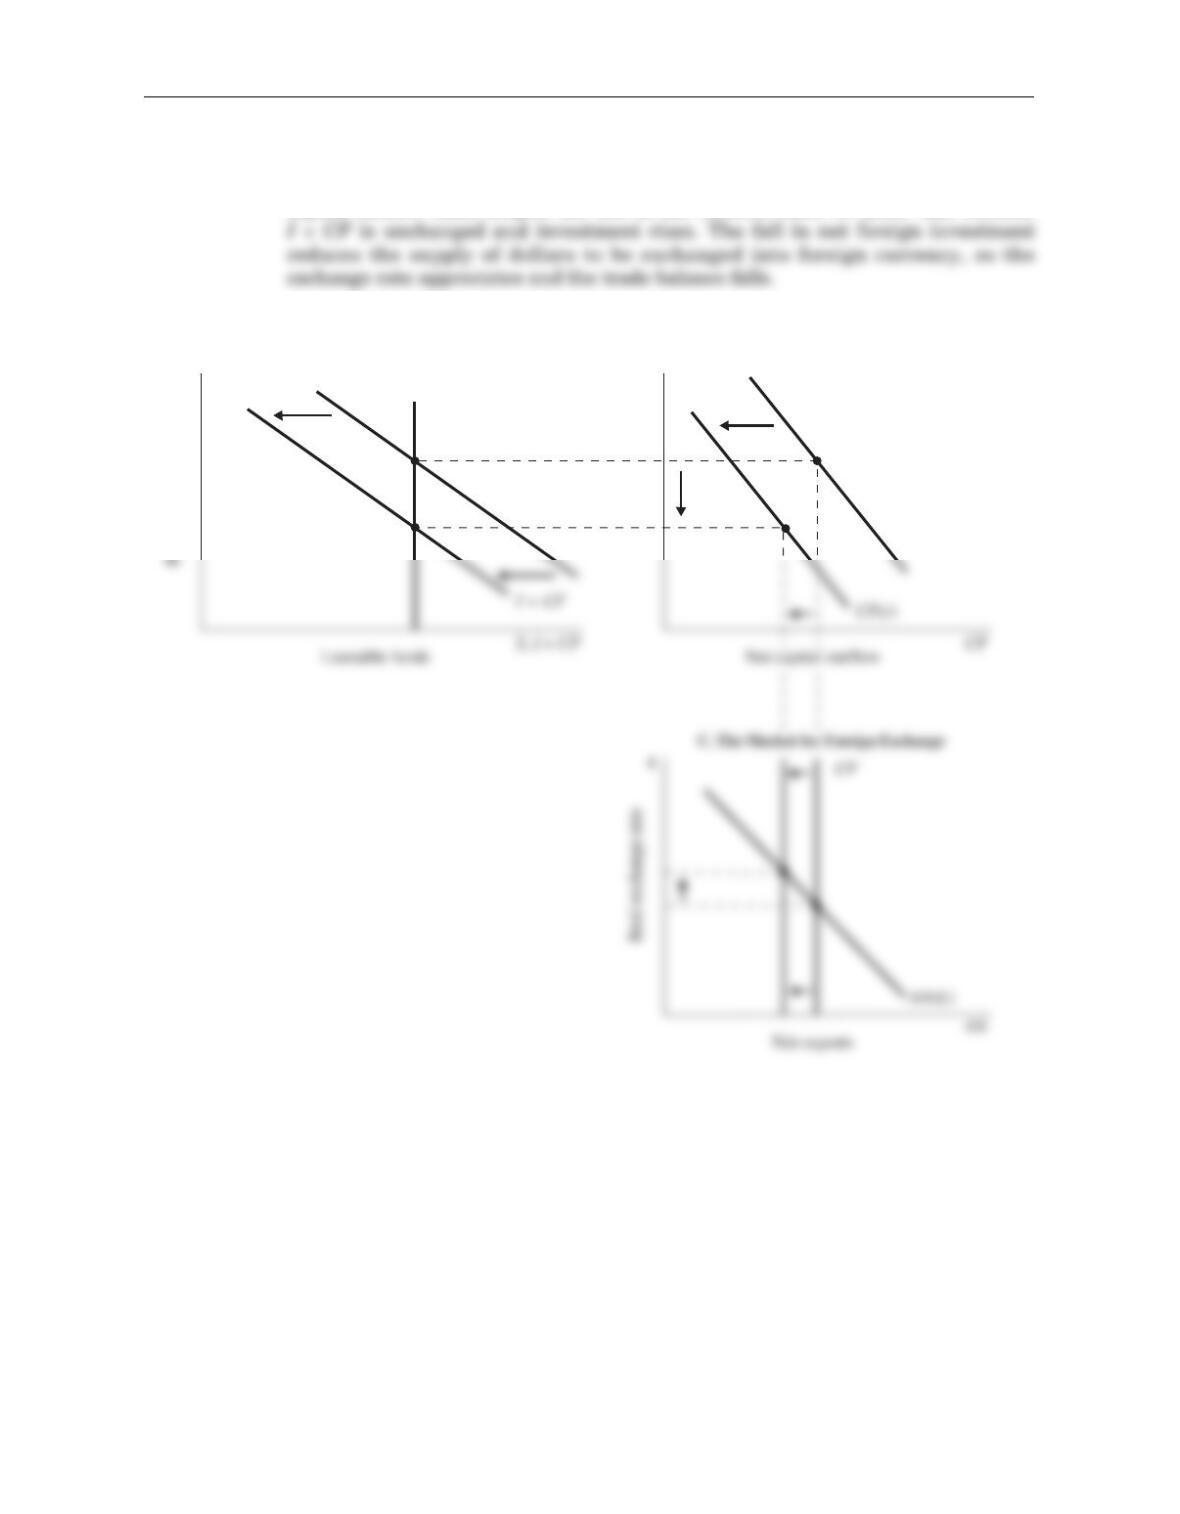
2. Gingrich’s statement has no immediate effect on any of the “fundamentals” in the econ-
omy: consumption, government purchases, taxes, and output are all unchanged.
International investors, however, will be more reluctant to invest in the American econ-
omy, particularly to purchase U.S. government debt, because of the default risk. As
50 Answers to Textbook Questions and Problems
S
Real interest rate
CF (r)
I + CF
r
r
A. The Market for Loanable Funds B. Net Capital Outflow
Figure 5–24