1
2
3
4
5
7
8
11
12
A B C D E F G H I J K L M N O P
05 Chapter model 12/12/2018
FUTURE VALUES (Section 5-2)
Although answers to the Self-Test questions within the chapter are generally quite easy and were found with a
calculator, we also solved some of them with Excel as a check and to provide additional information on the
solutions in case students have questions. The tabs at the lower part of this screen take you to these solutions.
Even if students are not familiar with Excel, they should still be able to see the solution setup and then work out
the answer with a calculator. Although we did not create the model specifically for use in lectures, it could be
This model is STRICTLY OPTIONAL. Neither students nor instructors need to go through it. However, if
someone wants to practice with Excel, then the model can be useful. Also, on the tabs we show solutions for the
within-chapter self-test questions, if applicable.
••The “Main Model” performs the calculations required for Chapter 5, and was used to create many of the
chapter exhibits (Tables and Figures). We pasted in a few dialog boxes for specific Excel functions and features
and show then off to the right of where they apply. However, in general we encourage students who want to
know more about Excel to use the Excel Tutorial and refer to it as necessary. We also let students know that
Excel models can be used to create tables and graphs that can then be copied into Word documents, which is
the way we prepared the text manuscript for submission to the publisher. That procedure is used often in
business to prepare reports.
Chapter 5. The Time Value of Money
Question: You plan to deposit $100 in a bank that pays a guaranteed 5% interest each year. How much would
you have at the end of Year 3?
Note on Excel: You can do calculations in Excel in several different ways. Always start with the pointer on the
cell where you want the answer displayed. Then do one of the following: (1) Enter an equal sign on the formula
bar (which is right after the fx), then write out an equation, like =(1.05)^3*100 to get 1.05 to the 3rd power times
1
13
14
15
16
17
18
24
25
26
27
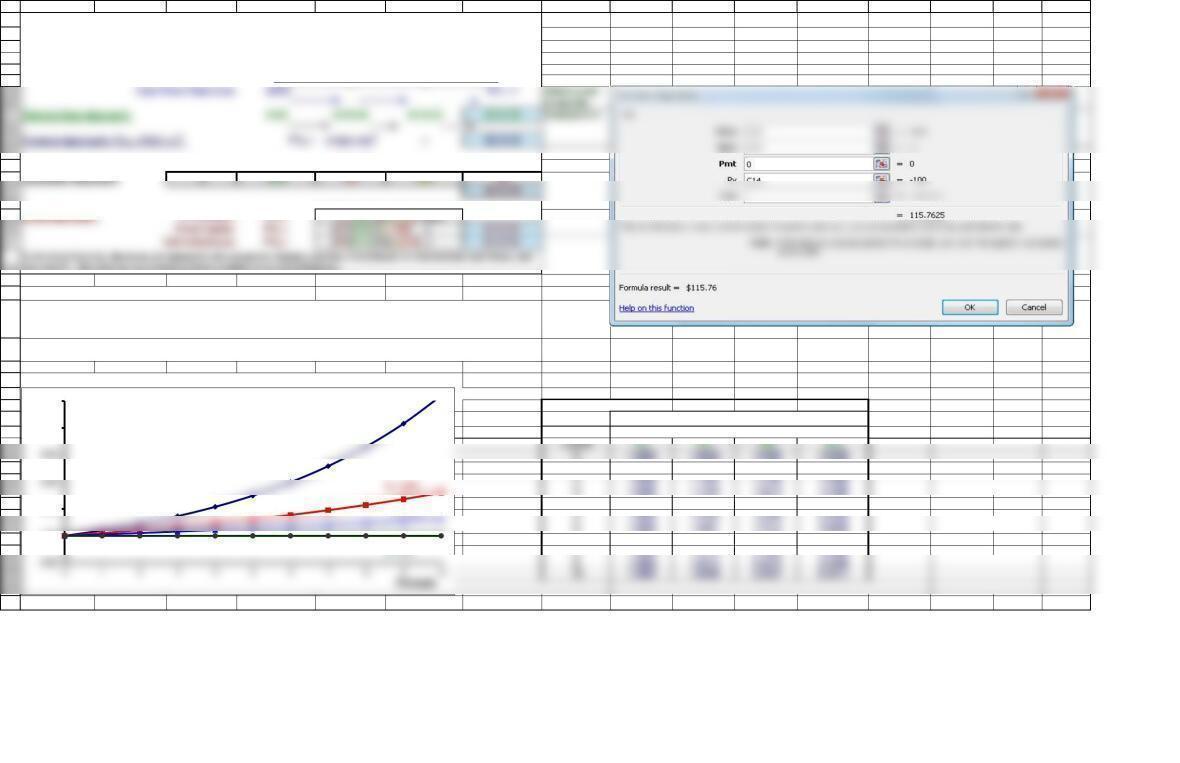
FVN = =FV(0.05,3,0,-100) = $115.76
FVN = =FV(C15,C16,0,C14) = $115.76
28
29
32
33
34
35
36
37
38
39
01.0000 1.0000 1.0000 1.0000
21.0000 1.1025 1.2100 1.4400
31.0000 1.1576 1.3310 1.7280
51.0000 1.2763 1.6105 2.4883
61.0000 1.3401 1.7716 2.9860
54
91.0000 1.5513 2.3579 5.1598
40
41
42
45
48
51
52
57
A B C D E F G H I J K L M N O P
Table 5.1 Summary of Future Value Calculations
Investment = CF0 = PV = -$100.00
Interest rate = I = 5.00%
No. of periods = N = 3
Periods: 0 1 2 3
| | | |
35-$100.00 $0
Excel Approach: FV function:
FVN = =FV(rate,nper,pmt,pv,type)
The Compounding Process: A Graphic View
Data for Figure 5.1
Periods (n)
11.0000 1.0500 1.1000 1.2000
41.0000 1.2155 1.4641 2.0736
71.0000 1.4071 1.9487 3.5832
81.0000 1.4775 2.1436 4.2998
then the PV. The data can be entered as fixed numbers or as cell references.
Interest Factors, FVIFi,n
Interest Rate (i)
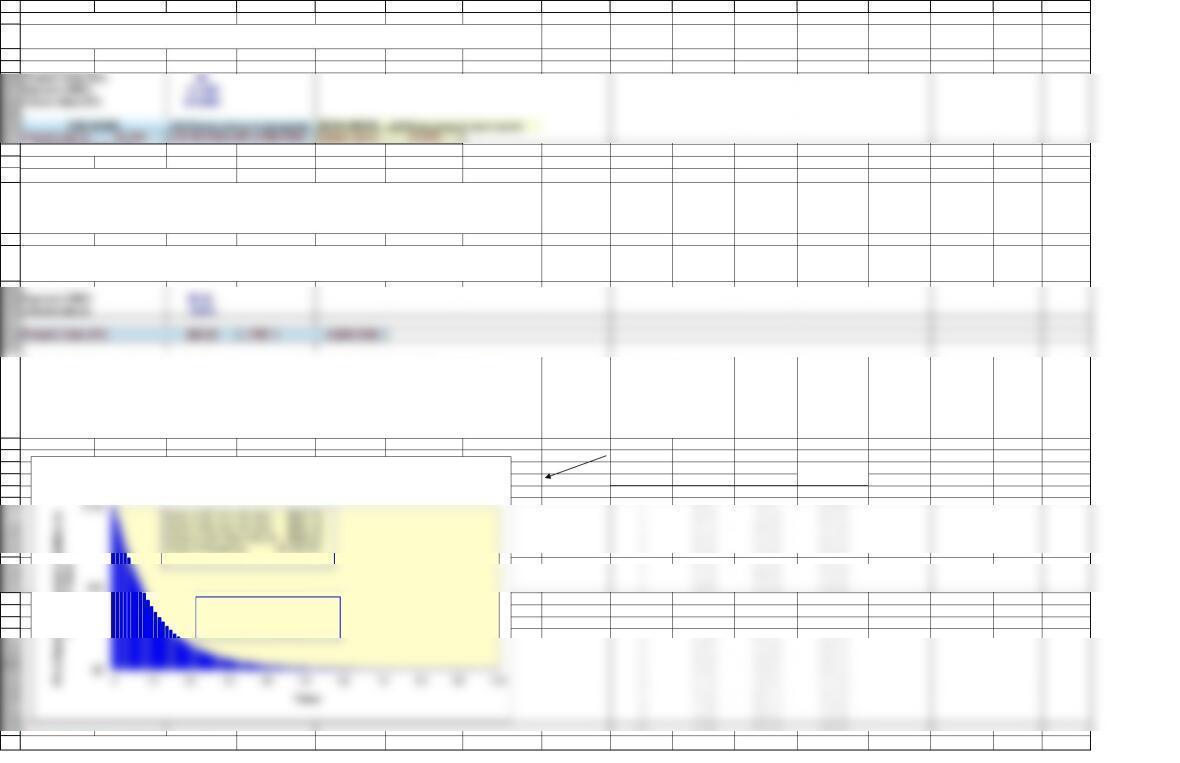
Figure 5.1 (shown below) shows how a $1 investment grows over time at different interest rates. The curves
were created by solving for FV at different values for N and I. This allows you to simultaneously see the effects
of varying time and the interest rate.
The data table used to create this figure is shown to the right. For instruction on data tables and graphs, refer
to the Excel Tutorial.
Figure 5.1 Growth of $1 at Various Interest Rates and Time Periods
1.00
2.00
5.00
6.00
Future Value
of $1
I= 20%
I= 0%
I= 5%
2
19
58
59
60
61
62
63
64
65
66
67
68
69
78
81
82
83
84
85
86
87
88
89
90
15 1.0000 0.4810 0.2394 0.0649
20 1.0000 0.3769 0.1486 0.0261
25 1.0000 0.2953 0.0923 0.0105
35 1.0000 0.1813 0.0356 0.0017
40 1.0000 0.1420 0.0221 0.0007
45 1.0000 0.1113 0.0137 0.0003
91
92
95
99
103
104
105
A B C D E F G H I J K L M N O P
PRESENT VALUES (Section 5-3)
Table 5.2 Summary of Present Value Calculations
Future payment = CFN = FV = $115.76
Interest rate = I = 5.00%
No. of periods = N = 3
Periods: 0 1 2 3
| | | |
Cash Flow Time Line: PV = ? $115.76
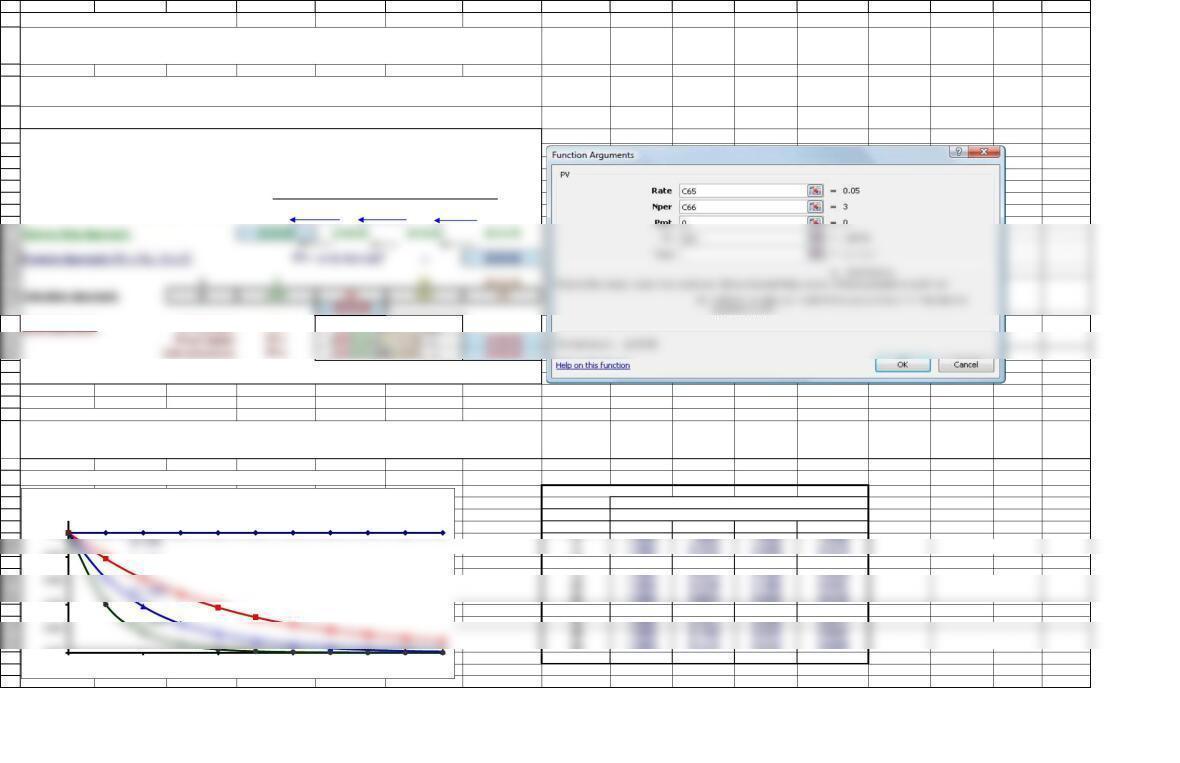
Excel Approach: PV function:
PV = =PV(rate,nper,pmt,fv,type)
The Discounting Process: A Graphic View
Figure 5.2 Present Value of $1 at Various Interest Rates and Time Periods
Data for Figure 5.2
Periods (n)
0.8638 0% 5% 10% 20%
10 1.0000 0.6139 0.3855 0.1615
30 1.0000 0.2314 0.0573 0.0042
50 1.0000 0.0872 0.0085 0.0001
The present value is the opposite of the future value. Instead of compounding a value forward, you discount it
back. If you know the PV, you can compound to find the FV, while if you know the FV, you can discount to find
the PV.
In the Excel formula, 0 indicates that there are no intermediate cash flows.
You must make a payment of $115.76 in 3 years. If a bank pays a guaranteed 5% interest rate each year, how
much would you need to deposit now to have $115.76 in 3 years?
You can work this problem in the same ways that we discussed above.
Figure 5.2 shows how a $1 payment in the future has a lower and lower present value as the interest rate and
time until receipt increase. The data table to the right provides the data used to draw the figure.
Interest Factors, PVIFi,n
Interest Rate (i)
0.00
0.40
0.80
1.00
010 20 30 40 50
Present Value
of $1
Periods
I= 5%
3
106
107
108
109
114
115
116
117
118
Future value (FV) $1,000,000
Interest rate (I) 4.50%
119
120
125
126
127
128
129
130
134
135
136
137
138
141
142
139
149
150
151
155
156
A B C D E F G H I J K L M N O P
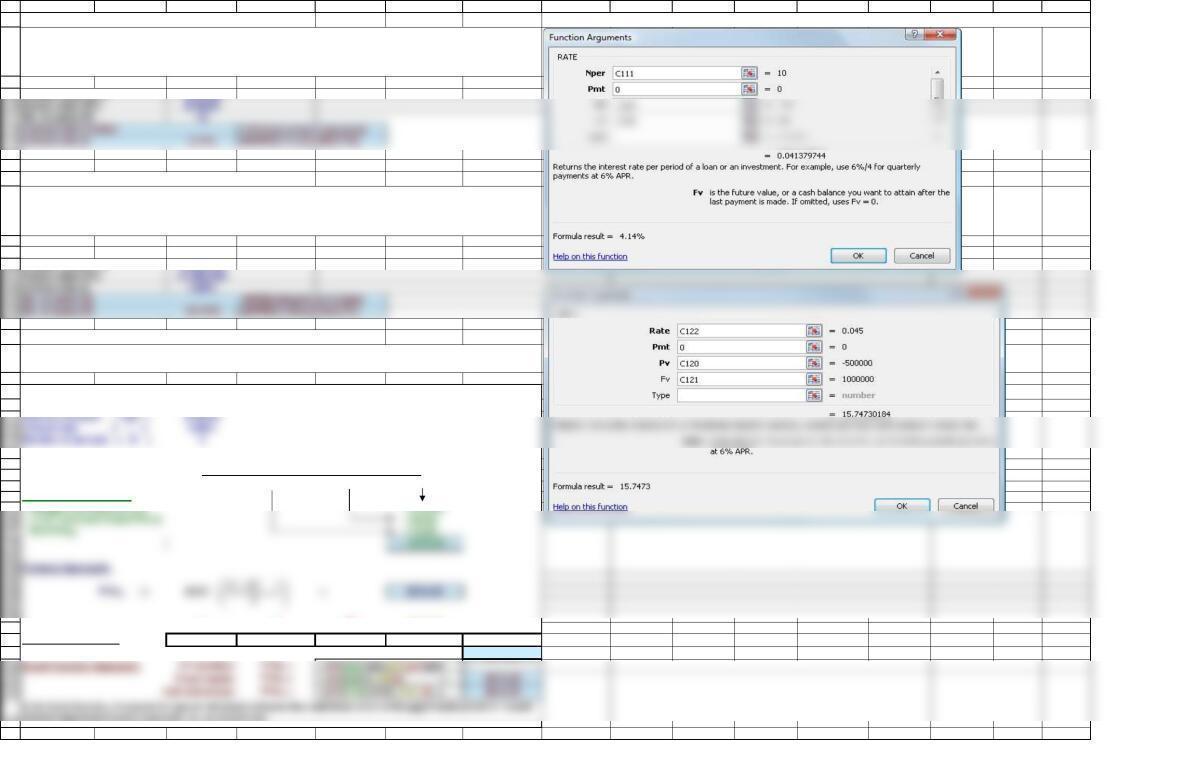
FINDING THE INTEREST RATE, I (Section 5-4) This calculation assumes that the 1st interest payment will come in 1 year. If not true, use Excel’s Yield function.
Present value (PV) -$100.00
FINDING THE NUMBER OF YEARS, N (Section 5-5)
Present value (PV) -$500,000
FUTURE VALUE OF AN ORDINARY ANNUITY (Section 5-7)
Table 5.3 Summary: Future Value of an Ordinary Annuity
Periods: 0 1 2 3
| | | |
Cash Flow Time Line: -$100 -$100 -$100
Step-by-Step Approach:
Multiply each payment by -$100.00
35$0 -$100.00
Calculator Approach: NI/YR PV PMT FV
$315.25
Sometimes we need to know how long it will take to accumulate a given sum of money, given our beginning
funds and the rate we will earn on those funds. For example, suppose we believe that we could retire
comfortably if we had $1 million, and we want to find how long it will take us to reach that goal, assuming that we
now have $500,000 invested at 4.5%.
An ordinary annuity has regular, periodic payments that occur at the end of each period. Methods for solving the
future value of an ordinary annuity are shown below.
Previously, we solved equations to find FV and PV. However, we could just as easily solve for I or N. For
example, suppose we know that a given bond has a cost of $100 and that it will return $150 after 10 years. It
makes no annual payments, so PMT = 0. Thus, we know PV, FV, and N, and we want to find the rate of return we
would earn if we bought the bond.
4
Future value (FV) $150.00
No. of years (N) 10

157
158
159
160
165
166
167
168
169
174
175
176
179
180
181
182
187
188
189
190
191
192
193
194
195
200
202
Interest rate = I = 5.00%
Periods: 0 1 2 3
| | | |
Cash Flow Time Line: -$100 -$100 -$100
196
203
208
209
213
214
A B C D E F G H I J K L M N O P
FUTURE VALUE OF AN ANNUITY DUE (Section 5-8)
Summary: Future Value of an Annuity Due (Diagram Not in Text)
Periods: 0 1 2 3
| | | |
Cash Flow Time Line: -$100 -$100 -$100
Formula Approach:
BEG MODE 350-$100.00
Calculator Approach: NIPV PMT FV
$331.01
PRESENT VALUE OF AN ORDINARY ANNUITY (Section 5-9)
Summary: Present Value of an Ordinary Annuity
Payment amount = PMT = $100.00
Formula Approach:
35-$100.00 0
The present value of an ordinary annuity is the sum of the PVs of the individual cash flows. Methods for solving
the present value of an ordinary annuity are shown below.
An annuity due also has regular, periodic payments, but unlike an ordinary annuity, the payments occur at the
beginning of each period.
In the Excel formula, the 1 at the end of the formula indicates that cash flows occur at the beginning of each period. A 0 or
no entry (blank) would indicate end-of-period payments, i.e., an ordinary annuity.
−
1
1
N
N
5
161
Payment amount = PMT = $100.00
Interest rate = I = 5.00%
Number of periods = N = 3

215
222
A B C D E F G H I J K L M N O P
Calculator Approach: NIPV PMT FV
6
216

223
224
225
226
227
231
232
233
234
235
236
246
240
241
242
247
248
Excel Function Approach:
Interest rate (I) 6%
Present value (PV) $0
Future value (FV) $10,000
252
253
254
255
256
257
258
259
260
261
265
268
269
270
271
272
273
274
275
A B C D E F G H I J K L M N O P
PRESENT VALUE OF AN ANNUITY DUE (Not in Text)
Summary: Present Value of an Annuity Due (Not in text; this is a “bonus”)
Periods: 0 1 2 3
| | | |
Cash Flow Time Line: -$100 -$100 -$100
Step-by-Step Approach: -$100.00
Formula Approach:
Calculator Approach: NIPV PMT FV
$285.94
Excel entries correspond with these calculator keys: I N PMT FV TYPE PV
FINDING ANNUITY PAYMENTS, PERIODS, AND INTEREST RATES (Section 5-10)
FINDING ANNUITY PAYMENTS, PMT
No. of years (N) 5
FINDING THE NUMBER OF PERIODS, N
Interest rate (I) 6%
Present value (PV) $0
The difference between the present value of an ordinary annuity and an annuity due is that payments are
received earlier in an annuity due.
Fundamentally, this section is no different than previous TVM exercises. When solving for PMT, N, or I, you
must be given values for the other variables, and then you solve the problem.
For the preceding question, suppose you decide to make end-of-year deposits, but you can only save $1,200 per
year. Again assuming that you would earn 6%, how long would it take you to reach your $10,000 goal?
Suppose we need to accumulate $10,000 and have it available 5 years from now. Suppose further that we can
earn a return of 6% on our savings, which are currently zero.
Trick question: Notice the problem setup didn’t specify when payments would be made. Therefore, consider
both possibilities (END and BEGIN modes).
Question: The PV of the annuity due is larger than the PV of the ordinary annuity. Why is that? Answer:
Because each of the annuity due’s payments is discounted back one less year.
I)(1
1
1
N
+
−
7
A B C D E F G H I J K L M N O P
8
656.45 435.53 564.25
751.32 486.84 512.93
846.65 533.49 466.28
Payment (PMT) $2.50
Interest rate (I) 10.0%
Present Value (PV) $25.00 = PMT/ I =C299/C300
Present value (PV) $0
Payment (PMT) -$1,200
Future value (FV) $10,000
Interest rate (I) 25.78% =RATE(C285,C287,C286,C288) Interest rate (I) 17.54%
12 31.86 681.37 318.40
13 28.97 710.34 289.44
14 26.33 736.67 263.10
15 23.94 760.61 239.16
16 21.76 782.37 217.40
17 19.78 802.16 197.62
18 17.99 820.14 179.63
19 16.35 836.49 163.28
282
283
284
285
292
293
294
295
296
297
304
305
306
307
308
309
314
318
319
320
329
330
A B C D E F G H I J K L M N O P
FINDING THE INTEREST RATE, I
No. of years (N) 5
Would be tough to do!
PERPETUITIES (Section 5-11)
Annuity PMT 100
Interest Rate 10%
Pmt # PV this PMT Ann Value
0100.00
562.09 379.08 620.69
942.41 575.90 423.87
10 38.55 614.46 385.32
11 35.05 649.51 350.27
20 14.86 851.36 148.42
UNEVEN CASH FLOWS (Section 5-12) 21 13.51 864.87 134.90
Perpetuities are securities that promise to make payments forever. The present value of a perpetuity can be
found with a simple formula: Value = PMT / I . Note that we do not attempt to calculate the future value of a
perpetuity. Because the payments go on forever, the future value would be infinitely large and thus
meaningless.
Consider a preferred stock that pays a $2.50 annual dividend. If we assume that the company will go on
indefinitely, the preferred stock can be valued as a perpetuity. If the discount rate is 10%, what is the value of the
preferred stock?
Contribution to
100yr Ann Value
Now suppose you can only save $1,200 annually, but you still must have $10,000 in only 5 years. What rate of
return would you have to earn to achieve your goal?
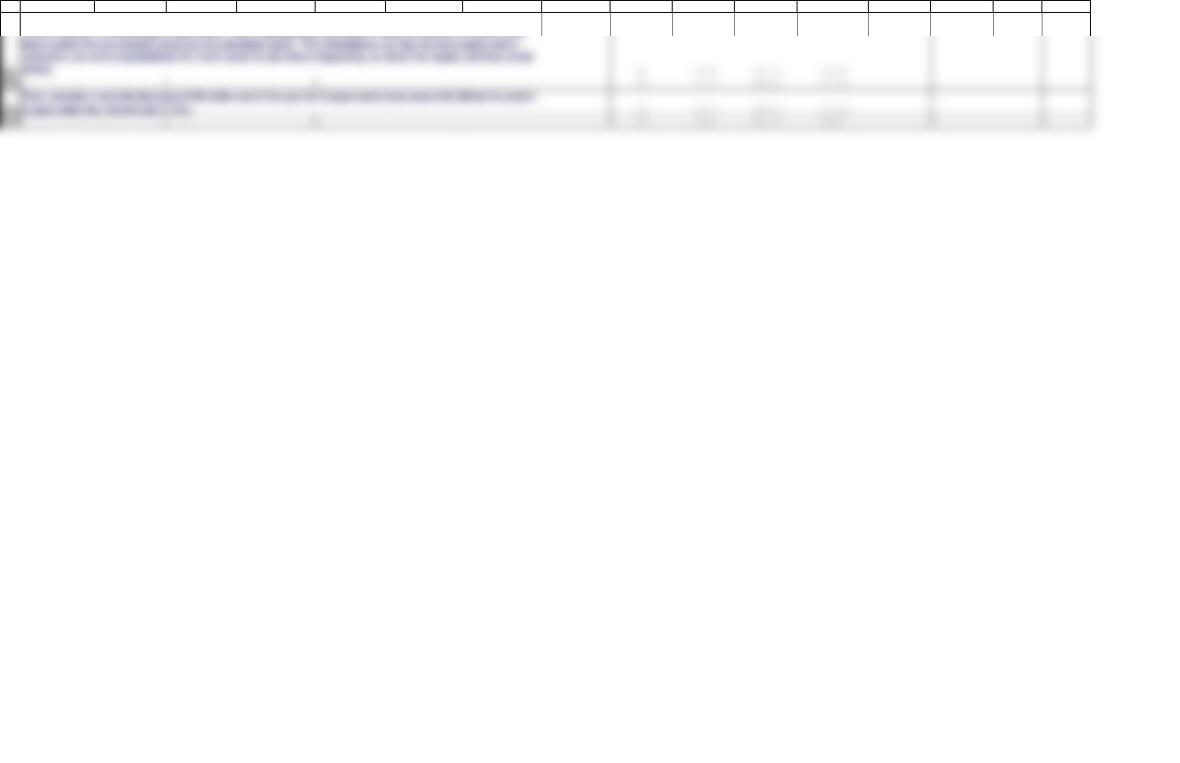
An annuity makes constant payments, those payments are discounted, and the longer before a payment is
received, the smaller its PV. Therefore, adding more payments to the security adds less value for each additional
payment. This helps explain why perpetuities’ present values are finite, while future values are infinite. To see
this better, consider the figure shown below. The data used to construct the graph are shown to the right in
columns I through L. One hundred payments are analyzed and their present values, the total value of an annuity
of N number of years, and the contribution of the Nth payment are all shown in the table off to the right.
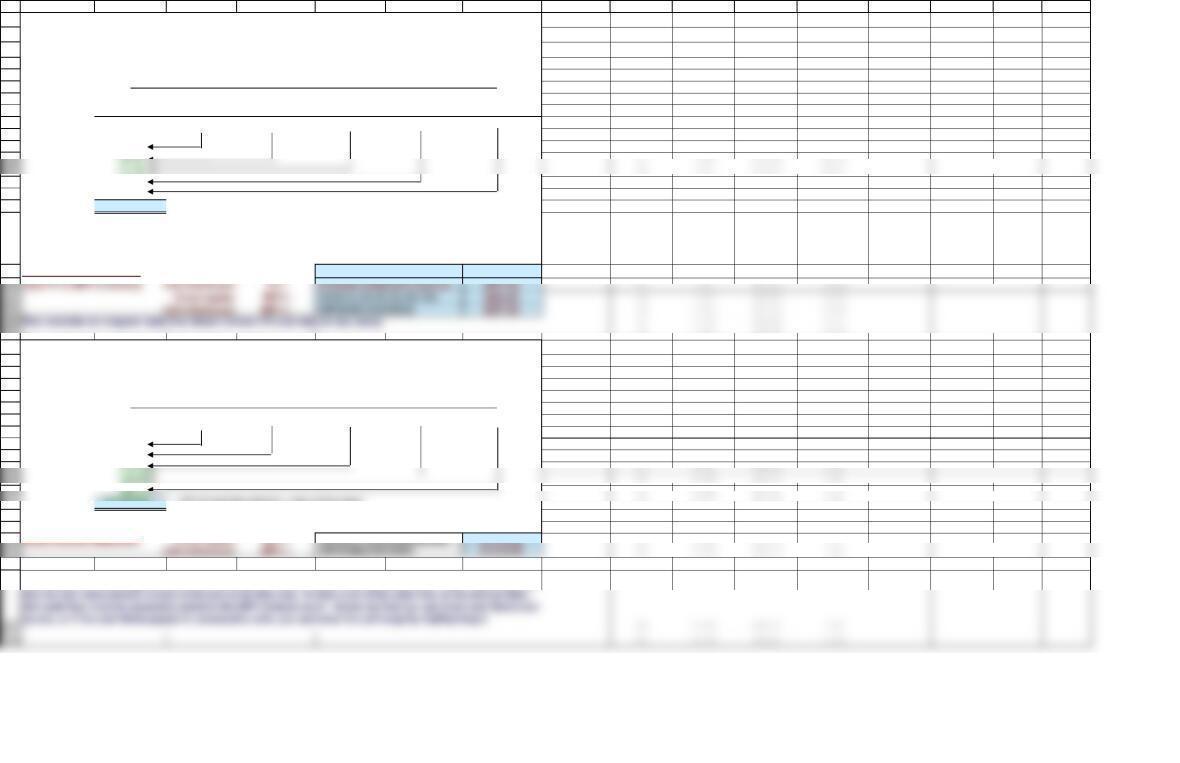
Annuity’s Value
Contribution of Each $100 Payment to the Value of a $100 Annuity
at a 10% Rate
Bars indicate PV of each
payment. Sum of PVs from 0 to
N = Value of the Annuity
9
190.91 90.91 908.86
282.64 173.55 826.22
375.13 248.69 751.09
468.30 316.99 682.79
A B C D E F G H I J K L M N O P
An annuity has constant payments. Although many financial decisions do involve annuities, many others
involve uneven, or nonconstant, cash flows. With a spreadsheet, the present value of a series of uneven cash
10
335
336
337
338
339
340
341
342
343
344
345
348
349
350
213.53 59 0.361 996.39 3.38
190.66 60 0.328 996.72 3.06
PV ==PV(C337,G339,C341,G342,0) $927.90 44 1.51 984.91 14.86
47 1.134 988.66 11.11
283.71 61 0.299 997.01 2.76
351
352
357
358
359
360
361
362
363
364
365
366
367
371
69 0.139 998.61 1.165
372
373
376
A B C D E F G H I J K L M N O P
Summary: Uneven Cash Flow Present Value Calculations (Annuity plus Lump Sum) 26 8.39 916.09 83.68
This is the cash flow pattern for a typical bond. 27 7.63 923.72 76.05
Interest rate (I) = 12% 28 6.93 930.66 69.12
29 6.30 936.96 62.81
Periods: 0 1 2 3 4 5 30 5.73 942.69 57.08
| | | | ||31 5.21 947.90 51.87
Annuity CFs: $0 $100 $100 $100 $100 $100 32 4.74 952.64 47.13
Lump sum CFs:
$1,000 33 4.31 956.94 42.83
Total CFs: $0 $100 $100 $100 $100 $1,100 34 3.91 960.86 38.91
PV of CFs 35 3.56 964.42 35.36
$89.29 36 3.23 967.65 32.12
63.55 39 2.43 975.70 24.08
624.17 40 2.21 977.91 21.87
$927.90 = PV of cash flow stream = value of the asset 41 2.01 979.91 19.86
42 1.83 981.74 18.03
Excel Function Approach:
Fixed inputs:
PV ==PV(0.12,5,-100,-1000) $927.90 43 1.66 983.40 16.37
48 1.031 989.69 10.08
Figure 5.3 PV of an Uneven Cash Flow Stream 49 0.937 990.63 9.14
50 0.852 991.48 8.29
Interest rate (I) = 12% 51 0.774 992.26 7.52
52 0.704 992.96 6.81
Periods: 0 1 2 3 4 5 53 0.640 993.60 6.17
| | | | ||54 0.582 994.18 5.59
CF Time Line: $0 $100 $300 $300 $300 $500 55 0.529 994.71 5.06
PV of CFs 56 0.481 995.19 4.58
$89.29 57 0.437 995.63 4.14
239.16 58 0.397 996.03 3.75
$1,016.35 = PV of cash flow stream = value of the asset 62 0.271 997.29 2.49
63 0.247 997.53 2.24
64 0.224 997.76 2.02
67 0.169 998.31 1.46
The NPV Excel formula ignores the initial cash flow (in Year 0). When entering a cash flow range, Excel assumes
The time line shows what’s happening with a step-by-step solution. To actually work the problem with a
calculator, use the cash flow register. With Excel, use the NPV function. Could use the NPV dialog box.
Alternatively, type, just to the right of the fx, =NPV( see the formula, and make the cell entries by clicking on
them. This also works for the PV or any other function.
11
79.72 37 2.94 970.59 29.18
71.18 38 2.67 973.27 26.51
379
380
381
382
383
384
385
386
387
388
389
394
395
96 0.011 999.89 -0.121
396
397
400
401
402
403
406
407
408
409
410
411
412
413
417
418
419
420
421
422
423
A B C D E F G H I J K L M N O P
FUTURE VALUE OF AN UNEVEN CASH FLOW STREAM (Section 5-13) 70 0.127 998.73 1.038
71 0.115 998.85 0.923
72 0.105 998.95 0.819
Figure 5.4 FV of an Uneven Cash Flow Stream 73 0.095 999.05 0.724
74 0.086 999.14 0.637
Interest rate (I) = 12% 75 0.079 999.21 0.558
76 0.071 999.29 0.487
Periods: 0 1 2 3 4 5 77 0.065 999.35 0.422
| | | | ||78 0.059 999.41 0.363
CF Time Line: $0 $100 $300 $300 $300 $500 79 0.054 999.46 0.309
$500.00 80 0.049 999.51 0.260
0.00 85 0.030 999.70 0.075
= FV of cash flow stream $1,791.15 86 0.028 999.72 0.048
87 0.025 999.75 0.023
88 0.023 999.77 0.000
91 0.017 999.83 -0.057
92 0.016 999.84 -0.072
93 0.014 999.86 -0.086
SOLVING FOR I WITH UNEVEN CASH FLOWS (Section 5-14) 94 0.013 999.87 -0.099
Finding the Interest Rate, Annuity Plus Lump Sum (A Typical Bond) 97 0.010 999.90 -0.131
98 0.009 999.91 -0.140
Annuity pmts $100 99 0.008 999.92 -0.148
Future lump sum
$1,000 100 0.007 999.93 -0.155
Periods: 0 1 2 3 4 5
| | | | ||
CF Time Line: -$927.90 $100 $100 $100 $100 $1,100
Finding the Interest Rate of an Uneven Cash Flow Stream with a Cost of $1,000
Periods: 0 1 2 3 4 5
| | | | ||
CF Time Line: -$1,000 $100 $300 $300 $300 $500
To use the Rate function, we need an annuity or an annuity with a lump sum. The IRR function can be used for
any set of uneven cash flows, provided the first one is negative. (You need an investment to find the rate of
return on the investment.) See the next example, where the IRR approach is required.
Assume that an investment with the following positive cash flows has a cost of $927.90. Find the rate of return
We find the future value of uneven cash flow streams by compounding rather than discounting. The step-by-
step approach works the same as for PVs, but unfortunately, Excel does not have a net future value (NFV)
function. One way around this is to solve for the NPV and then find the FV of this amount by compounding it to
the end of the cash flow stream.
The FV result using the Excel formulas is a negative number. This is because we used Excel’s FV function and
entered the NPV as a positive value as the PV. Put a minus sign in just after the equal sign to make the answer
positive.
Excel Function Approach: (Some versions of Excel do not have a NFV function, requiring the
procedure shown here.)
12
427
428
429
430
431
432
439
440
441
442
443
444
445
446
452
453
454
455
462
463
464
465
466
467
468
469
475
A B C D E F G H I J K L M N O P
SEMIANNUAL AND OTHER COMPOUNDING PERIODS (Section 5-15)
Periods/Year 1 2
N10 20 = 2 × 10
N40 N120 N3650
I1.25% I0.417% I0.0137%
N10 N20
COMPARING INTEREST RATES (Section 5-16)
The future value under semiannual compounding, $163.86, exceeds the FV under annual compounding, $162.89,
because interest starts accruing sooner and thus produces more interest on interest.
This can be further illustrated by considering the example of quarterly, monthly, and daily compounding.
Using the Excel function, if the nominal rate is 10% with semiannual compounding, the effective annual rate is:
SEMIANNUAL
Assume that you deposit $100 in an account that pays 5% and leave it there for 10 years. Here’s what would
happen under annual and semiannual compounding. Notice that with semiannual compounding, there are twice
as many periods, but the periodic interest rate is half the nominal rate.
ANNUAL COMPOUNDING
SEMIANNUAL COMPOUNDING
QUARTERLY
MONTHLY
DAILY
Different compounding periods are used for different types of investments. If we compare investments or loans
with different compounding periods, we need to put them on a common basis. Excel has a function that solves
for the effective annual rate by using the following formula:
Just as more frequent compounding increases the future value of a lump sum, it also decreases the present
value of a lump sum. Consider the example of $100 to be received 10 years from now, with annual versus
semiannual compounding and a 10% interest rate.
ANNUAL
1 –
M
I
1 (EFF%) rate annual Effective
M
NO M
+=
13
Table 5.4 Loan Amortization Schedule, $100,000 at 6% for 5 Years
3$63,456.34 $23,739.64 $3,807.38 $19,932.26 $43,524.08
4$43,524.08 $23,739.64 $2,611.44 $21,128.20 $22,395.89
5$22,395.89 $23,739.64 $1,343.75 $22,395.89 $0.00
476
477
478
479
480
491
492
493
494
495
496
497
498
499
500
501
507
508
509
510
511
512
513
514
515
516
521
522
A B C D E F G H I J K L M N O P
FRACTIONAL TIME PERIODS (Section 5-17 )
Amount borrowed $100
Days in year 365
Nominal interest rate 10.00%
AMORTIZED LOANS (Section 5-18)
N5
I6%
PV $100,000
Amount borrowed: $100,000
Years: 5
Rate: 6%
PMT: -$23,739.64
Beginning
Repayment of
Ending Balance
Amount Payment InterestaPrincipalbBalance
Year (1) (2) (3) (4) (5)
1$100,000.00 $23,739.64 $6,000.00 $17,739.64 $82,260.36
2$82,260.36 $23,739.64 $4,935.62 $18,804.02 $63,456.34
Table 5.4 (shown below) illustrates the amortization process. A homeowner borrows $100,000 on a mortgage
loan, and the loan is to be repaid in 5 equal payments at the end of each of the next 5 years. The lender charges
6% on the balance at the beginning of each year.
b Repayment of principal is equal to the payment of $23,739.64 minus the interest charge for the year.
Bank loans are often for fractional periods. Say you borrow $100 on January 2, 2019 and plan to repay the loan
on October 3, 2019. The loan has a rate of 10% and is based on a 365-day year. Interest is earned (charged) on a
daily basis, and is compounded. How much will you have to pay when the loan matures? Assume (a) simple
interest and (b) compound interest.
forth.
First, we solve for the required payment, then we construct an amortization table.
If a loan is to be repaid in equal amounts on a monthly, quarterly, or annual basis it is said to be an amortized
loan.
14
Rate per day. Fraction, not % 0.000273973 =C480/C479
Number of days: 274
Simple interest, cost per day: $0.02740 =C478*C481
Total interest: $7.51 =C484*C482
Ending amount: $107.51 =C478+C485
Rate per day: 0.000273973 =C481
1
2
3
4
5
6
15
16
PMT $0 FV = $150.00
10
11
12
13
17
18
19
20
21
22
23
3b. How would your answer change if the interest rate were 5%, or 6%, or 20%?
24
32
33
34
35
36
37
PMT $0 FV ($M) = $215.89
43
44
I5%
PMT $0 FV = $131.50
38
39
40
41
45
A B C D E F G H
SECTION 5-2 12/12/2018
SOLUTIONS TO SELF-TEST QUESTIONS
N5
N5Annual interest $10.00
N3
I4%
PV $2,000
PMT $0 FV = $2,249.73
N10
I8%
N100
4. A company’s sales in 2019 were $100 million. If sales grow at 8%, what will they be 10
years later, in 2029?
5a. How much would $1, growing at 5% per year, be worth after 100 years?
2a. What would the future value of $100 be after 5 years at 10% compound interest?
2b. At 10% simple interest?
3a. Suppose you currently have $2,000 and plan to purchase a 3-year certificate of deposit
(CD) that pays 4% interest compounded annually. How much will you have when the CD
matures?
15
46
47
48
N100
5b. What would FV be if the growth rate were 10%?
PMT $0 FV = $161.05 =FV(B7,B6,B9,-B8)

1
2
3
4
5
6
7
I4%
10
11
12
13
I6%
17
18
19
20
24
25
26
27
28
N100
31
32
33
A B C D E F G H
SECTION 5-3 12/12/2018
SOLUTIONS TO SELF-TEST QUESTIONS
N3
I4%
N5
N5
N100
I5%
4b. If the discount rate was 20%?
3a. Suppose a U.S. government bond promises to pay $2,249.73 three years from now. If the
going interest rate on 3-year government bonds is 4%, how much is the bond worth today?
3b. How would your answer change if the bond matured in 5 rather than 3 years?
3c. What if the interest rate on the 5-year bond was 6% rather than 4%?
4a. How much would $1,000,000 due in 100 years be worth today if the discount rate was 5%?
17

1
2
3
4
5
6
10
11
12
13
14
PMT $0
18
19
20
PMT $0
24
25
26
27
PMT $0
31
32
33
34
A B C D E F G H
SECTION 5.4 12/12/2018
SOLUTIONS TO SELF-TEST QUESTIONS
N10
N10
PMT $0
N10
N10
N10
2b. If EPS in 2017 had been $2.40 rather than $3.08, what would the growth rate have been?
1a. The U.S. Treasury offers to sell you a bond for $585.43. No payments will be made until the
bond matures 10 years from now, at which time it will be redeemed for $1,000. What interest rate
would you earn if you bought this bond for $585.43?
1b. What rate would you earn if you could buy the bond for $550?
1c. For $600?
2a. Microsoft earned $1.42 per share in 2007. Ten years later, in 2017, it earned $3.08. What was
the growth rate in Microsoft’s earnings per share (EPS) over the 10-year period?
18
PMT $0

1
2
3
4
5
6
10
11
12
13
17
18
19
20
A B C D E F G H
SECTION 5-5 12/12/2018
SOLUTIONS TO SELF-TEST QUESTIONS
I6%
I10%
I8.05%
1a. How long would it take $1,000 to double if it were invested in a bank that pays 6% per year?
1b. How long would it take if the rate was 10%?
2a. Microsoft’s 2017 earnings per share were $3.08, and its growth rate during the prior 10 years was
8.05% per year. If that growth rate was maintained, how long would it take for Microsoft’s EPS to
double?
19
1
2
3
4
5
10
11
12
13
14
15
16
PV $0 Val of Pmt $100.00 =FV(B14,F14,,B15)
17
18
19
20
21
22
23
29
30
34
35
N5
I6%
PMT -$2,500
PV $0 FV $14,092.73 =FV(B28,B27,B29,-B30)
N5
I3%
PMT -$2,500
PV $0
24
25
26
A B C D E F G H
SECTION 5-7 12/12/2018
SOLUTIONS TO SELF-TEST QUESTIONS
N5
I10% Years of interest 0
N5
I4%
PMT -$2,500
PV $0 FV $13,540.81 =FV(B21,B20,B22,-B23)
1a. For an ordinary annuity with 5 annual payments of $100 and a 10% interest rate, how many
years will the 1st payment earn interest, and what will this payment’s value be at the end?
1b. Answer this same question for the 5th payment.
2a. Assume that you plan to buy a condo 5 years from now, and you estimate that you can save
$2,500 per year. You plan to deposit the money in a bank that pays 4% interest, and you will make
the first deposit at the end of the year. How much will you have after 5 years?
2b. How will your answer change if the interest rate is increased to 6%, or lowered to 3%?
20
N5
I10% Years of interest 4
PV $0 Val of Pmt $146.41 =FV(B7,F7,,B8)