
41
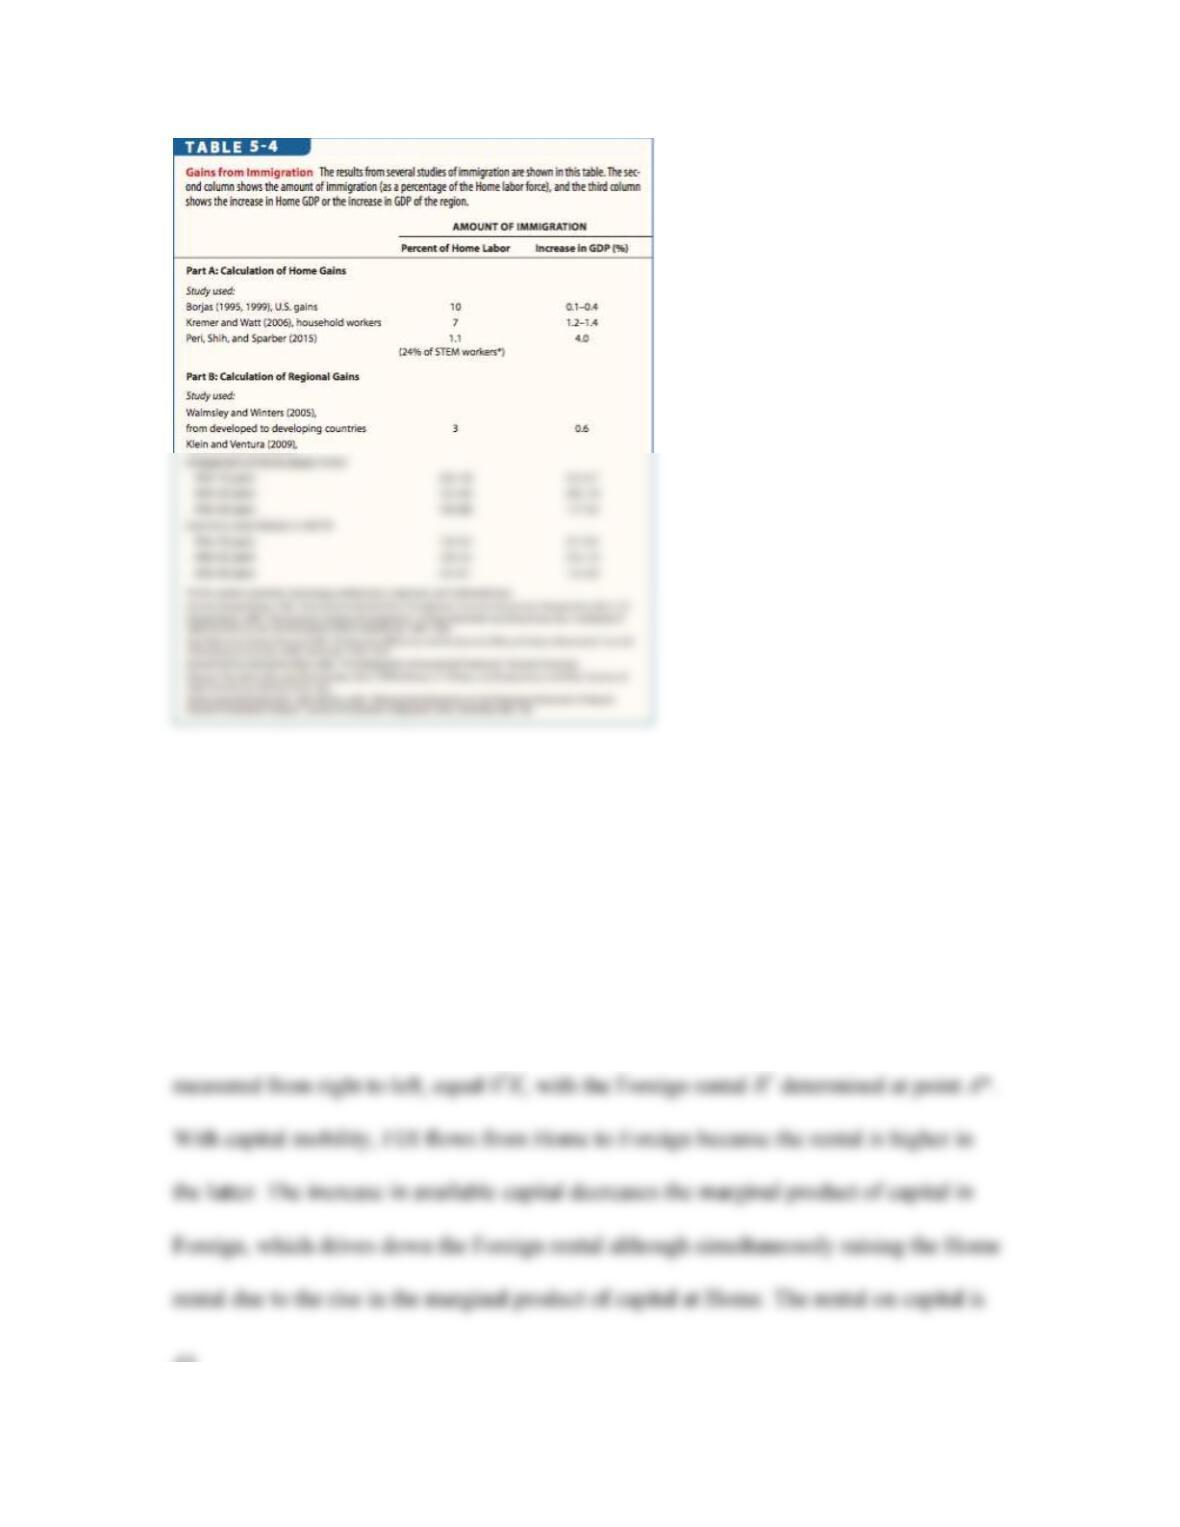
World Gains from Migration The sum of triangles ABC and A*BC representing Home
and Foreign gains, respectively, gives the larger triangle A*AB, which denotes the
increase in the world gross domestic product (GDP) due to immigration. For example,
when the first migrant leaves Foreign for Home, the GDP in the former country falls by
W*, whereas that in the latter increases by W. The gain in world welfare due to the
movement of the first migrant is equal to the difference between the Home and Foreign
wages.
APPLICATION
Gains from Migration
It is estimated that the net gain due to immigration is about 0.1% of GDP, where the
migrants are assumed to make up approximately 10% of the U.S. workforce and compete
for domestic jobs. The 0.1% net GDP gain translates into an estimate of 2% gains for
capital and 1.9% loss for domestic labor. The relatively small size in GDP gain compared
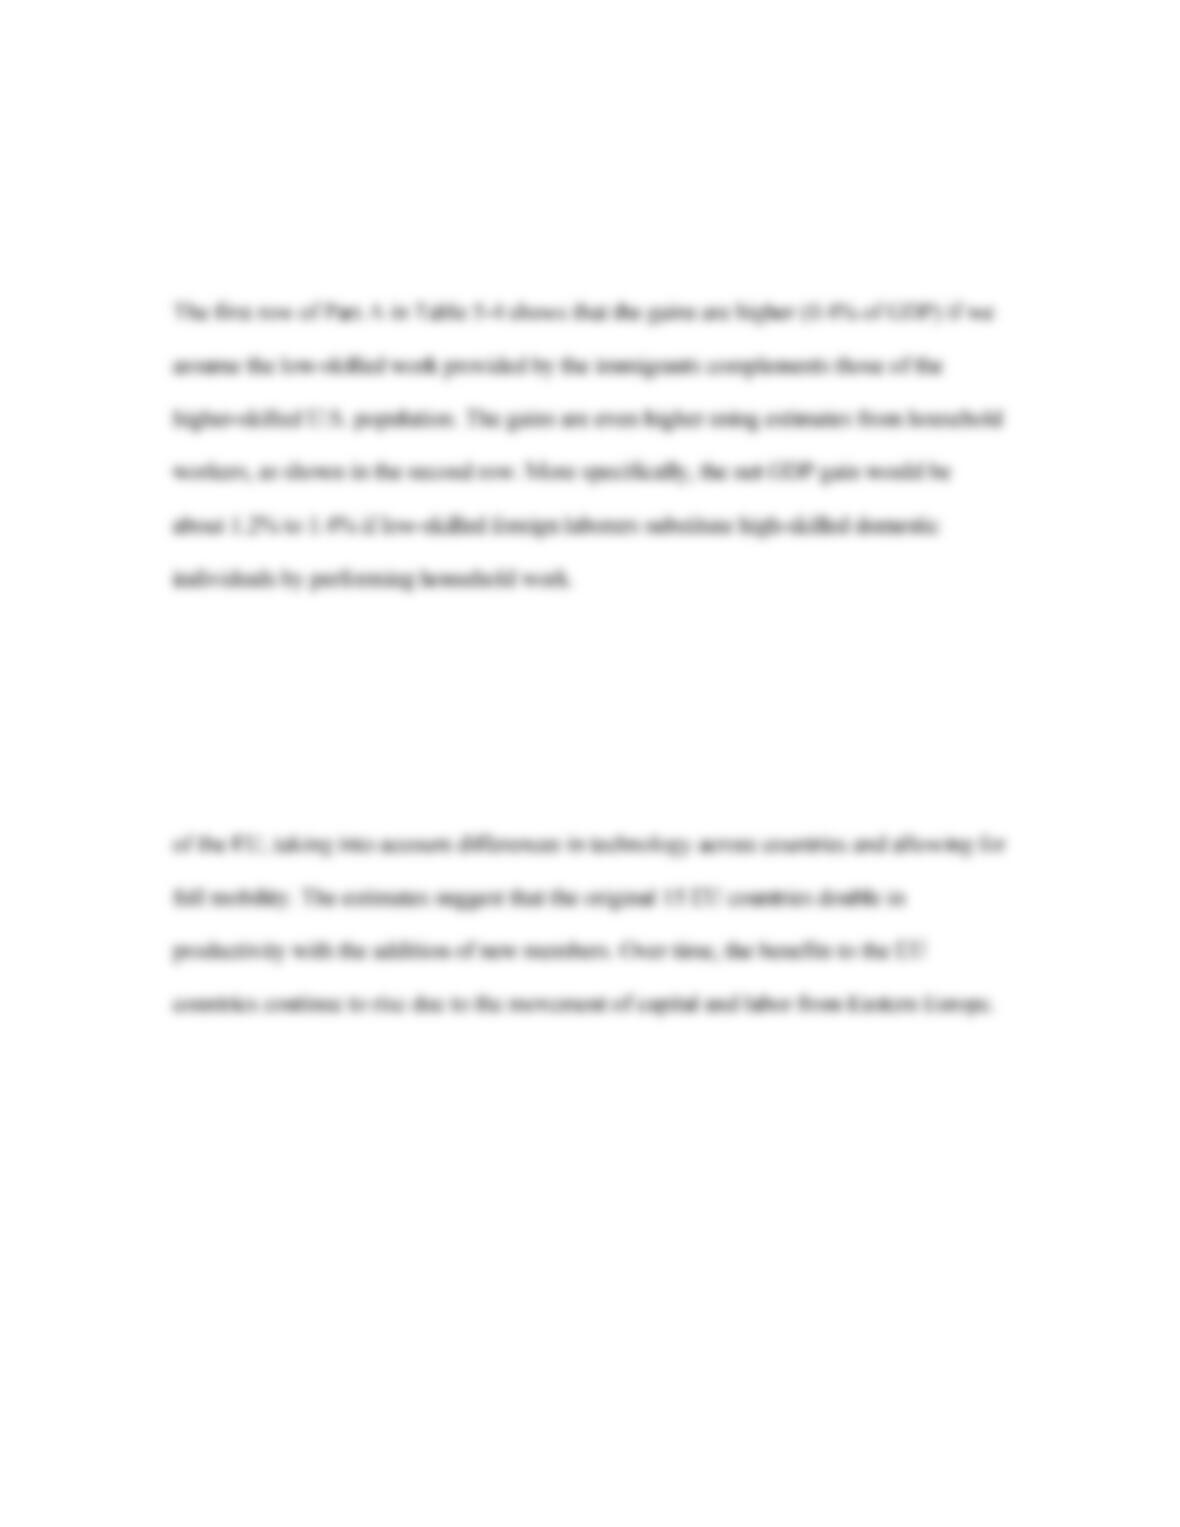
42
with the transfer of income from labor to capital helps to explain the focus on potential
harm to labor instead of overall increases in welfare in debates over immigration policies.
The estimated worldwide gains due to immigration are shown in Part B. The result in the
first row indicates that a 3% flow of workers from developing to developed countries
increase world GDP by 0.6%. The remaining findings in Part B consider the enlargement
43
Gains from Foreign Direct Investment
To determine the overall short-term gains from FDI, we present in Figure 5-15 the total
world capital on the horizontal axis and the rental earned in each country on the vertical
axis. The amount of capital used at Home, measured from left to right, is denoted by 0K.
Prior to FDI, the Home rental is R at point A. The units of capital employed in Foreign,
5 Conclusion
This chapter examines the impact of labor and capital mobility on the Home and Foreign
country in the short and long run using the specific-factors and Heckscher‒Ohlin models,
respectively.
45
In the long run, when labor as well as capital is mobile between the industries, the wage
does not necessarily fall, in contrast to the short-run case. The reason is that there is an
expansion in the output of the industry that uses the labor intensively and a contraction in
the other industry, leading to full employment without a change in the labor‒capital ratio.
The change in the industry output is the main finding of the Rybczynski theorem.

46
TEACHING TIPS
Tip 1: Differences in the Short– and Long–Run Model
This chapter deals with the effects of factor movements on factor returns in both the
short- and long-run models. This is important because it demonstrates the differences
between these two models. In teaching this chapter, it is important to stress the
differences in factor returns and their link to factor mobility. Problems 9 and 10
demonstrate this difference. Ask students to complete them and comment on the
difference in output and factor prices in these two problems.
Tip 2: Discussion and Debate on Migration
Ask students to use information from this chapter (we suggest students read SIDE BAR:
Immigrants and Their Remittances and APPLICATION: Gains from Migration), as well
as independent research, to prepare to discuss the consequences of migration for both
Data on world migration
UN International Migrant Stock: http://esa.un.org/migration/
Data source for remittance flows
Time series data: Go to http://data.un.org/Default.aspx and search for “remittances”.
Most recent data and projections: Search for “World Bank migration and remittances” to

47
Tip 3: FDI Data Exercise
To familiarize students with data sources, ask students to look up the most recent U.S.
direct investment data, as seen in Problems 1–3. Instruct students to go to
http://www.bea.gov and then proceed to the section entitled “International Economic
Accounts”. Scroll down to “Operations of Multinational Companies” and click on the
“Selected Tables” link for U.S. direct investment abroad and FDI in the United States.
Here, students will find country-by-industry tables on the historical–cost basis for FDI in
the United States and the U.S. direct investment position abroad (as is reported in the In-
Class Problems).
Ask students to investigate the latest available industry–level data and discuss whether
they remain consistent with previous data or if any major changes have occurred.
Additionally, you may want to ask students to investigate the data by source and
destination country (as in Problems 1 and 2). Which countries does the United States
invest in most heavily, and in which industries? Which countries invest most heavily in
the United States, and in what U.S. industries? Ask students to compile this information
and discuss it.
48
IN–CLASS PROBLEMS
1. Obtain information pertaining to the U.S. direct investment position abroad on a
historical-cost basis from the Bureau of Economic Analysis
(http://bea.gov/international/di1usdbal.htm.
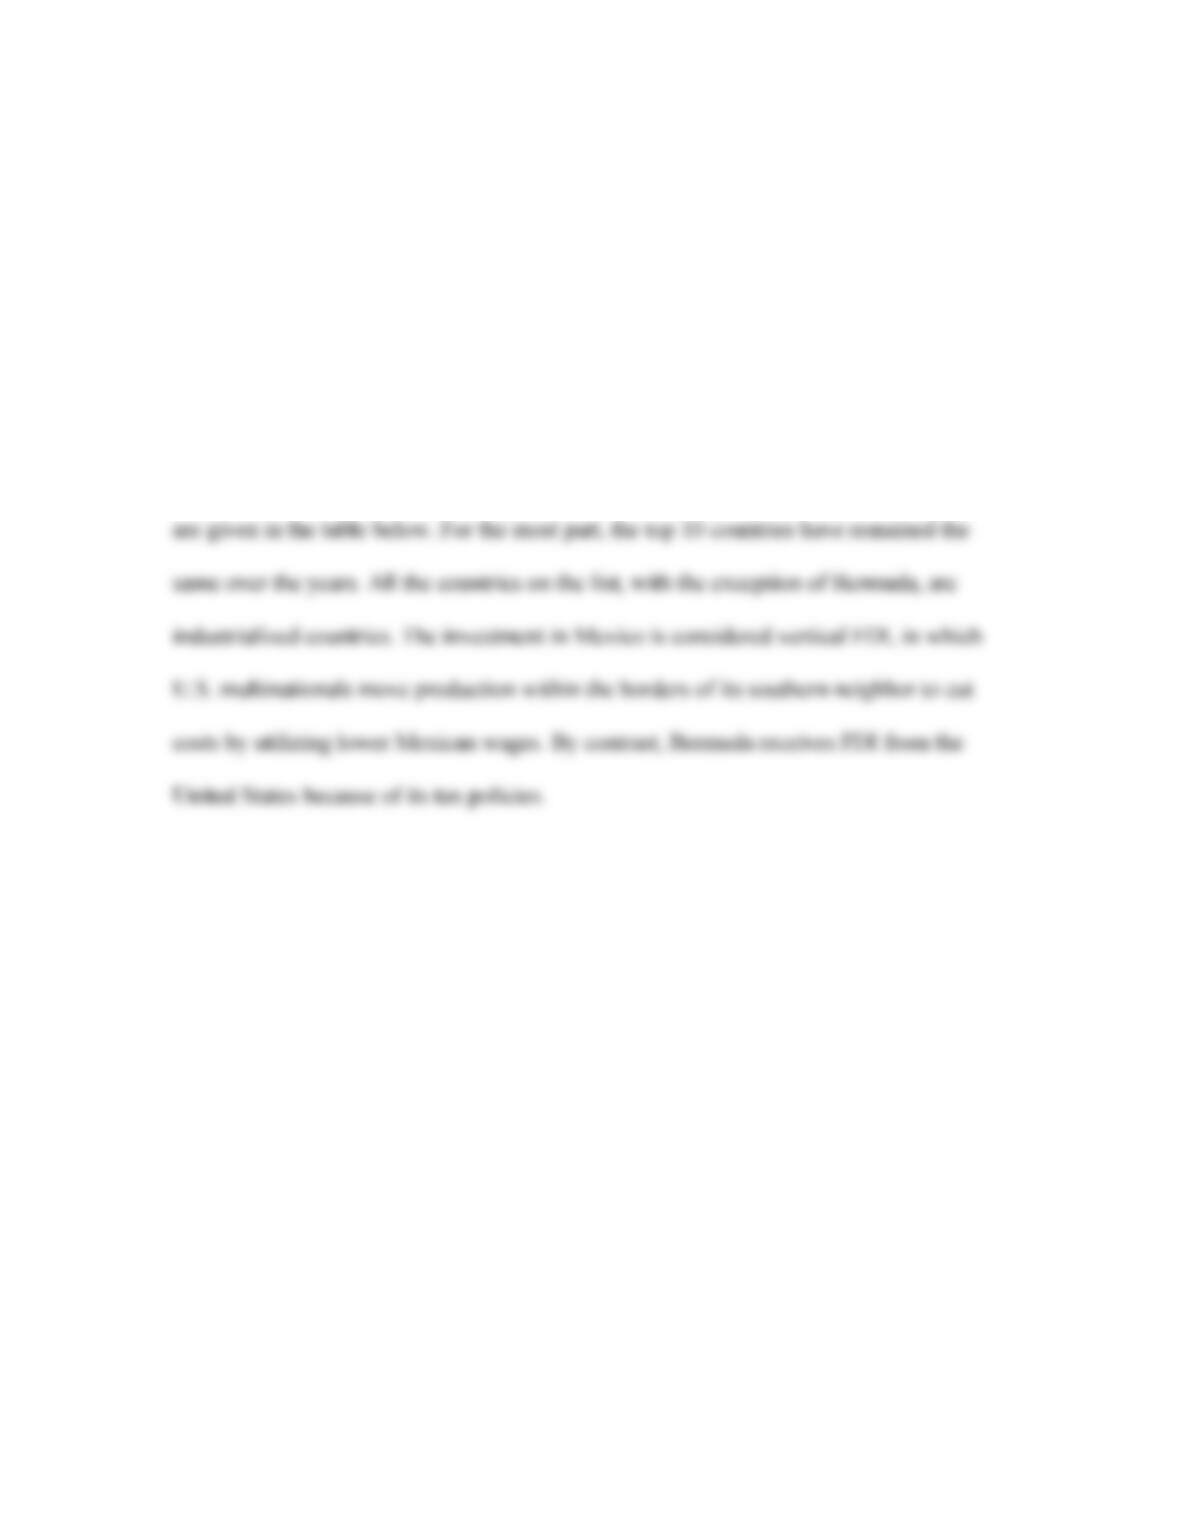
Name the top 20 countries receiving FDI from the United States. Comment on your list.
Have the countries remained the same over the years?
Answer: The top 20 countries that received FDI from the United States in 2009
49
U.S. Direct Investment Abroad on a Historical–Cost Basis
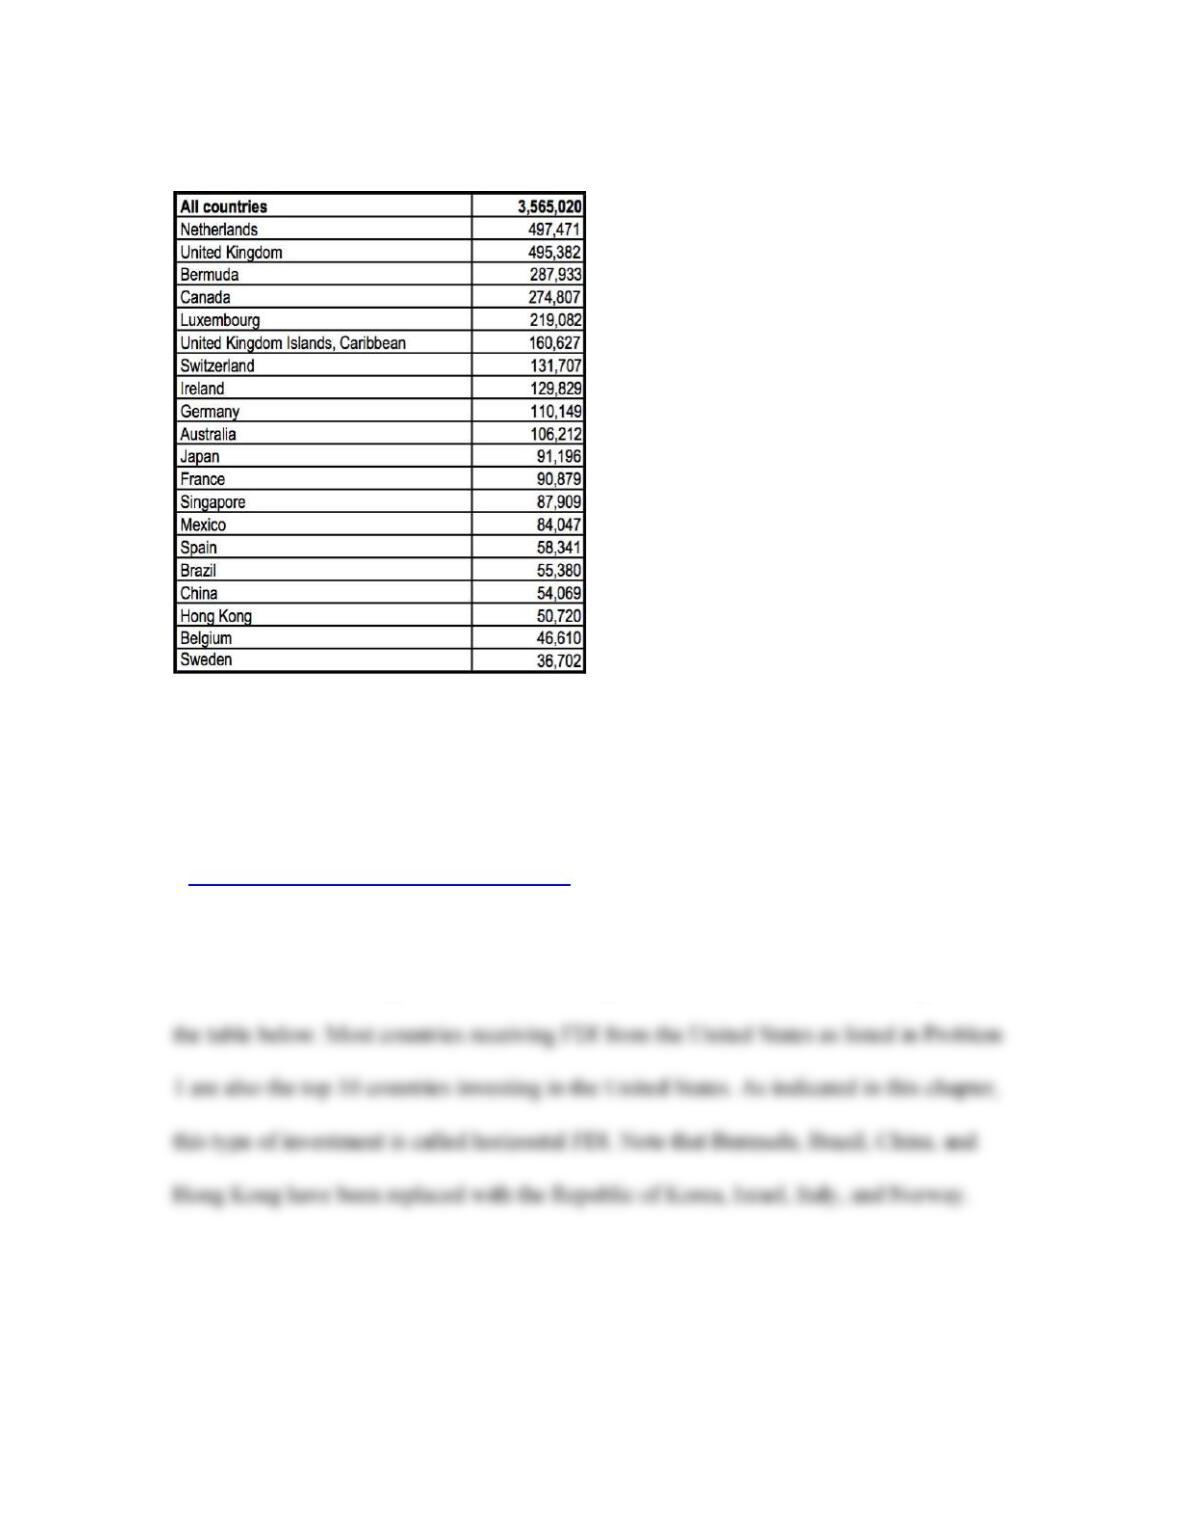
2. Name the top nine countries investing in the United States using data on the
historical-cost basis as compiled by the Bureau of Economic Analysis
((http://bea.gov/international/di1fdibal.htm). Is your list of countries the same as that in
Problem 1? What may account for the differences?
Answer: The top 20 countries investing in the United States in 2009 are given in
50
FDI into the United States by Country on a Historical-Cost Basis
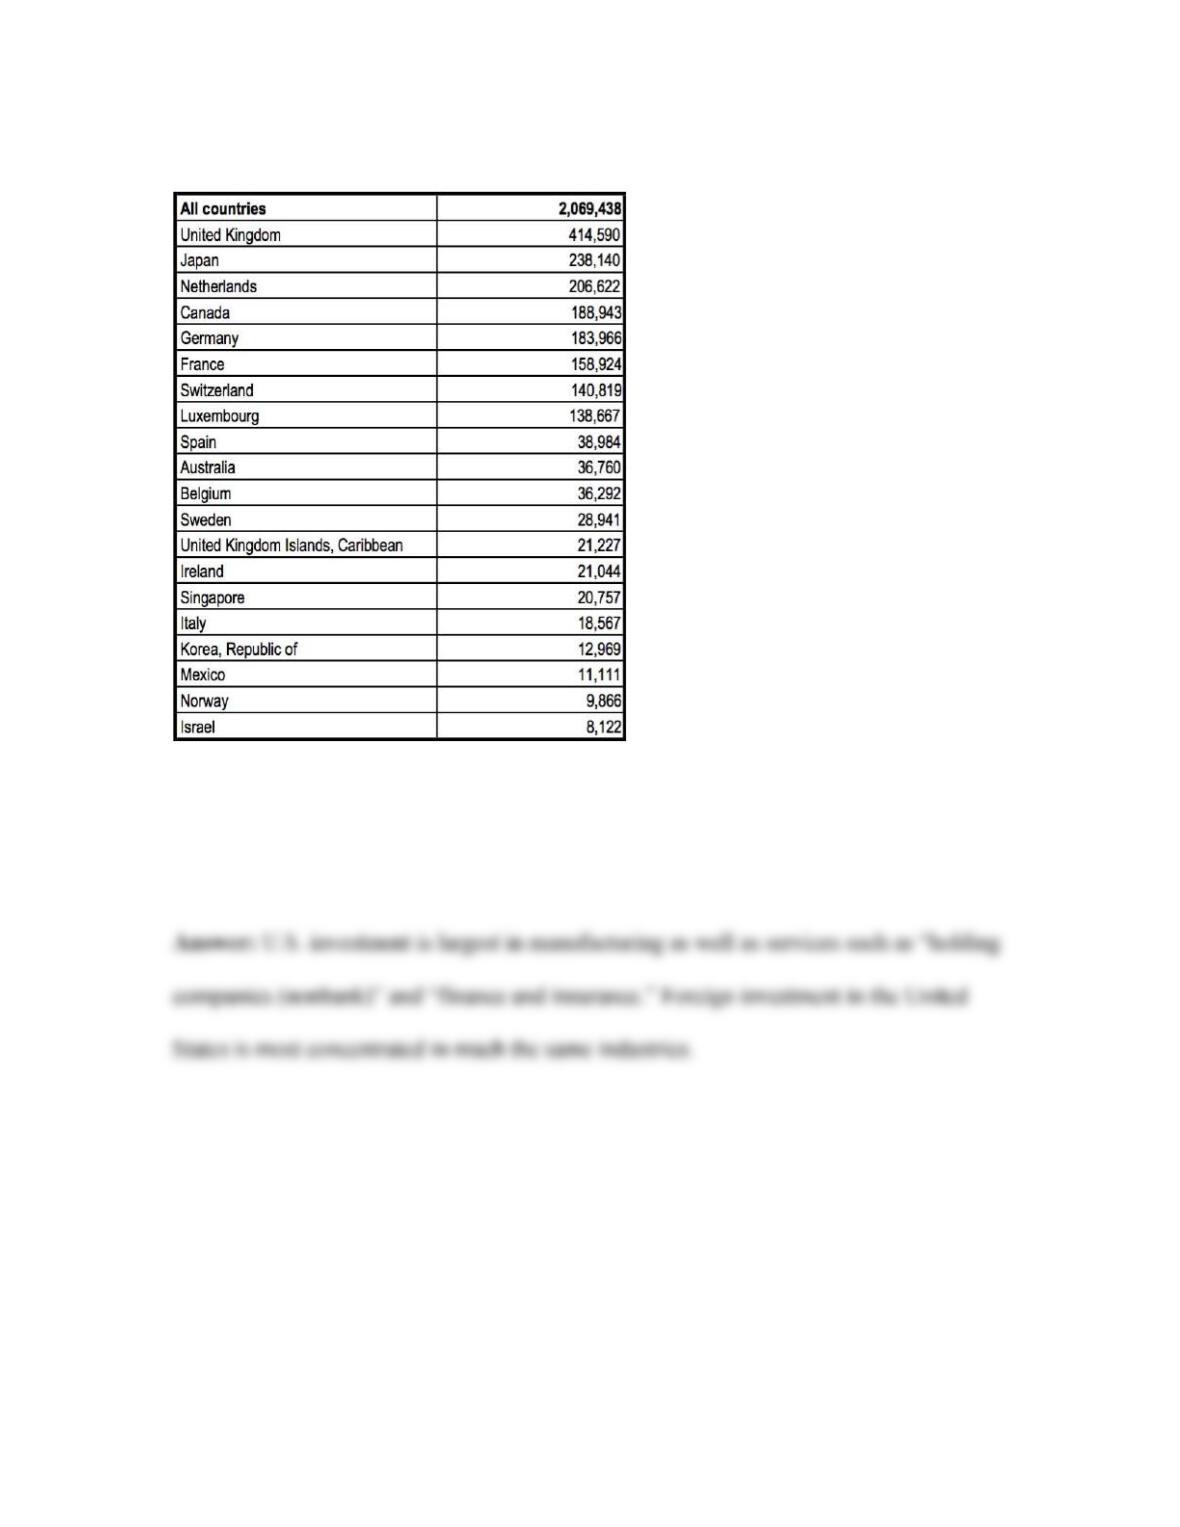
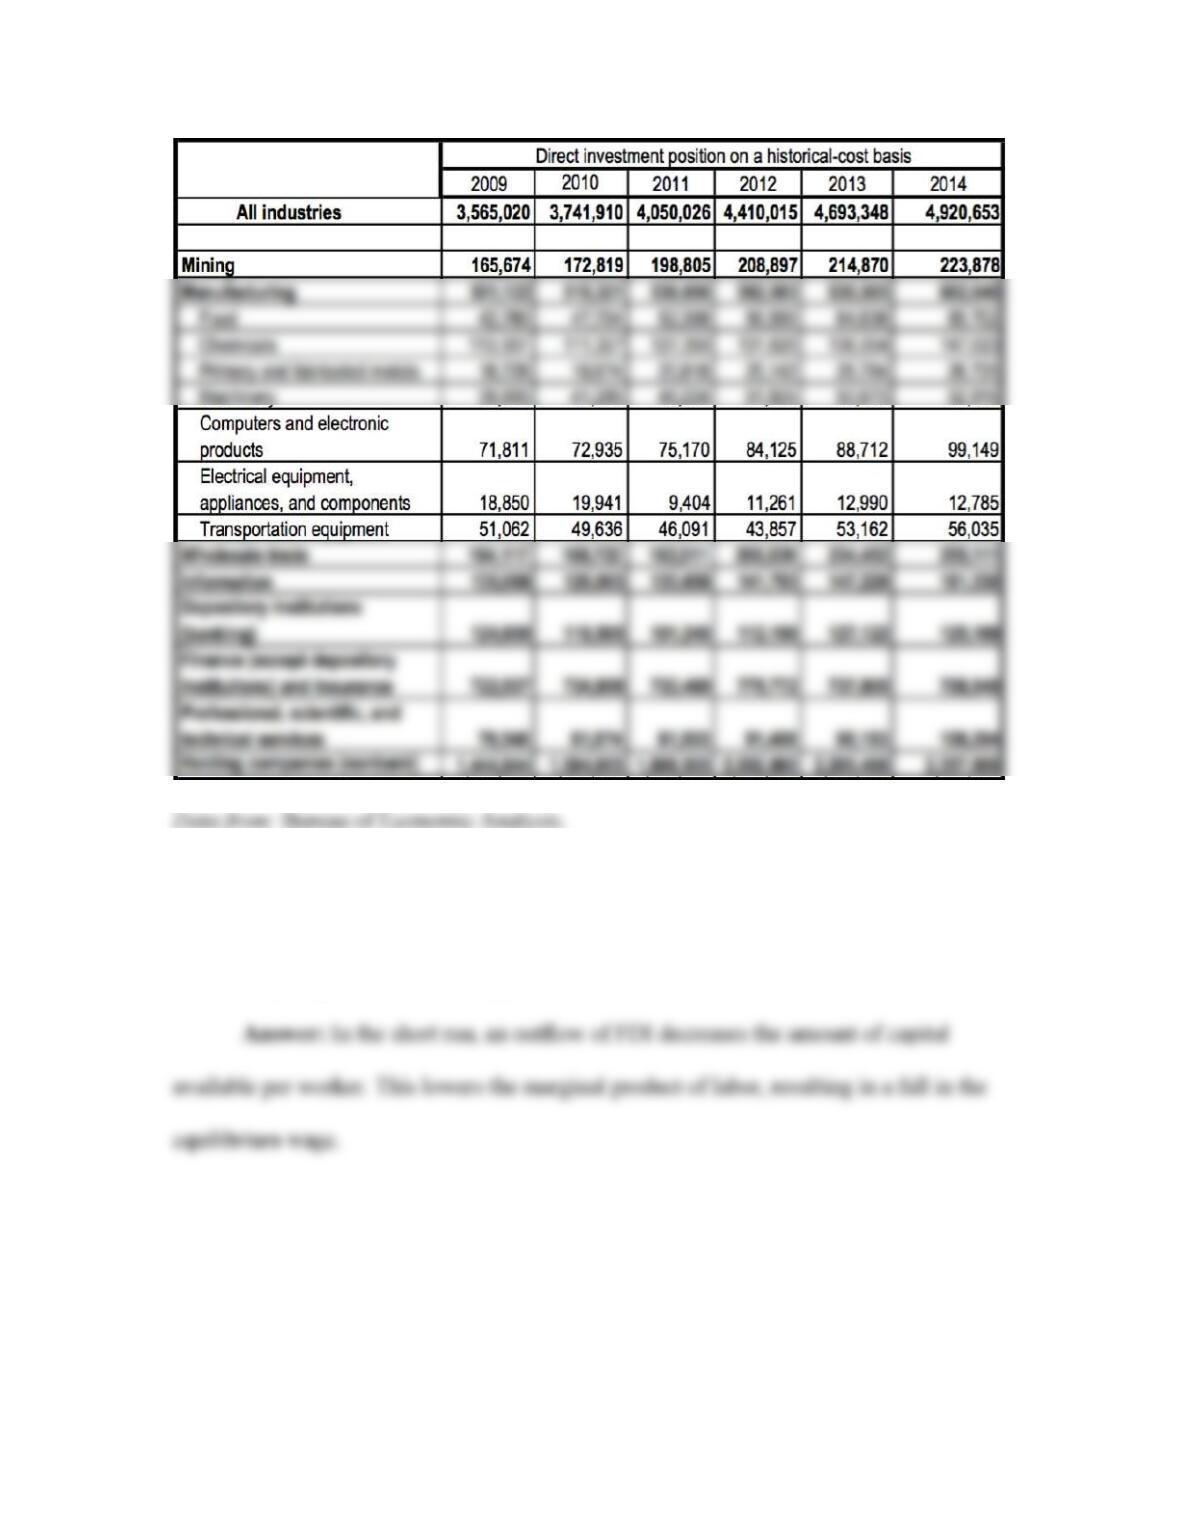
3. In which industries is the U.S. investment abroad the largest? In what industries
are foreign investments in the United States most concentrated?
U.S. Direct Investment Abroad by Industry on a Historical-Cost Basis, 2009‒14
(millions of U.S. dollars)
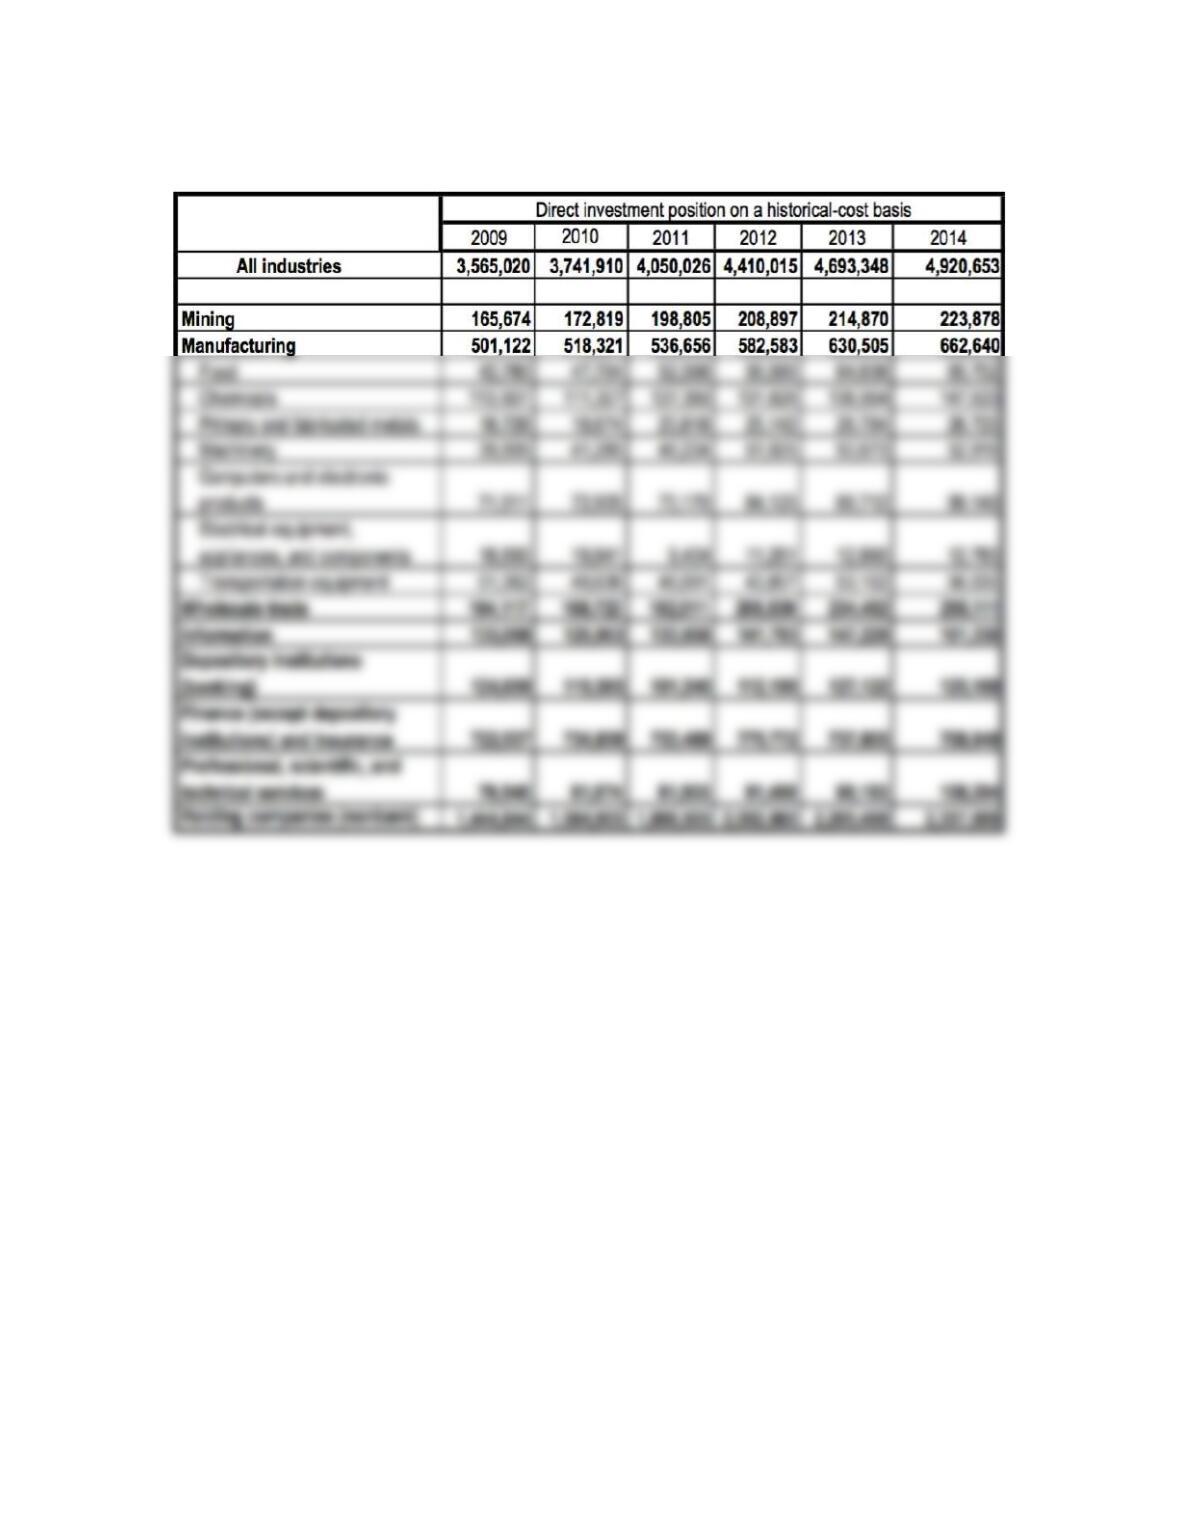
51
Data from: Bureau of Economic Analysis.
FDI in the United States by Industry on a Historical-Cost Basis, 2008‒14 (millions of
U.S. dollars)
52
4. Why might labor unions support limitations on the outflow of FDI?
53
5. According to Table 5-3, for some countries remittances account for a larger
source of income than foreign aid. Should these countries have policies to encourage
emigration? Explain.
6. Assume that Mexico receives an inflow of FDI. Suppose two factors (labor and
capital) are used in the production in two industries (food and televisions). Further
assume that televisions are capital-intensive, as compared with food. Use the long-run
specific-factors model to answer the following questions.
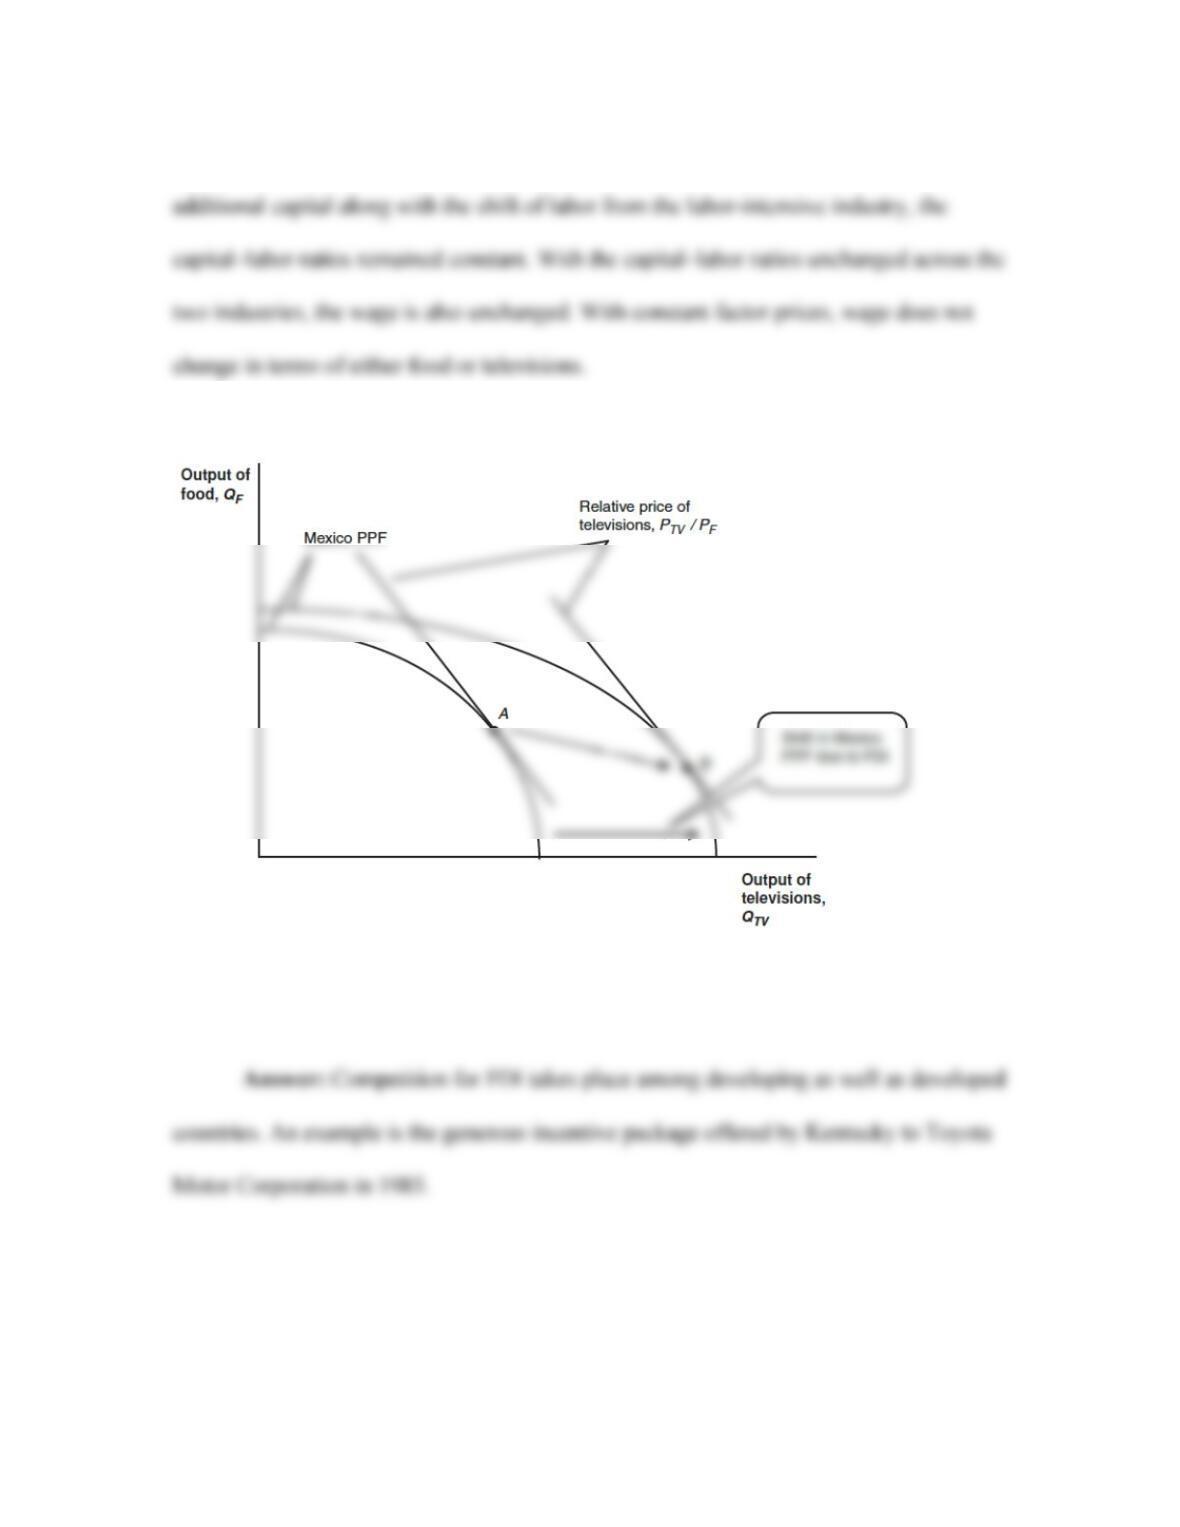
a. Show the impact of the inflow of FDI on Mexico in an illustration similar
to Figure 5.13, with the output of food (televisions) on the vertical (horizontal) axis.
What happens to the output of each good?
b. How has wage changed in terms of food and televisions?
54
Answer: Because the capital-intensive industry (televisions) absorbed the
7. Only developing countries compete for FDI. Comment.

55
8. The following table shows the flow of FDI for select countries between 1985 and
2008. Over this period, the inflow of FDI to China increased substantially. What is the
impact of this flow of capital on wages in China according to the short-run specific–
factors model?
FDI Flow by Country, 1985‒2008 (millions of U.S. dollars)
Flow
1985–
2004
(Annual
Average)
2005
2006
2007
2008
Outflows
395,122
741,972
1,157,910
1,809,531
1,506,528
United
Kingdom
Inflows
33,530
176,006
156,186
183,386
96,939
Outflows
60,078
80,833
86,271
275,482
111,411
Inflows
3,238
2,775
–6,506
22,549
24,426
Outflows
226,874
45,781
50,266
73,549
128,020
Inflows
439,007
973,329
1,461,074
1,978,838
1,697,353
Developed
Inflows
312,072
613,089
972,762
1,358,628
962,259

56
United
States
Inflows
93,586
104,809
237,136
271,176
316,112
Outflows
46,412
122,707
215,282
285,486
292,710
India
Inflows
2,036
7,606
20,336
25,127
41,554
Outflows
419
2,978
14,344
17,281
17,685
China
Inflows
27,900
72,406
72,715
83,521
108,312
Outflows
2,263
12,261
21,160
22,469
52,150
Inflows
10,492
21,922
19,316
27,278
21,950
Outflows
908
6474
5758
8256
686
Data from: UNCTAD, Interactive Database.
9. Consider a long-run model for a country producing two products (digital cameras
and baskets) using two factors (capital and labor).
Outflows
90,779
15,369
224,220
378,362
311,796
Developing
Inflows
120,841
329,292
433,764
529,344
620,733
57
a. Which good would you expect to be capital-intensive? Which good would
you expect to be labor-intensive? Why?
Answer: We define a capital-intensive good (in contrast to a labor–
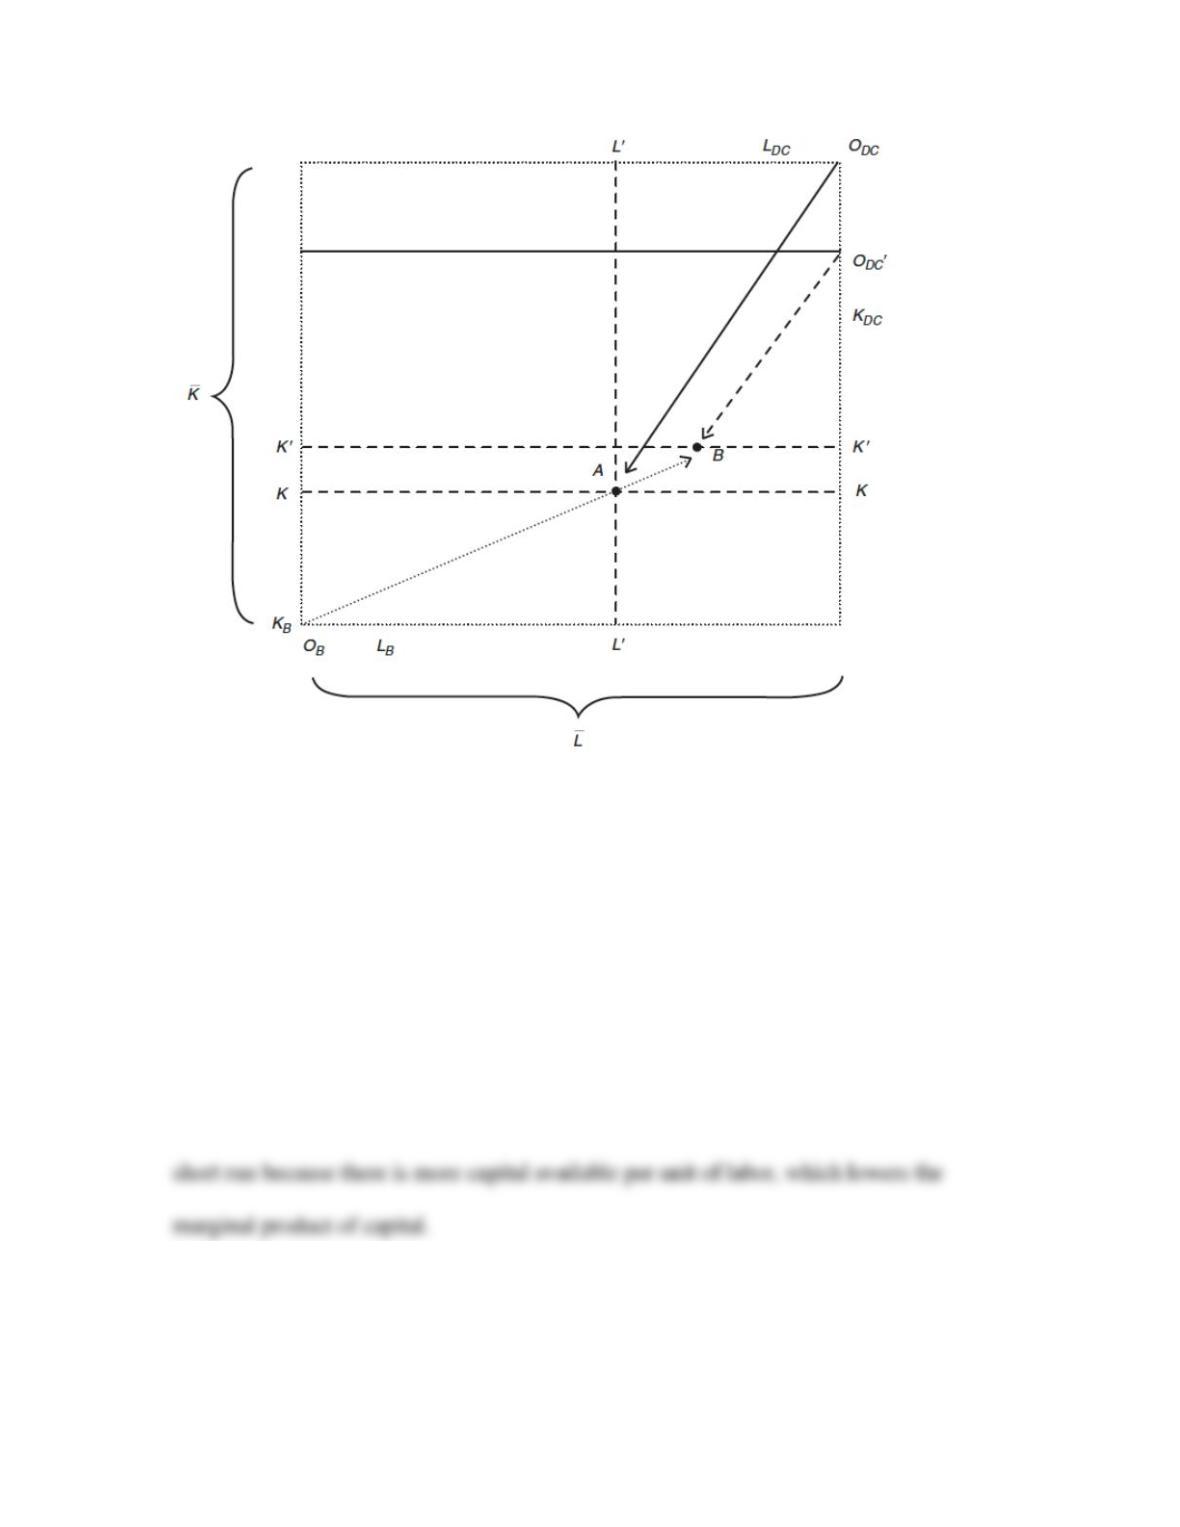
b. Suppose that foreign owners of domestic capital decide to decrease their
investment. Illustrate the effects of this change in a box diagram. Does output in each
industry increase, decrease, or stay the same? Do wages increase, decrease, or stay the
same in each industry?
Answer: The effect of decreasing FDI is equivalent to a decrease in
58
10. Suppose a country has two specific factors, land and capital. Land is an input in
the production of corn. Capital is used only in the production of rockets. A third factor,
labor, is mobile between the two sectors. Holding all else constant, what is the effect of
an increase in the amount of available capital in the short run?
a. on the real return on capital?
Answer: The increase in capital leads to a decrease in its real return in the
b. on the real return of the mobile factor of production?

59
c. on the output of corn and rockets?
Answer: According to the Rybczynski theorem, an increase in the amount
11. Have your class watch the TED Talk located at
https://www.ted.com/talks/dilip_ratha_the_hidden_force_in_global_economics_sending_