CHAPTER 4
DEMAND, SUPPLY, AND MARKETS
In this chapter, you will find:
Learning Outcomes
Chapter Outline with PowerPoint Script
Chapter Summary
Teaching Points (as on Prep Card)
Solutions to Problems Appendix
INTRODUCTION
Chapter 4 introduces the concepts of demand and supply as well as the analysis of competitive markets.
LEARNING OUTCOMES
4-1 Explain why a demand curve slopes downward.
Demand is a relationship between the price of a product and he quantity consumers are willing and able to
4-2 Identify five things which could shift a demand curve to the right or left.
A change in any of the following could shift a demand curve right or left: (1) money income, (2) prices of
4-3 Explain why a supply curve usually slopes upward.
Supply is a relationship between the price of a good and the quantity producers are willing and able to sell
4-4 Identify five things which could shift a supply curve to the right or left.
4-5 Explain why surpluses push prices down while shortages drive prices up.
A surplus means there are more goods supplied at that price than demanded. Suppliers lower the price to
Chapter 4 Demand, Supply, and Markets 50
4-6 Predict the impact of a change in demand or supply on equilibrium price and quantity.
4-7 Describe the effect of a government-set price floor or price ceiling on the market.
If the floor price is set above the market clearing price, quantity supplied exceeds quantity demanded,
creating a surplus. If the ceiling price is set below the market clearing price, quantity demand exceeds that
quantity supplied, creating a shortage.
CHAPTER OUTLINE WITH POWERPOINT SCRIPT
USE POWERPOINT SLIDE 2 FOR THE FOLLOWING SECTION
Demand: Refers to the demand curve, the relation between the price of a good and the quantity demanded
USE POWERPOINT SLIDES 3-6 FOR THE FOLLOWING SECTION
The Law of Demand
• The Law of Demand states the quantity of a good demanded varies inversely with its price, other things
constant. More is demanded when the price decreases. Less is demanded when the price increases.
Demand, Wants, and Needs – are not the same
USE POWERPOINT SLIDES 7-11 FOR THE FOLLOWING SECTION
The Demand Schedule and Demand Curve
• Demand Schedule: Lists possible prices, along with the quantity demanded at each price.
USE POWERPOINT SLIDE 12 FOR THE FOLLOWING SECTION
Shifts of the Demand Curve
The demand curve isolates the relation between the price of a good and quantity demanded, assuming other
USE POWERPOINT SLIDES 13-14 FOR THE FOLLOWING SECTION
Changes in Consumer Income
• Demand for normal goods increases as money income increases.
• Demand for inferior goods decreases as money income increases.
Chapter 4 Demand, Supply, and Markets 51
USE POWERPOINT SLIDE 15 FOR THE FOLLOWING SECTION
Changes in the Prices of Other Goods
• Substitutes: Goods that are related in such a way that an increase in the price of one increases demand for
USE POWERPOINT SLIDE 16 FOR THE FOLLOWING SECTION
Changes in Consumer Expectations
• Consumers expecting increased future income may increase their current demand for a good.
• Consumers expecting a future price increase may increase their current demand for the good.
USE POWERPOINT SLIDES 17-19 FOR THE FOLLOWING SECTION
Changes in the Number or Composition of Consumers: Market demand is the sum of individual demands.
USE POWERPOINT SLIDE 20 FOR THE FOLLOWING SECTION
Supply: Refers to the supply curve, the relation between the price of a good and the quantity supplied when
other factors remain unchanged. Supply indicates how much producers are willing and able to offer for sale per
period at each possible price, other things constant.
USE POWERPOINT SLIDES 21-23 FOR THE FOLLOWING SECTION
• Law of supply: The quantity supplied is usually directly related to its price, other things constant. The
lower the price, the smaller the quantity supplied and the higher the price, the higher the quantity supplied.
USE POWERPOINT SLIDES 24-26 FOR THE FOLLOWING SECTION
• Quantity supplied: One point on the supply curve that shows the quantity supplied at a particular price.
USE POWERPOINT SLIDE 27 FOR THE FOLLOWING SECTION
Shifts of the Supply Curve
The supply curve isolates the relation between price and quantity supplied, assuming other factors are held
constant. Other variables that may affect supply include the state of technology, the prices of relevant
Chapter 4 Demand, Supply, and Markets 52
USE POWERPOINT SLIDES 28-29 FOR THE FOLLOWING SECTION
Changes in Technology: If a better technology is discovered, production costs will fall. Quantity supplied at
USE POWERPOINT SLIDE 30 FOR THE FOLLOWING SECTION
Changes in the Prices of Relevant Resources
• Those resources employed in the production of the good.
• If the price of a relevant (important) resource decreases, costs of production fall and the supply curve
USE POWERPOINT SLIDE 31 FOR THE FOLLOWING SECTION
Changes in the Prices of Alternative Goods
• Alternative goods: Those that use some of the same resources as are employed to produce the good under
USE POWERPOINT SLIDE 32 FOR THE FOLLOWING SECTION
Changes in Producer Expectations: If a producer expects the future price of a good to be higher than today’s
price, he may decrease or increase the current supply, depending on the good under consideration.
USE POWERPOINT SLIDES 33-34 FOR THE FOLLOWING SECTION
Changes in the Number of Producers: If the number of producers increases, supply will increase, or shift to
the right.
USE POWERPOINT SLIDE 35 FOR THE FOLLOWING SECTION
Demand and Supply Create a Market
USE POWERPOINT SLIDES 36-40 FOR THE FOLLOWING SECTION
Market Equilibrium
• Surplus: Excess quantity supplied; puts downward pressure on the price.
USE POWERPOINT SLIDES 41-43 FOR THE FOLLOWING SECTION
Changes in Equilibrium Price and Quantity
Factors that Shift the Demand Curve
Chapter 4 Demand, Supply, and Markets 53
USE POWERPOINT SLIDES 44-46 FOR THE FOLLOWING SECTION
Factors that shifts the Supply Curve
• Given a downward-sloping demand curve, a leftward shift of the supply curve decreases equilibrium
USE POWERPOINT SLIDES 47-50 FOR THE FOLLOWING SECTION
Simultaneous Shifts of Demand and Supply Curves
• If both curves shift, the results are less obvious but can be approximated by drawing the demand and
supply diagram, shifting the curves appropriately, and interpreting the new equilibrium point.
USE POWERPOINT SLIDE 51 FOR THE FOLLOWING SECTION
Disequilibrium Prices: Represent a temporary phase while the market seeks equilibrium.
USE POWERPOINT SLIDES 52-54 FOR THE FOLLOWING SECTION
Price Floor: A minimum selling price above the equilibrium price. To have an impact, the price floor must be
CHAPTER SUMMARY
Demand is a relationship between the price of a product and the quantity consumers are willing and able to buy
per period, other things constant. According to the law of demand, quantity demanded varies negatively, or
inversely, with the price, so the demand curve slopes downward.
Supply is a relationship between the price of a good and the quantity producers are willing and able to sell per
period, other things constant. According to the law of supply, price and quantity supplied are usually positive,
or directly, related, so the supply curve typically slopes upward.
Chapter 4 Demand, Supply, and Markets 54
Demand and supply come together in the market for the good. A market provides information about the price,
quantity, and quality of the good. In doing so, a market reduces the transaction costs of exchange—the costs of
time and information required for buyers and sellers to make a deal. The interaction of demand and supply
guides resources and products to their highest-valued use.
A price ceiling is a maximum legal price above which a particular good or service cannot be sold.
Governments sometimes impose price ceilings to reduce the price of some consumer goods such as rental
housing. If the ceiling price is below the market clearing price, quantity demanded exceeds the quantity
supplied, creating a shortage. Because the price system is not allowed to clear the market, other mechanisms
arise to ration the product among demanders.
TEACHING POINTS
1. Students are usually confused by the distinction between demand and quantity demanded. Such
confusion can be reduced by continually reminding students that demand is a curve that depicts the
relationship between price and quantity demanded assuming that all other factors (which may affect
2. You may wish to begin the discussion of demand and supply by creating both curves through an
example in class (i.e., ask students how many cookies they would like to buy next class at different prices.
3. The income and substitution effects can be presented as the direct consequence of the ceteris paribus
assumption. Holding other prices constant while changing the price of the good whose demand curve is
4. You should use examples to discuss how the demand for a particular good changes when the price of a
substitute or a complement changes. Students may have trouble with this concept, but if concrete
Chapter 4 Demand, Supply, and Markets 55
5. Students frequently become mixed up distinguishing between movements along and shifts in the
demand and supply curves. It is best to use MANY examples to illustrate the difference. Numerical
6. You may want to get into the normative aspects of equilibrium price changes to answer the question “Is
the equilibrium price a desirable price?” This will lead to a discussion of who gains and who loses from
7. By the end of the chapter, students may still have difficulty understanding how markets are able to
identify the equilibrium price. Charles Holt, in a 1996 article published in the Journal of Economic
in the classroom and should generate much interest among students.
SOLUTIONS TO PROBLEMS APPENDIX
1. (Shifting Demand) Using demand and supply curves, show the effect of each of the following on the
market for cigarettes:
a. A cure for lung cancer is found.
b. The price of cigars increases.
c. Wages increase substantially in states that grow tobacco.
d. A fertilizer that increases the yield per acre of tobacco is discovered.
e. There is a sharp increase in the price of matches, lighters, and lighter fluid.
f. More states pass laws restricting smoking in restaurants and public places.
a. This should shift the demand curve for cigarettes to the right.
2. (Substitutes and Complements) For each of the following pairs of goods, determine whether the
goods are substitutes, complements, or unrelated:
a. Peanut butter and jelly
b. Private and public transportation
c. Coke and Pepsi
d. Alarm clocks and automobiles
e. Golf clubs and golf balls
Chapter 4 Demand, Supply, and Markets 56
a. Complements
3. (Demand Shifters) List five things that are held constant along a market demand curve, and identify the
change in each that would shift that demand curve to the right—that is, that would increase demand.
Five demand shifters mentioned in the textbook that could cause an increase in demand include an
4. (Supply) Why is a firm willing and able to increase the quantity supplied as the product price increases?
There are two reasons why producers offer more for sale when the price rises. First, as the price
5. (Supply) What is the law of supply? Give an example of how you have observed the law of supply
at work. What is the relationship between the law of supply and the supply curve?
The law of supply states that the quantity supplied of a good is usually directly related to its price,
6. (Supply Shifters) List the five things that are held constant along a market supply curve, and identify
the change in each that would shift that supply curve to the right—that is, that would increase supply.
Five supply shifters mentioned in the textbook that could cause an increase in supply include an
7. (Demand and Supply) How do you think each of the following affected the world price of oil? (Use
demand and supply analysis.)
Chapter 4 Demand, Supply, and Markets 57
a. Tax credits were offered for expenditures on home insulation.
b. The Alaskan oil pipeline was completed.
c. The ceiling on the price of oil was removed.
d. Oil was discovered in the North Sea.
e. Sport utility vehicles and minivans became popular.
f. The use of nuclear power declined.
a. Such credits decreased the demand for oil and lowered the world price.
8. (Demand and Supply) What happens to the equilibrium price and quantity of ice cream in response
to each of the following? Explain your answers.
a. The price of dairy cow fodder increases.
b. The price of beef decreases.
c. Concerns rise about the fat content of ice cream. Simultaneously, the price of sugar (used to
produce ice cream) increases.
a. The supply curve shifts left, equilibrium price rises, equilibrium quantity falls.
9. (Market Surplus) Why would firms accept a lower price if there is a market surplus?
10. (Market Shortage) Why would firms raise the price if there is a market shortage, and why would some
consumers pay that higher price. At what point would firms stop raising the price?
A shortage means the quantity demanded exceeds the quantity supplied. Some buyers would be
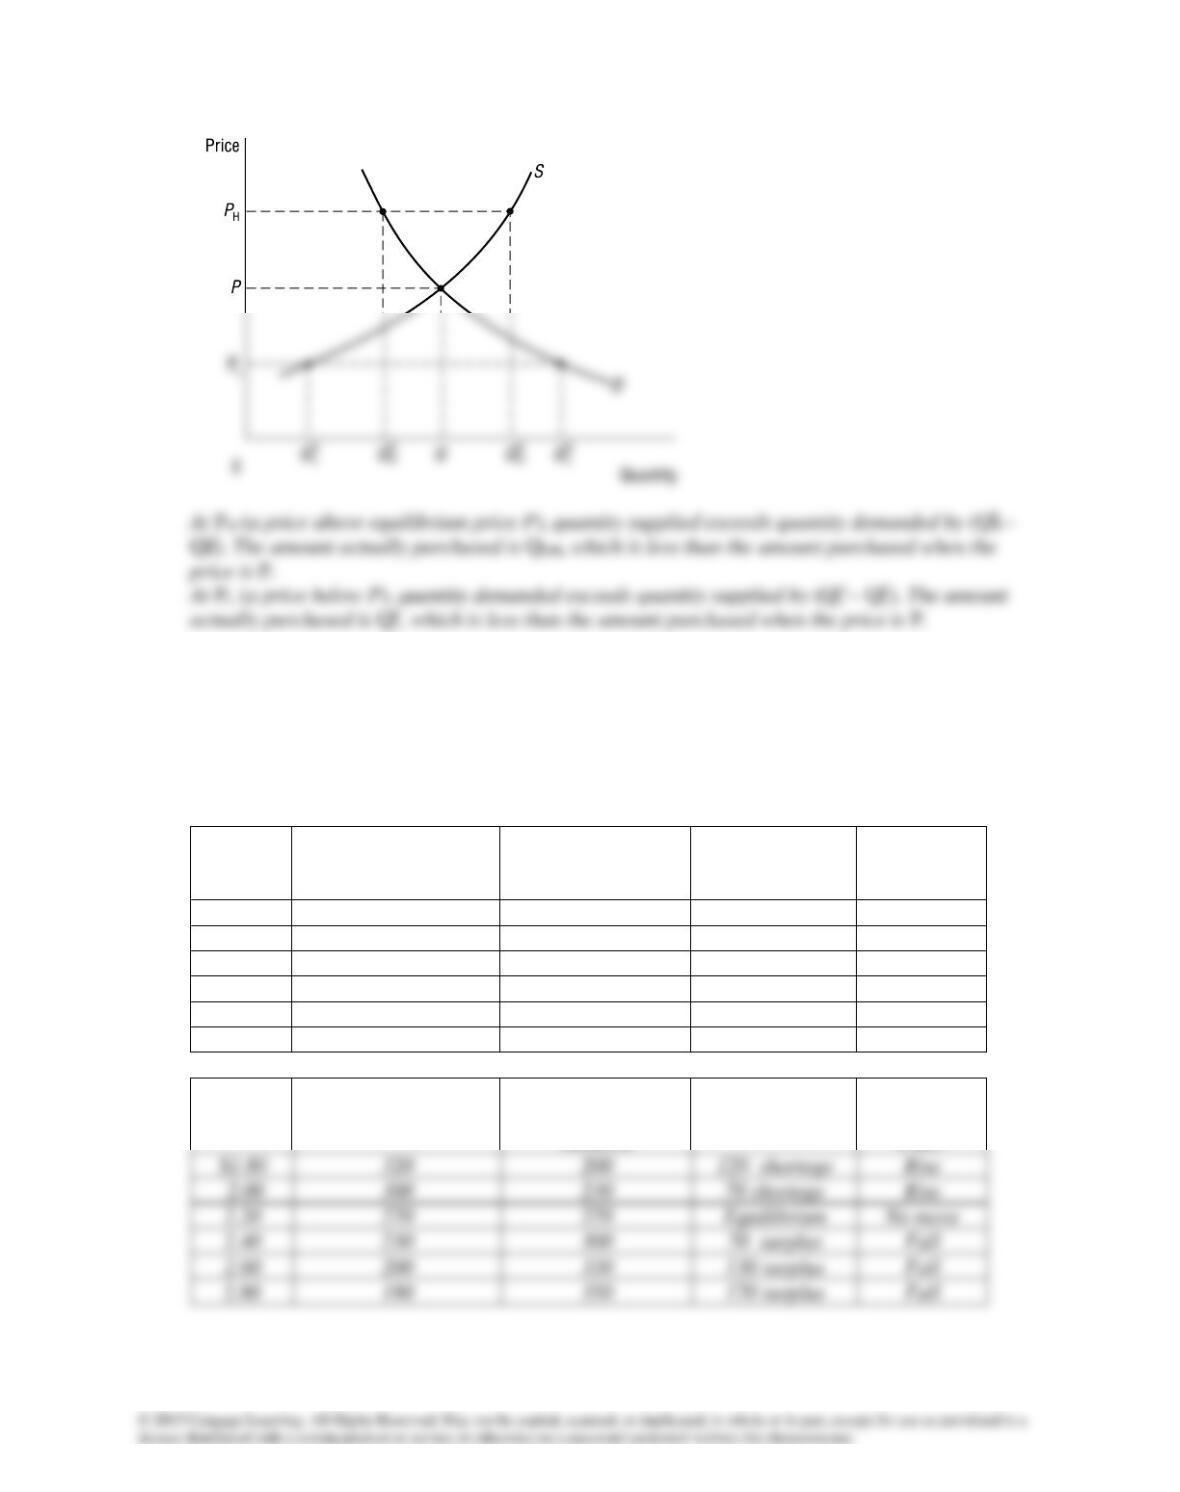
11. (Equilibrium) “If a price is not an equilibrium price, there is a tendency for it to move to its
equilibrium level. Regardless of whether the price is too high or too low to begin with, the
adjustment process will increase the quantity of the good purchased.” Explain, using a demand and
supply diagram.
Chapter 4 Demand, Supply, and Markets 58
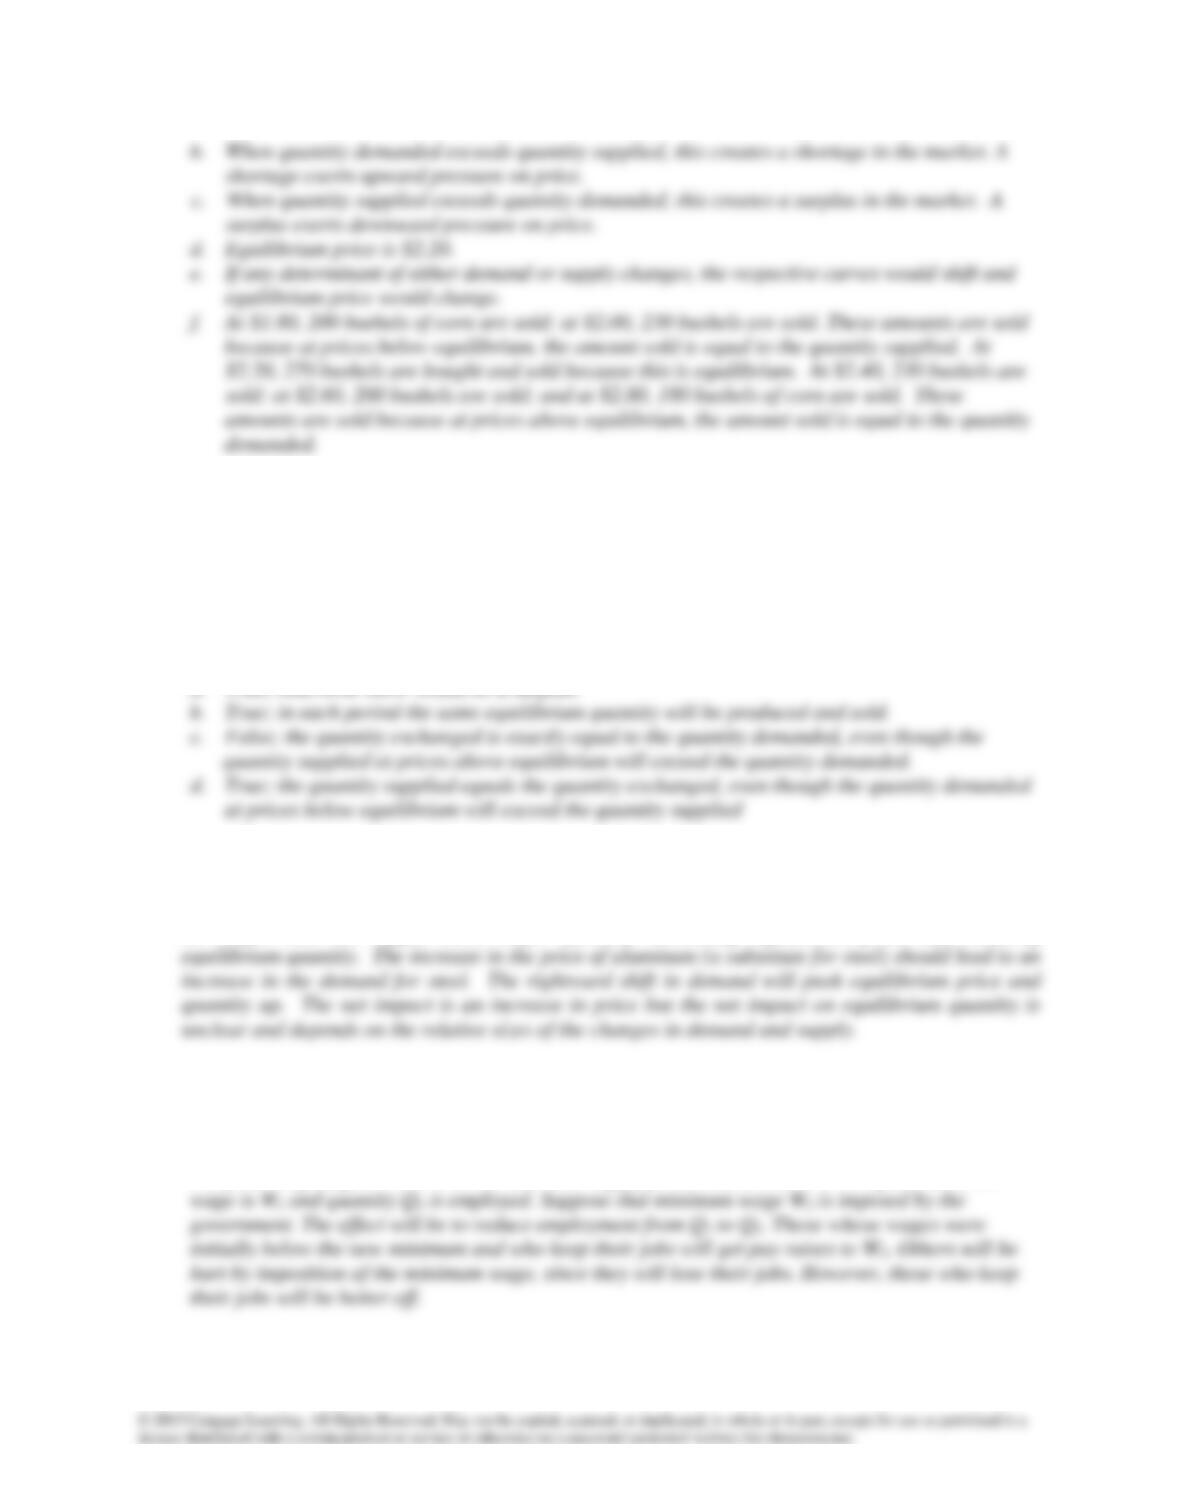
12. (Equilibrium) Assume the market for corn is depicted as in the table that appears below.
a. Complete the table below.
b. What market pressure occurs when quantity demanded exceeds quantity supplied? Explain.
c. What market pressure occurs when quantity supplied exceeds quantity demanded? Explain.
d. What is the equilibrium price?
e. What could change the equilibrium price?
f. At each price in the first column of the table below, how much is sold?
Price per
Bushel
Quantity Demanded
(millions of bushels)
Quantity Supplied
(millions of
bushels)
Surplus/
Shortage
Will Price
Rise or Fall?
$1.80
320
200
2.00
300
230
2.20
270
270
2.40
230
300
2.60
200
330
2.80
180
350
a.
Price per
Bushel
Quantity Demanded
(millions of bushels)
Quantity Supplied
(millions of
bushels)
Surplus/
Shortage
Will Price
Rise or
Fall?
Chapter 4 Demand, Supply, and Markets 59
13. (Market Equilibrium) Determine whether each of the following statements is true, false, or
uncertain. Then briefly explain each answer.
a. In equilibrium, all sellers can find buyers.
b. In equilibrium, there is no pressure on the market to produce or to consume more than is being
sold.
c. At prices above equilibrium, the quantity exchanged exceeds the quantity demanded.
d. At prices below equilibrium, the quantity exchanged is equal to the quantity supplied.
14. (Changes in Equilibrium) What are the effects on the equilibrium price and quantity of steel if the
wages of steelworkers rise and, simultaneously, the price of aluminum rises?
As wages rise, the supply curve shifts leftward, increasing equilibrium price and reducing
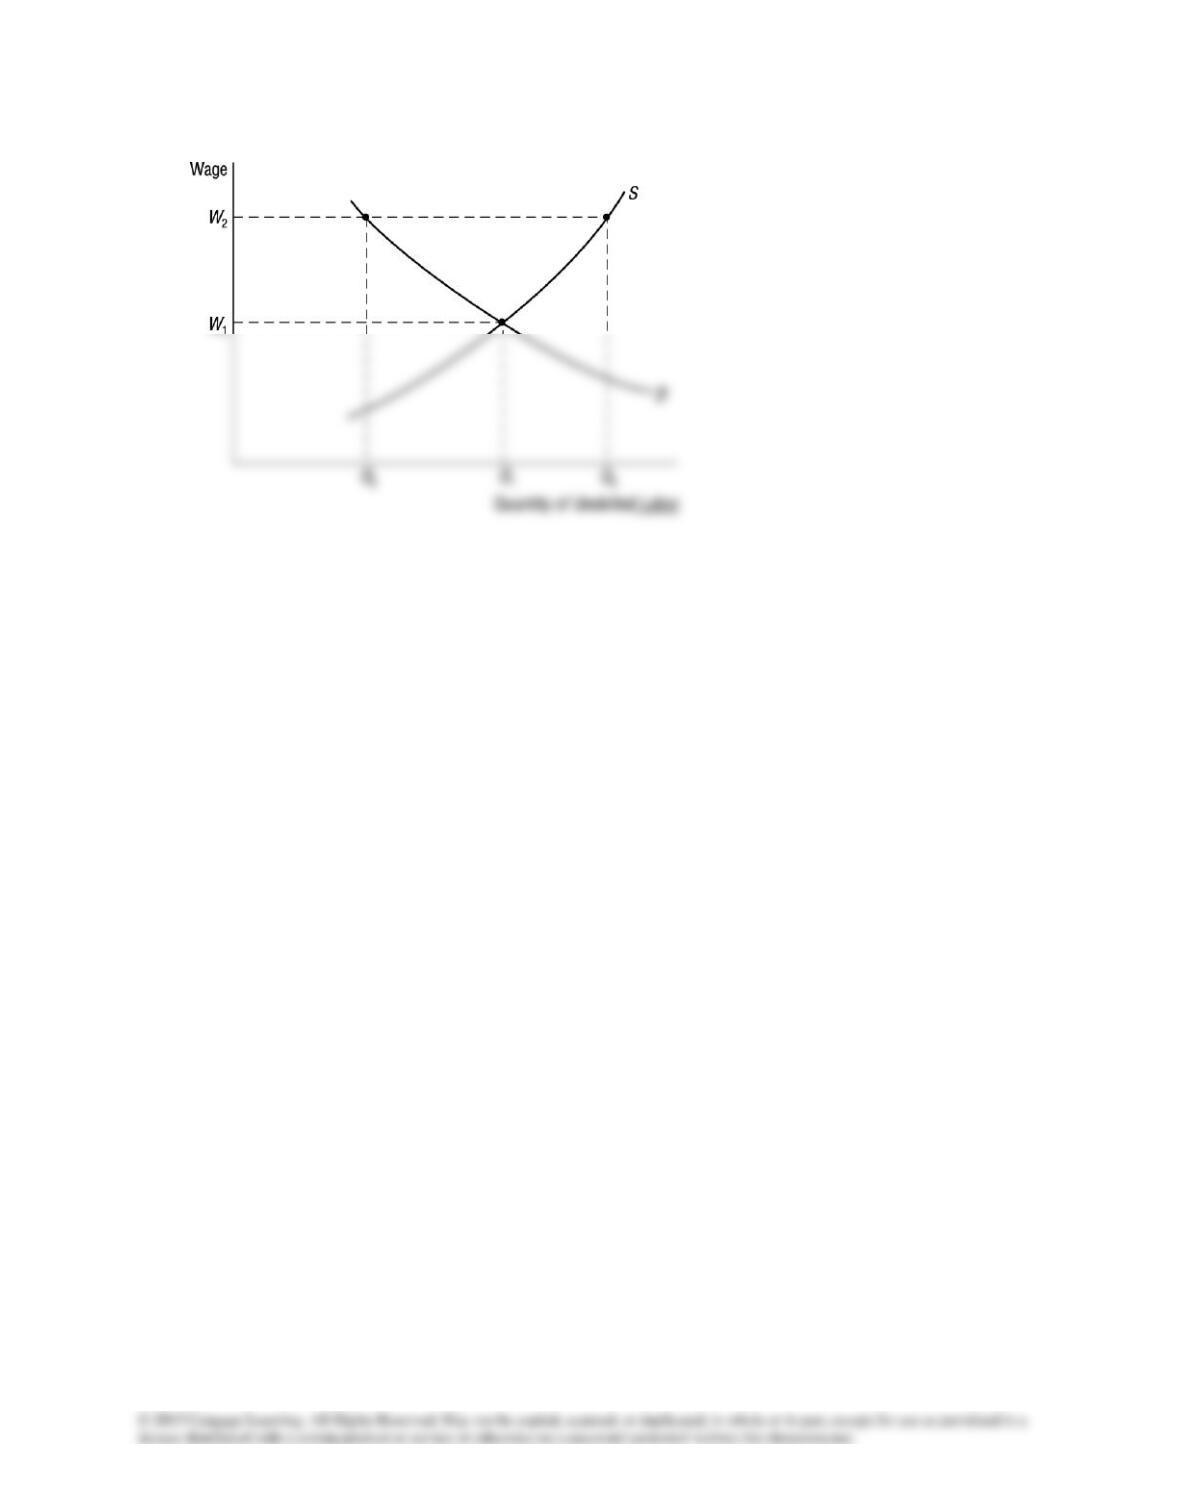
15. (Price Floor) There is considerable interest in whether the minimum wage rate contributes to
teenage unemployment. Draw a demand and supply diagram for the unskilled labor market, and
discuss the effects of a minimum wage. Who is helped and who is hurt by the minimum wage?
The following diagram shows the demand and supply for unskilled workers. At equilibrium, the
Chapter 4 Demand, Supply, and Markets 60