
Chapter 4
DEMAND ANALYSIS
QUESTIONS & ANSWERS
Q4.1 “The utility derived from consumption is intangible and unobservable. Therefore, the
utility concept has no practical value.” Discuss this statement.
Q4.1 ANSWER
The utility derived from consumption is intangible, and therefore unobservable.
Q4.2 Is an increase in total utility or satisfaction following an increase in income consistent
with the law of diminishing marginal utility?
Q4.2 ANSWER
Yes, the law of diminishing marginal utility states that the marginal utility derived from
Q4.3 Prospective car buyers are sometimes confronted by sales representatives who argue
that they can offer a vehicle that is “just as good as a BMW, but at one-half the price.”
Use the indifference concept to explain why the claims of the sales representative are
not credible.
Q4.3 ANSWER
If two products provide the same amount of satisfaction or utility, the consumer is said

78 Chapter 4
Q4.4 Following a price change for Diet Coke, explain how retailers use sales information to
learn if Doritos snack chips represent a complement or substitute for Diet Coke.
Q4.4 ANSWER
Following a price change, companies use sales information to distinguish complements
from substitutes by noting the size and direction of effects on demand for related
Q4.5 During the past 40 years the average price of a new single-family home has risen by a
factor of ten, making the cost of housing prohibitive for many Americans. Over the
same time frame, however, the number of units sold per year has more than doubled.
Are these data inconsistent with the idea of a downward-sloping demand curve for new
housing?
Q4.5 ANSWER

Demand Analysis 79
Q4.6 What would an upward-sloping demand curve imply about the marginal utility derived
from consumption? Why aren’t upward sloping demand curves observed in the real
world?
Q4.6 ANSWER
The law of diminishing marginal utility states that the marginal utility derived will fall
as the consumption of a given product increases during a given time interval. This gives
rise to a downward sloping demand curve for all goods and services. For a given
Q4.7 How is a price-consumption curve related to a demand curve?
Q4.7 ANSWER
If income and the prices of other goods and services are held constant, a reduction in the
price of a given consumption item causes consumers to choose different market baskets.

80 Chapter 4
Q4.8 An estimated 80% increase in the retail price of cigarettes is necessary to cause a 30%
drop in the number of cigarettes sold. Would such a price increase help or hurt tobacco
industry profits? What would be the likely effect on industry profits if this price boost
was simply caused by a $1.50 per pack increase in cigarette excise taxes?
Q4.8 ANSWER
The price elasticity of demand for cigarettes is highly inelastic if an 80% increase in
retail prices would cause only a 30% drop in the number of cigarettes sold. An arc price
elasticity for cigarettes on the order of EP = -0.375 (= -30%/80%) implies that tobacco
Q4.9 Individual consumer demand declines for inferior goods as personal income increases
because consumers replace them with more desirable alternatives. Is an inverse
relation between demand and national income likely for such products?
Q4.9 ANSWER

Demand Analysis 81
Despite a lack of empirical evidence, the possibility of an inverse relation between
aggregate product demand and income has intrigued economists for a number of years.
This interest was originally created by an anomaly called the “potato paradox.” As
legend has it, a Victorian economist named Robert Giffen discovered that the potato
crop failure of 1845 so depressed Irish incomes that the poor had to actually increase
their consumption of the now higher-priced potatoes. Because they had to spend so
much on potatoes, a necessary staple, the poor couldn’t afford meat or other substitutes
and became even more dependent than before on potatoes. Thus, potatoes became
known as the classic case of the inferior or, “Giffen,” good. However, empirical
evidence casts serious doubt on the credibility of such a chain of events. After studying
Q4.10 In the United States, high-wage workers shun public transit and drive cars to work.
These same high-income individuals often support massive subsidies for public transit.
Use the concept of revealed preference to explain the public demand for transportation.
Can you explain this consumer behavior by high-income individuals?
Q4.10 ANSWER
High-wage workers often shun public transit and drive their cars to work. This stems

82 Chapter 4
SELF-TEST PROBLEMS AND SOLUTIONS
ST4.1 Individual Demand Curve. Alex P. Keaton is an ardent baseball fan. The following
table shows the relation between the number of games he attends per month during the
season and the total utility he derives from baseball game consumption:
Number of Baseball Games per Month
Total Utility
0
0
1
50
2
90
3
120
4
140
5
150
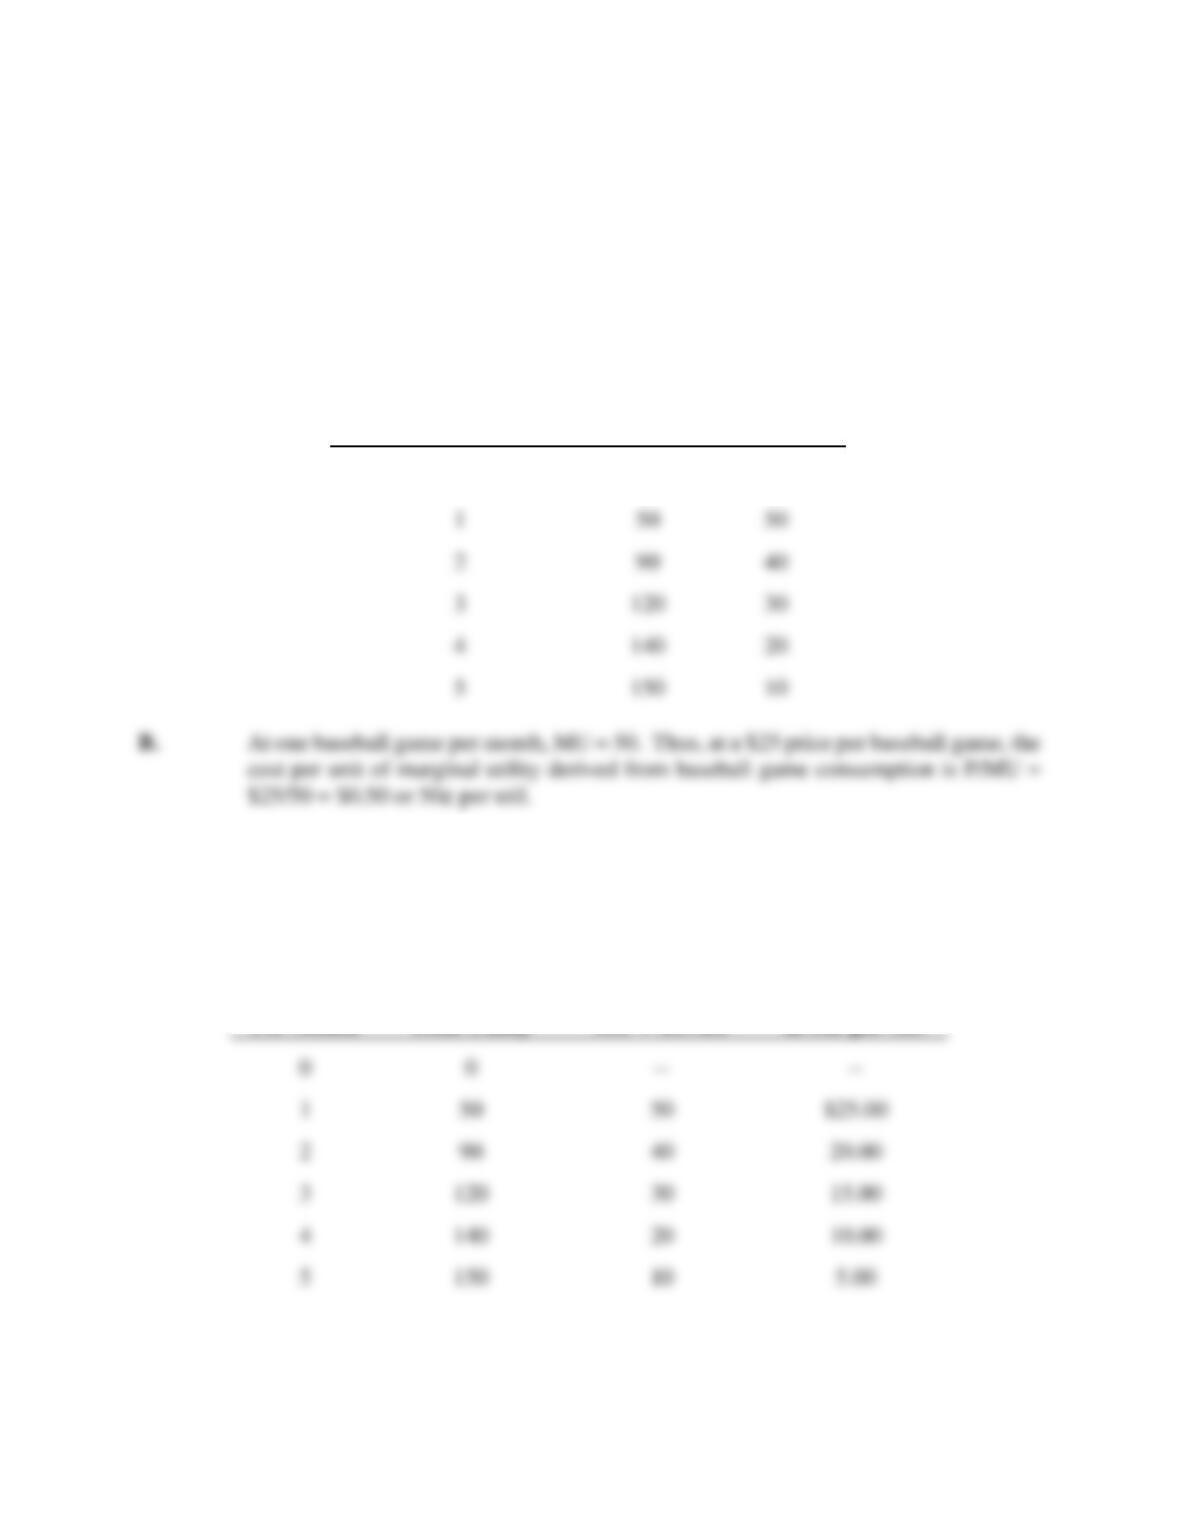
A. Construct a table showing Keaton’s marginal utility derived from baseball game
consumption.
B. At an average ticket price of $25, Keaton can justify attending only one game per
month. Calculate Keaton’s cost per unit of marginal utility derived from baseball
game consumption at this activity level.
C. If the cost/marginal utility trade-off found in part B represents the most Keaton is
willing to pay for baseball game consumption, calculate the prices at which he
would attend two, three, four, and five games per month.
Demand Analysis 83
D. Plot Keaton’s baseball game demand curve.
ST4.1 SOLUTION
A.
Number of Baseball
Games Per Month
Total
Utility
Marginal
Utility
0
0
—
C. At a maximum acceptable price of 50¢ per util, Keaton’s maximum acceptable price for
baseball game tickets varies according to the following schedule:
Number
of Games
Per Month
Total Utility
Marginal
Utility
MU = ΔU/ΔG
Maximum
Acceptable
price
at 50¢ per MU
D. Keaton’s baseball ticket demand curve is:
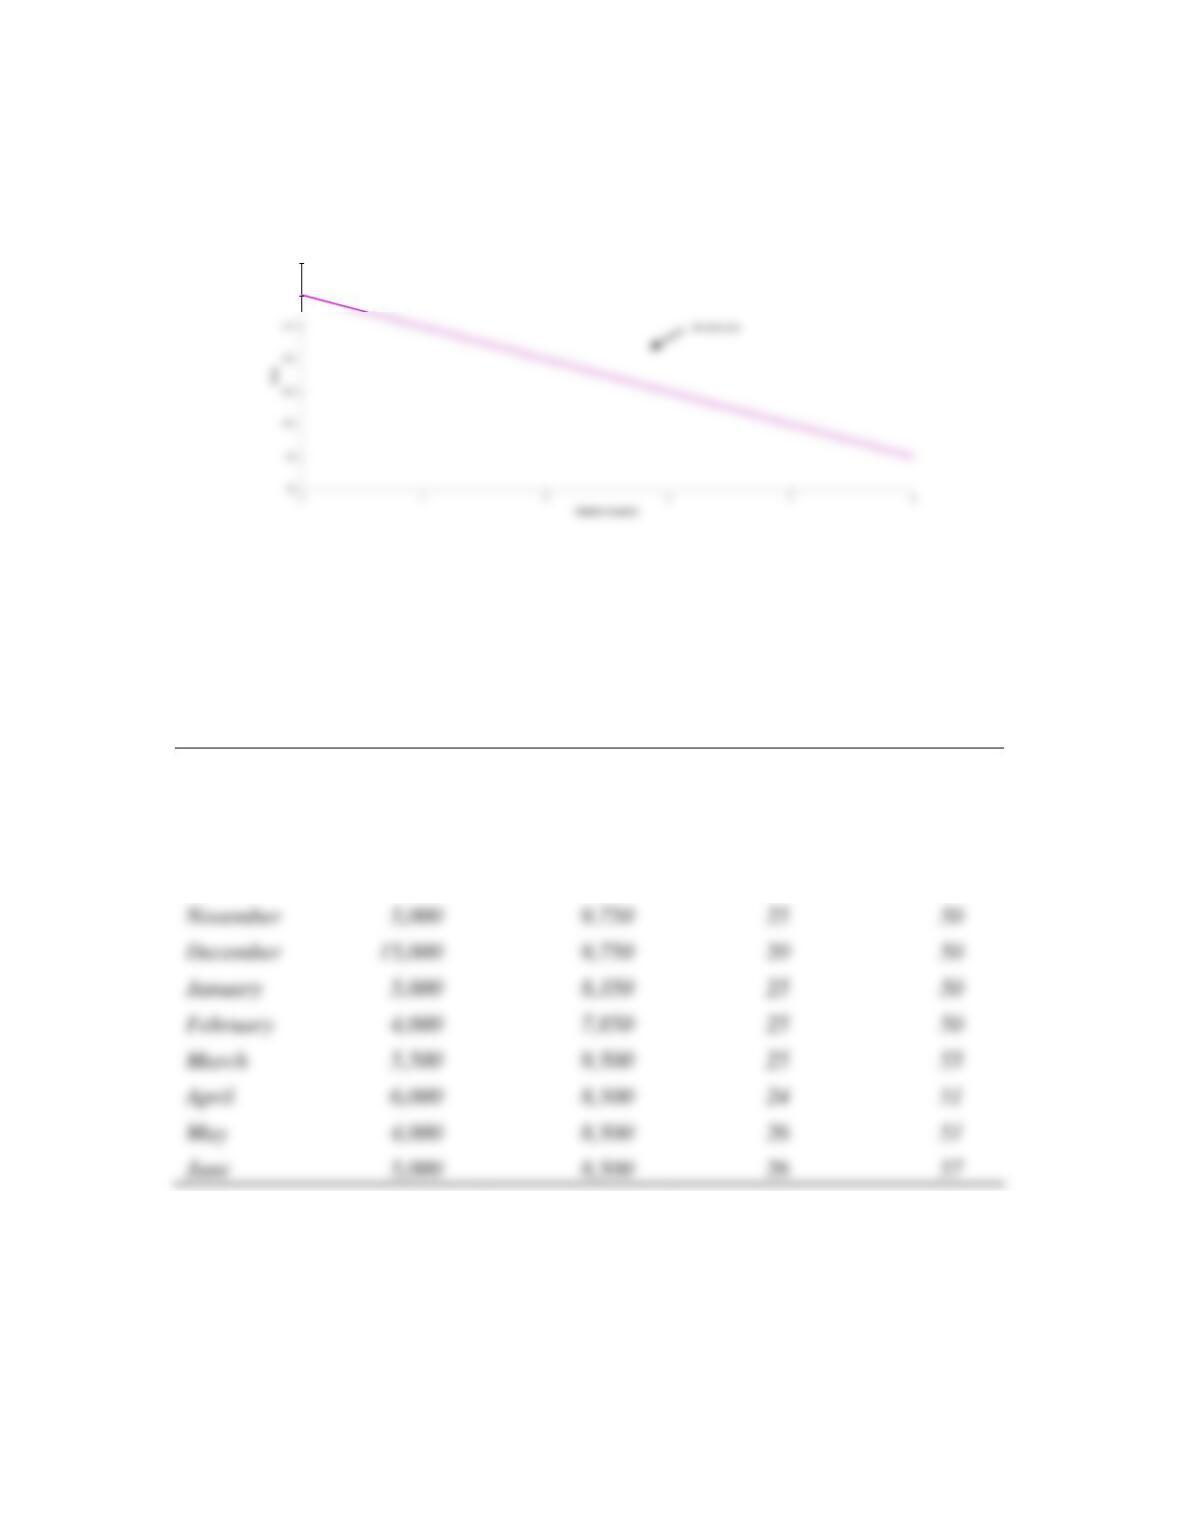
84 Chapter 4
Keaton’s Baseball Ticket Demand Curve
$30
$35
ST4.2 Elasticity Estimation. Distinctive Designs, Inc., imports and distributes dress and
sports watches. At the end of the company’s fiscal year, brand manager Charlie Pace
has asked you to evaluate sales of the sports watch line using the following data:
Month
Number of
Sports Watches
Sold
Sports Watch
Advertising
Expenditures
Sports Watch
Price, P
Dress Watch
Price, PD
July
4,500
$10,000
26
50
August
5,500
10,000
24
50
September
4,500
9,200
24
50
October
3,500
9,200
24
46
November
5,000
9,750
25
50
December
9,750
20
50
January
5,000
8,350
25
50
February
4,000
7,850
25
50
March
5,500
9,500
25
55
April
6,000
8,500
24
51
In particular, Pace has asked you to estimate relevant demand elasticities.
Remember that to estimate the required elasticities, you should consider months only
when the other important factors considered in the preceding table have not changed.
Also note that by restricting your analysis to consecutive months, changes in any
additional factors not explicitly included in the analysis are less likely to affect

Demand Analysis 85
A. Indicate whether there was or was not a change in each respective independent
variable for each month pair during the past year.
Month-Pair
Sports Watch
Advertising
Expenditures, A
Sports Watch
Price, P
Dress Watch
Price, PD
July-August
____________
____________
____________
August-September
____________
____________
____________
September-October
____________
____________
____________
October-November
____________
____________
____________
November-December
____________
____________
____________
____________
____________
____________
January-February
____________
____________
____________
February-March
____________
____________
____________
March-April
____________
____________
____________
May-June
____________
____________
____________
B. Calculate and interpret the average advertising arc elasticity of demand for sports
watches.
ST4.2 SOLUTION
A.
Month-Pair
Sports Watch
Advertising
Expenditures, A
Sports Watch
Price, P
Dress Watch
Price, PD

86 Chapter 4
B. In calculating the arc advertising elasticity of demand, only consider consecutive months
when there was a change in advertising but no change in the prices of sports and dress
watches:
August-September
January-February
Demand Analysis 87
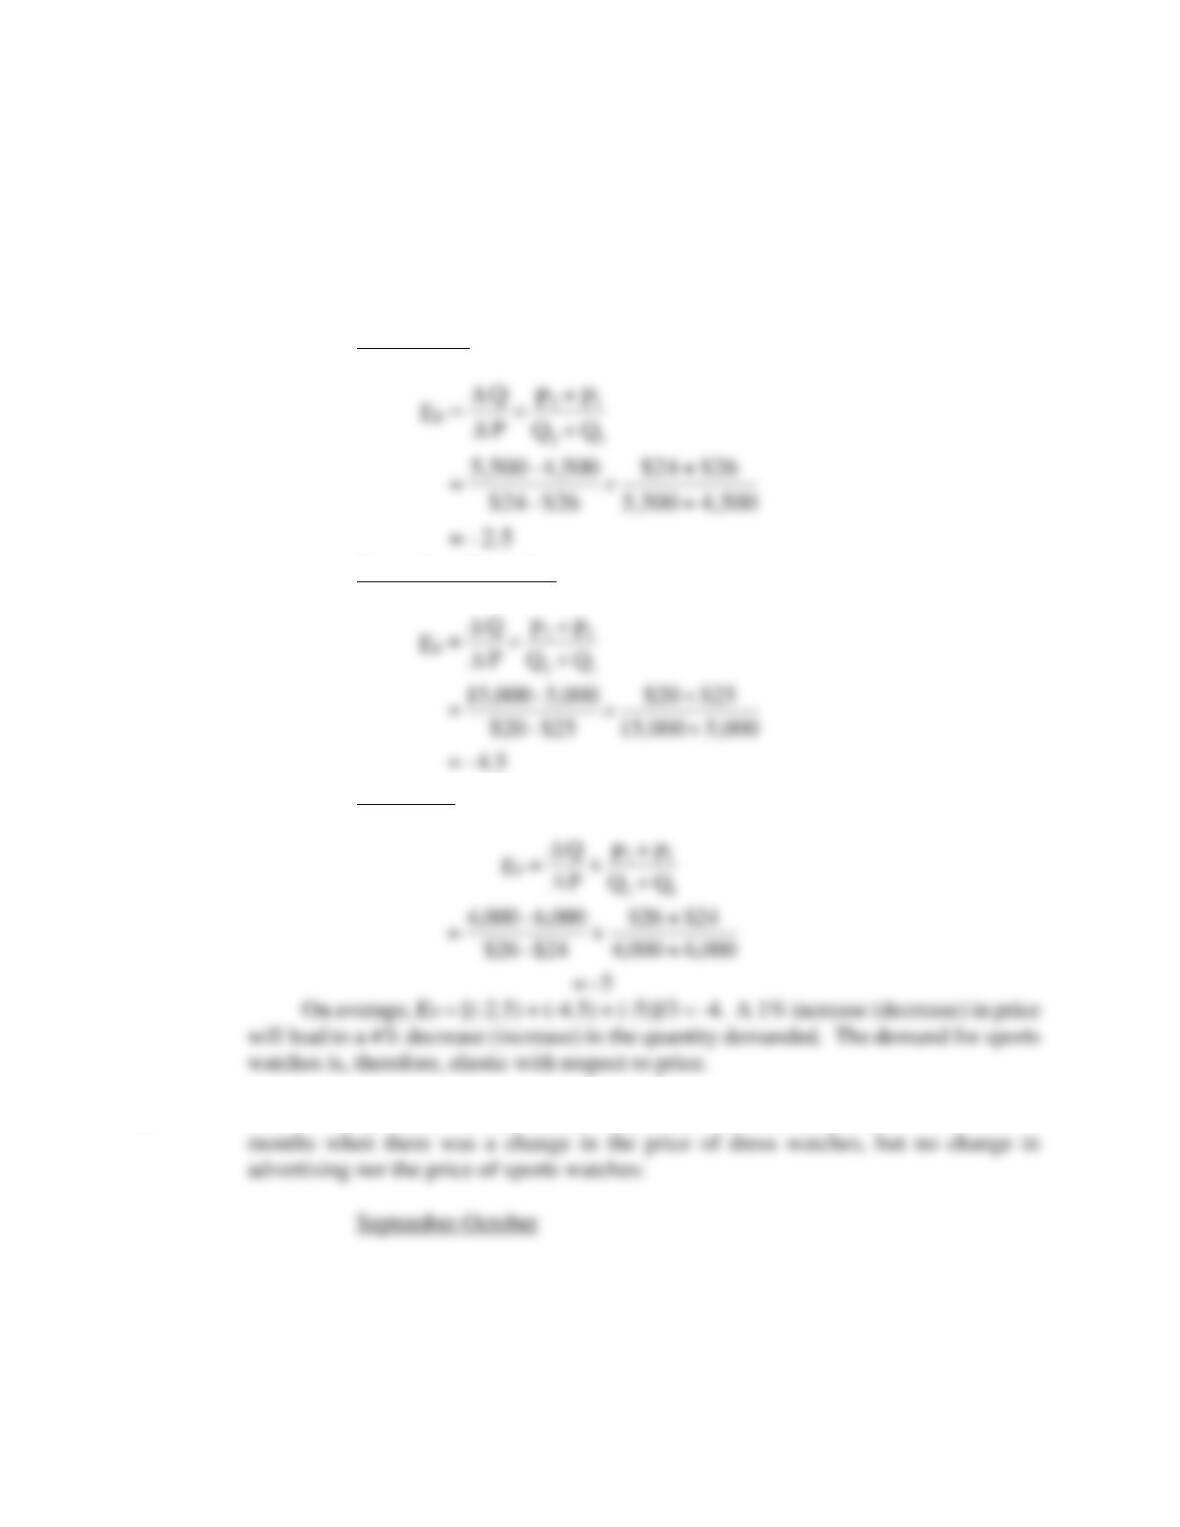
C. In calculating the arc price elasticity of demand, only consider consecutive months when
there was a change in the price of sports watches, but no change in advertising nor the
price of dress watches:
July-August
November-December
April-May
D. In calculating the arc cross-price elasticity of demand, we only consider consecutive
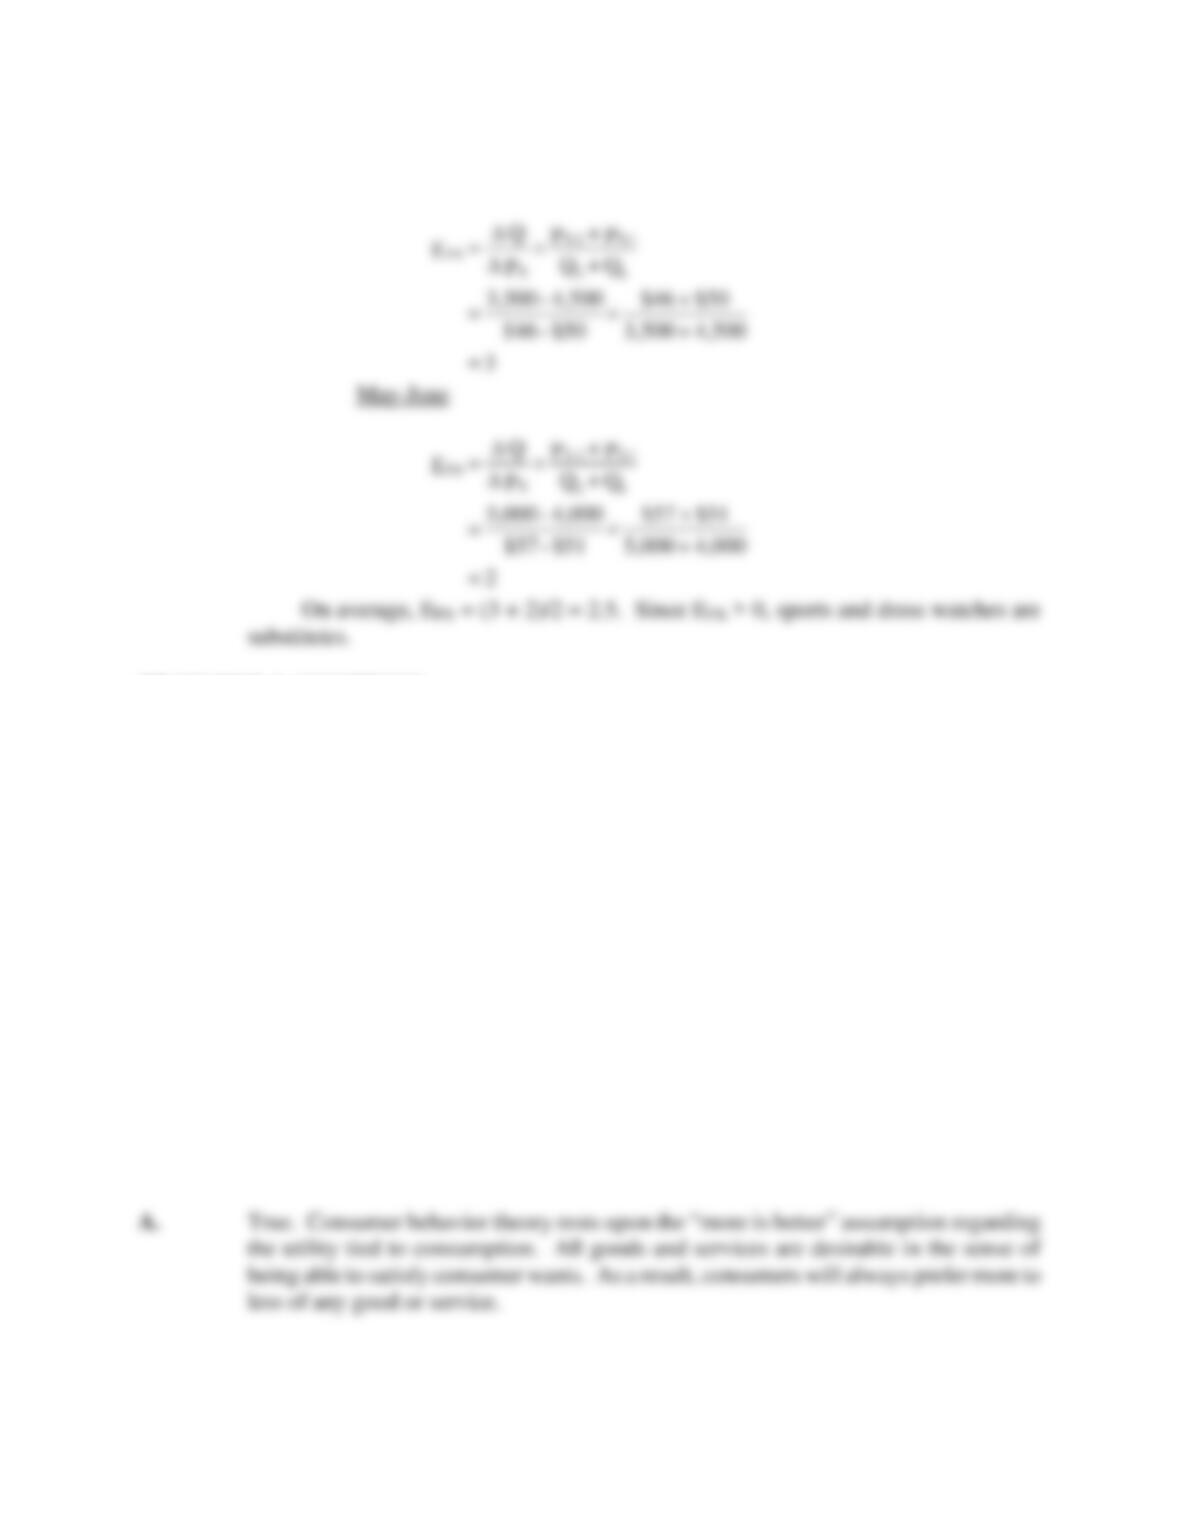
88 Chapter 4
PROBLEMS & SOLUTIONS
P4.1 Utility Theory. Determine whether each of the following statements is true or false.
Explain why.
A. According to the theory of consumer behavior, more is always better.
B. Consumers must understand how much one product is preferred over another in
order to rank-order consumption alternatives.
C. A market basket is a descriptive statement that relates satisfaction or well-being to
the consumption of goods and services.
D. The nonsatiation principle abstracts from time and place considerations.
E. Marginal utility measures the consumer’s overall level of satisfaction derived from
consumption activities
P4.1 SOLUTION

Demand Analysis 89
P4.2 Law of Diminishing Marginal Utility. Indicate whether each of the following statements
is true or false. Explain why.
A. The law of diminishing marginal utility states that as an individual increases
consumption of a given product within a set period of time, the utility gained from
consumption eventually declines.
B. When prices are held constant, a diminishing marginal utility for consumption
decreases the cost of each marginal unit of satisfaction.
C. Marginal utility measures the added satisfaction derived from a one-unit increase
in consumption, holding consumption of other goods and services constant.
D. When goods are relatively scarce, the law of diminishing marginal utility means
that the added value of another unit of goods will be small in relation to the added
value of another unit of services.
E. The law of diminishing marginal utility gives rise to a downward-sloping demand
curve for all goods and services.
P4.2 SOLUTION