CHAPTER 4 | Economic Efficiency,
Government Price Setting,
and Taxes
Brief Chapter Summary and Learning Objectives
4.1 Consumer Surplus and Producer Surplus (pages 110–114)
Distinguish between the concepts of consumer surplus and producer surplus.
4.2 The Efficiency of Competitive Markets (pages 115–117)
4.3 Government Intervention in the Market: Price Floors and Price Ceilings
(pages 117–125)
Explain the economic effect of government-imposed price floors and price ceilings.
4.4 The Economic Effect of Taxes (pages 125–131)
Analyze the economic effect of taxes.
▪ A tax on the sale of a good or service results in a reduction of economic efficiency.
Appendix: Quantitative Demand and Supply Analysis (pages 141–145)
Use quantitative demand and supply analysis.
Key Terms
Black market, p. 122. A market in which
buying and selling take place at prices that
to pay for a good or service and the actual price
the consumer pays.
CHAPTER 4 | Economic Efficiency, Government Price Setting, and Taxes 73
Economic efficiency, p. 117. A market outcome
in which the marginal benefit to consumers of the
last unit produced is equal to its marginal cost of
Price ceiling, p. 110. A legally determined
maximum price that sellers may charge.
Chapter Outline
The Sharing Economy, Phone Apps, and Rent Control
Internet companies created rental markets for the short-term use of products including apartments, cars,
boats and bicycles. Short-term housing suppliers earn money by renting their house, apartment or room
for a few days. By 2015, more than 25 million people had rented apartments through the peer–to-peer
4.1
Consumer Surplus and Producer Surplus (pages 110–114)
Learning Objective: Distinguish between the concepts of consumer surplus and producer
surplus.
A price ceiling is a legally determined maximum price that sellers may charge. A price floor is a legally
determined minimum price that sellers may receive.
A. Consumer Surplus
Consumer surplus is the difference between the highest price a consumer is willing to pay for a good or
service and the actual price the consumer pays. The demand curve can be used to measure the total
74 CHAPTER 4 | Economic Efficiency, Government Price Setting, and Taxes
B. Producer Surplus
Supply curves show the willingness of firms to supply a product at different prices. Firms will supply an
additional unit of a product only if they receive a price equal to the additional cost of producing that unit.
C. What Consumer Surplus and Producer Surplus Measure
Consumer surplus measures the net benefit to consumers from participating in a market, rather than the
total benefit. Similarly, producer surplus measures the net benefit received by producers from
participating in a market.
Teaching Tips
Ask students if they ever bought something they thought was a bargain, or to recall a purchase a friend or
Extra Solved Problem 4.1
Consumer Surplus and Producer Surplus for the NFL Sunday Ticket
DirecTV and the DISH Network are both providers of satellite television service, but only DirecTV offers
its customers the option of subscribing to the NFL Sunday Ticket. In 2015, subscribers to this service paid
Use this information to estimate consumer and producer surplus for the NFL Sunday Ticket.
Solving the Problem
Step 1: Review the chapter material.
This problem is about consumer surplus and producer surplus, so you may want to review the
CHAPTER 4 | Economic Efficiency, Government Price Setting, and Taxes 75
Step 2: Calculate the maximum price a consumer would pay for the NFL Sunday Ticket.
The consumers who benefit most from the NFL Sunday Ticket are those who have the
Step 3: Estimate the value of consumer surplus.
For this fan an estimate of his consumer surplus is: $1,373.28 − $251.94 = $1,121.34.
Step 4: Caluclate the minimum price DirecTV would accept for the NFL Sunday Ticket.
The NFL Package is offered to DirecTV customers as an additional viewing option.
4.2
The Efficiency of Competitive Markets (pages 115–117)
Learning Objective: Explain the concept of economic efficiency.
A competitive market is a market with many buyers and sellers. An advantage of a market system is that
it results in efficient economic outcomes.
A. Marginal Benefit Equals Marginal Cost in Competitive Equilibrium
Equilibrium in a competitive market results in the economically efficient level of output, where marginal
benefit equals marginal cost.
B. Economic Surplus
Economic surplus is the sum of consumer surplus and producer surplus. In a competitive market, with
76 CHAPTER 4 | Economic Efficiency, Government Price Setting, and Taxes
D. Economic Surplus and Economic Efficiency
Consumer surplus measures the benefit to consumers from buying a particular product, and producer
surplus measures the benefit to firms from selling a particular product. Equilibrium in a competitive
market results in the greatest amount of economic surplus, or total net benefit to society, from the
People sometimes wonder how useful the concept of economic efficiency is when they observe that many
real-world markets are not very competitive; these markets do not have many buyers and sellers.
Government officials can take this line of thinking further and argue that if markets are not competitive,
price controls can be justified to improve economic efficiency. But price controls typically result in more
inefficiency, not less. History is replete with examples of price controls gone wrong. In 284 A.D., the
Roman emperor Diocletian fixed the maximum prices of beef, grain, and other items and imposed the
death penalty on anyone who charged higher prices. These controls ultimately failed, and the death
Extra Solved Problem 4.2
What the American Colonies Gave up as Part of the British Empire
Before the American Revolution, the British required that American colonies follow certain rules known
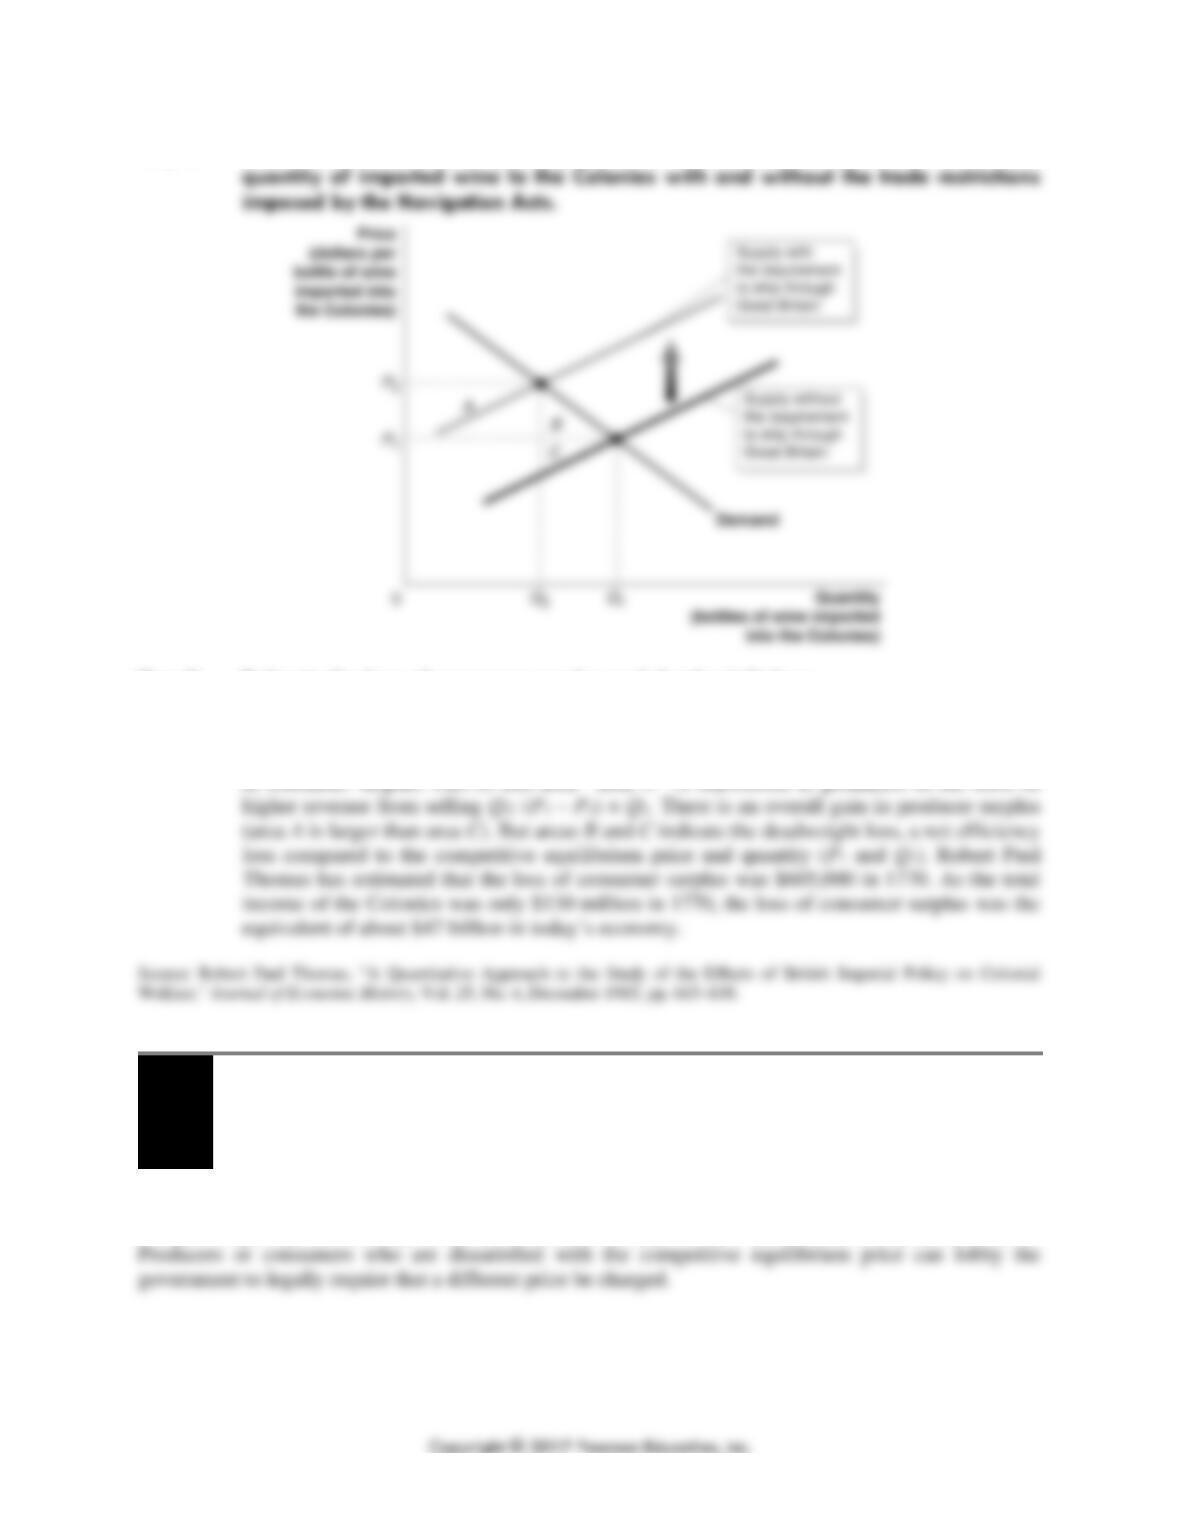
Draw a graph to show the loss in economic efficiency from the Navigation Acts on the importation of
wine into New York.
Solving the Problem
Step 1: Review the chapter material.
CHAPTER 4 | Economic Efficiency, Government Price Setting, and Taxes 77
Step 2: Draw a demand and supply graph that illustrates the equilibrium price and
Step 3: Estimate the loss of consumer surplus and deadweight loss.
The imposition of the Navigation Acts’ restrictions on trade caused the supply curve to shift
to the left. As a result, the equilibrium price was greater, and the equilibrium quantity less,
than they would have been in the absence of the restrictions. Areas A and B represent the loss
4.3
Government Intervention in the Market: Price Floors and Price Ceilings
(pages 117–125)
Learning Objective: Explain the economic effect of government-imposed price floors
and price ceilings.
Not every individual is better off if a market is at its competitive equilibrium. Any producer would rather
charge a higher price, and any consumer would rather pay a lower price than the equilibrium price.
78 CHAPTER 4 | Economic Efficiency, Government Price Setting, and Taxes
A. Price Floors: Government Policy in Agricultural Markets
During the Great Depression many farmers were unable to sell their products or could sell them only at very
low prices. Farmers convinced the federal government to intervene to set price floors for agricultural
B. Price Ceilings: Government Rent Control Policy in Housing Markets
Support for governments setting price ceilings typically comes from consumers. New York is one of the
cities that impose rent control, which puts a ceiling on the maximum rent that landlords can charge for an
apartment. A price ceiling, such as rent control, reduces economic efficiency.
C. Black Markets and Peer-to-Peer Sites
Because rent control leads to a shortage of apartments, renters who would otherwise not be able to find
apartments have an incentive to offer landlords rents above the legal maximum. Where governments try
D. The Results of Government Price Controls: Winners, Losers, and Inefficiency
When the government imposes price floors or price ceilings, some people win, some people lose, and
there is a loss of economic efficiency. The winners with rent control are those who pay less for rent.
E. Positive and Normative Analysis of Price Ceilings and Price Floors
Economists are generally skeptical of government attempts to interfere with competitive market
4.4
The Economic Effect of Taxes (pages 125–131)
Learning Objective: Analyze the economic effect of taxes.
When the government taxes a good or service, it affects the market equilibrium for that good or service.
One result of a tax is a decline in economic efficiency.
A. The Effect of Taxes on Economic Efficiency
When a government taxes a good or service, less of that good or service will be sold. Demand and supply
curves are used to describe the deadweight loss that results from a tax. The true burden of a tax is the
CHAPTER 4 | Economic Efficiency, Government Price Setting, and Taxes 79
B. Tax Incidence: Who Actually Pays a Tax?
Tax incidence is the actual division of the burden of a tax between buyers and sellers in a market.
The incidence of a tax does not depend on whether a tax is collected from the buyers of a good or from
the sellers.
Extra Economics in Your Life:
Should People Be Allowed to Scalp Concert Tickets?
Ticketmaster has begun to offer “paperless” entry as an alternative to physical tickets for concerts by
music superstars such as Garth Brooks, Miley Cyrus, and Justin Bieber. These performers and
professional sports teams have begun adopting “paperless ticketing” for some or all of the seats sold for
Sources: Adam Vaccaro, “From Concert Goers to Big Business Concerns, Inside the Fight Over Paperless Tickets,” Boston.com,
January 10, 2015; and Paul Farhi, “‘Paperless ticketing’ aims to thwart scalping at concerts, sports events,” Washington Post,
July 5, 2010.
Question: Does paperless ticketing benefit consumers more than traditional ticketing that allows tickets
to be resold?
Answer: Many economists believe that reselling tickets—“scalping”—promotes economic efficiency.
80 CHAPTER 4 | Economic Efficiency, Government Price Setting, and Taxes
Appendix
Quantitative Demand and Supply Analysis (pages 141–145)
Learning Objective: Use quantitative demand and supply analysis.
Demand and Supply Equations
The first step in a quantitative analysis of demand and supply is to supplement the use of demand and
supply curves with demand and supply equations. For example, suppose that economists have estimated
that the demand for apartments in New York City is
We can use this equation to solve for the equilibrium monthly apartment rent by setting the quantity
demanded equal to the quantity supplied:
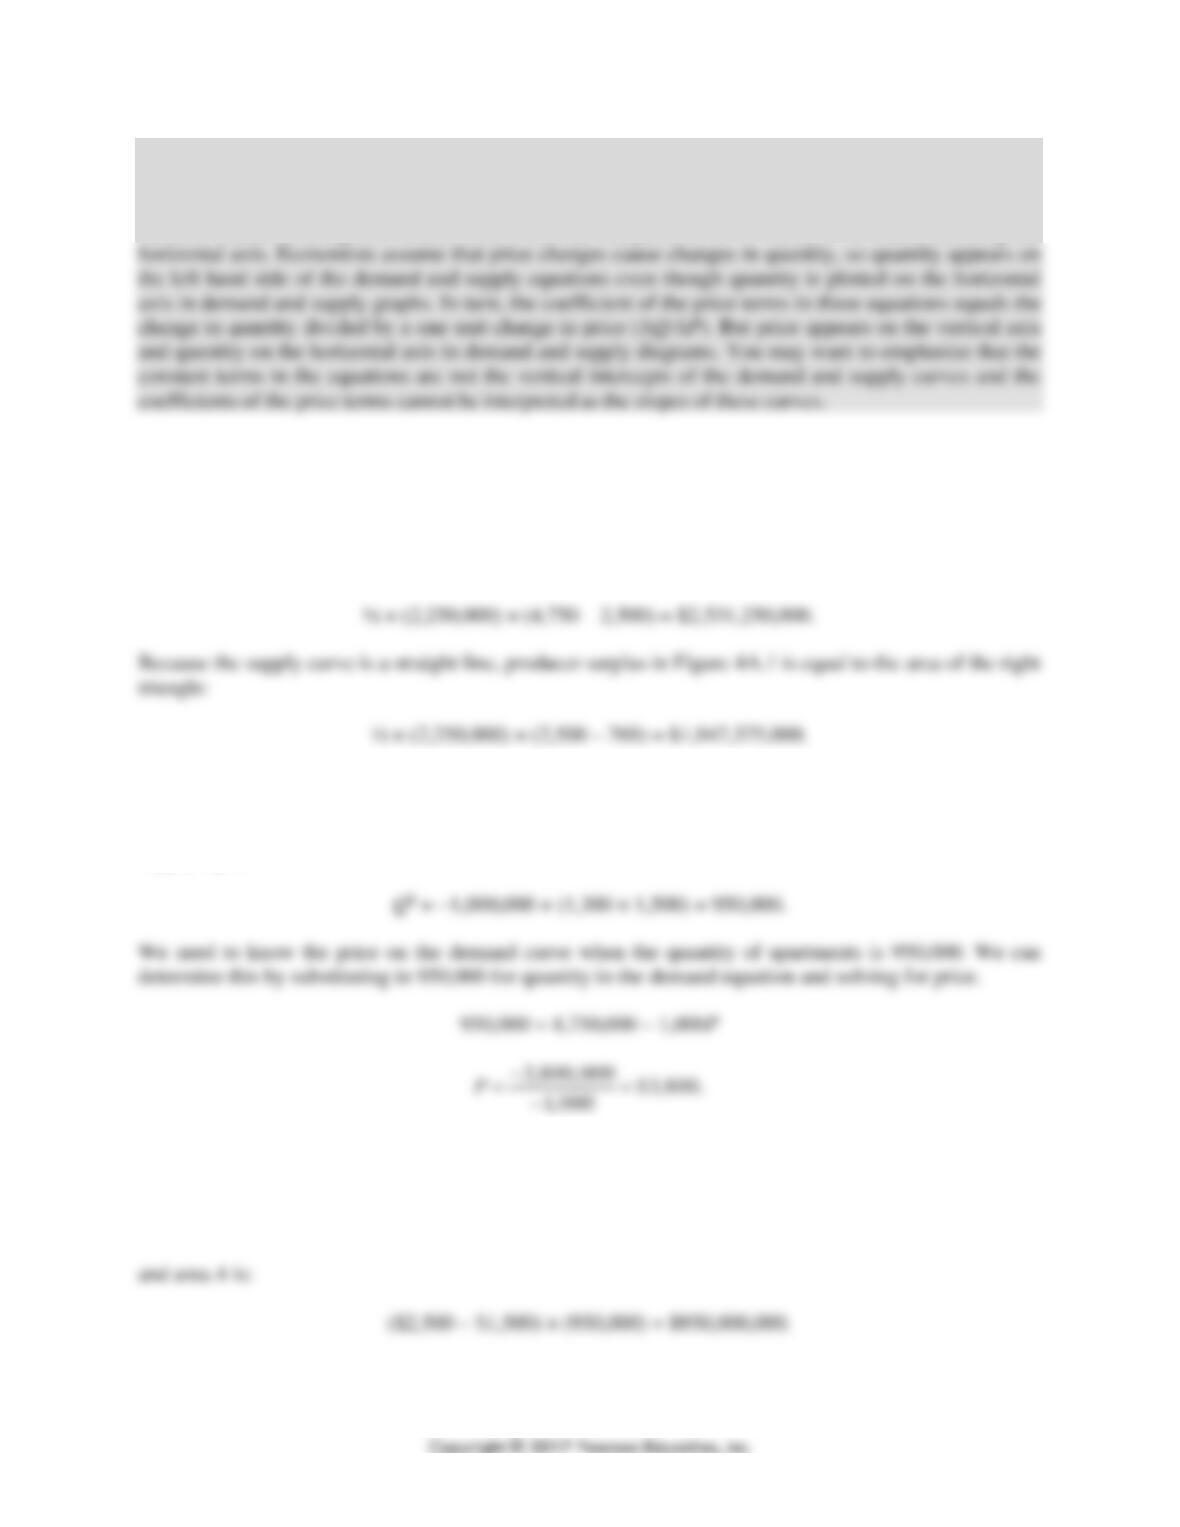
4,750,000 − 1,000P = −1,000,000 + 1,300P
5,750,000P = 2,300P
5,750,000 $2,500
P==
and
QS = 0 = −1,000,000 + 1,300P
1,000,000 $769.23.
1,300
P−
==
CHAPTER 4 | Economic Efficiency, Government Price Setting, and Taxes 81
Teaching Tips
The equations highlight an oddity of demand and supply analysis that is lost on students unless they have
a solid background in mathematics. The dependent variable in most graphs is the “Y variable,” the
variable measured along the vertical axis, while the independent or “X variable” is measured along the
Calculating Consumer Surplus and Producer Surplus
We can use the values from the demand and supply equations to calculate the value of consumer surplus
and producer surplus. Consumer surplus is the area below the demand curve and above the line
representing price. This area forms a right triangle because the demand curve is linear (see Figure 4A.1).
In this case the area is:
The same analysis can be used to measure the impact of rent control on consumer surplus, producer
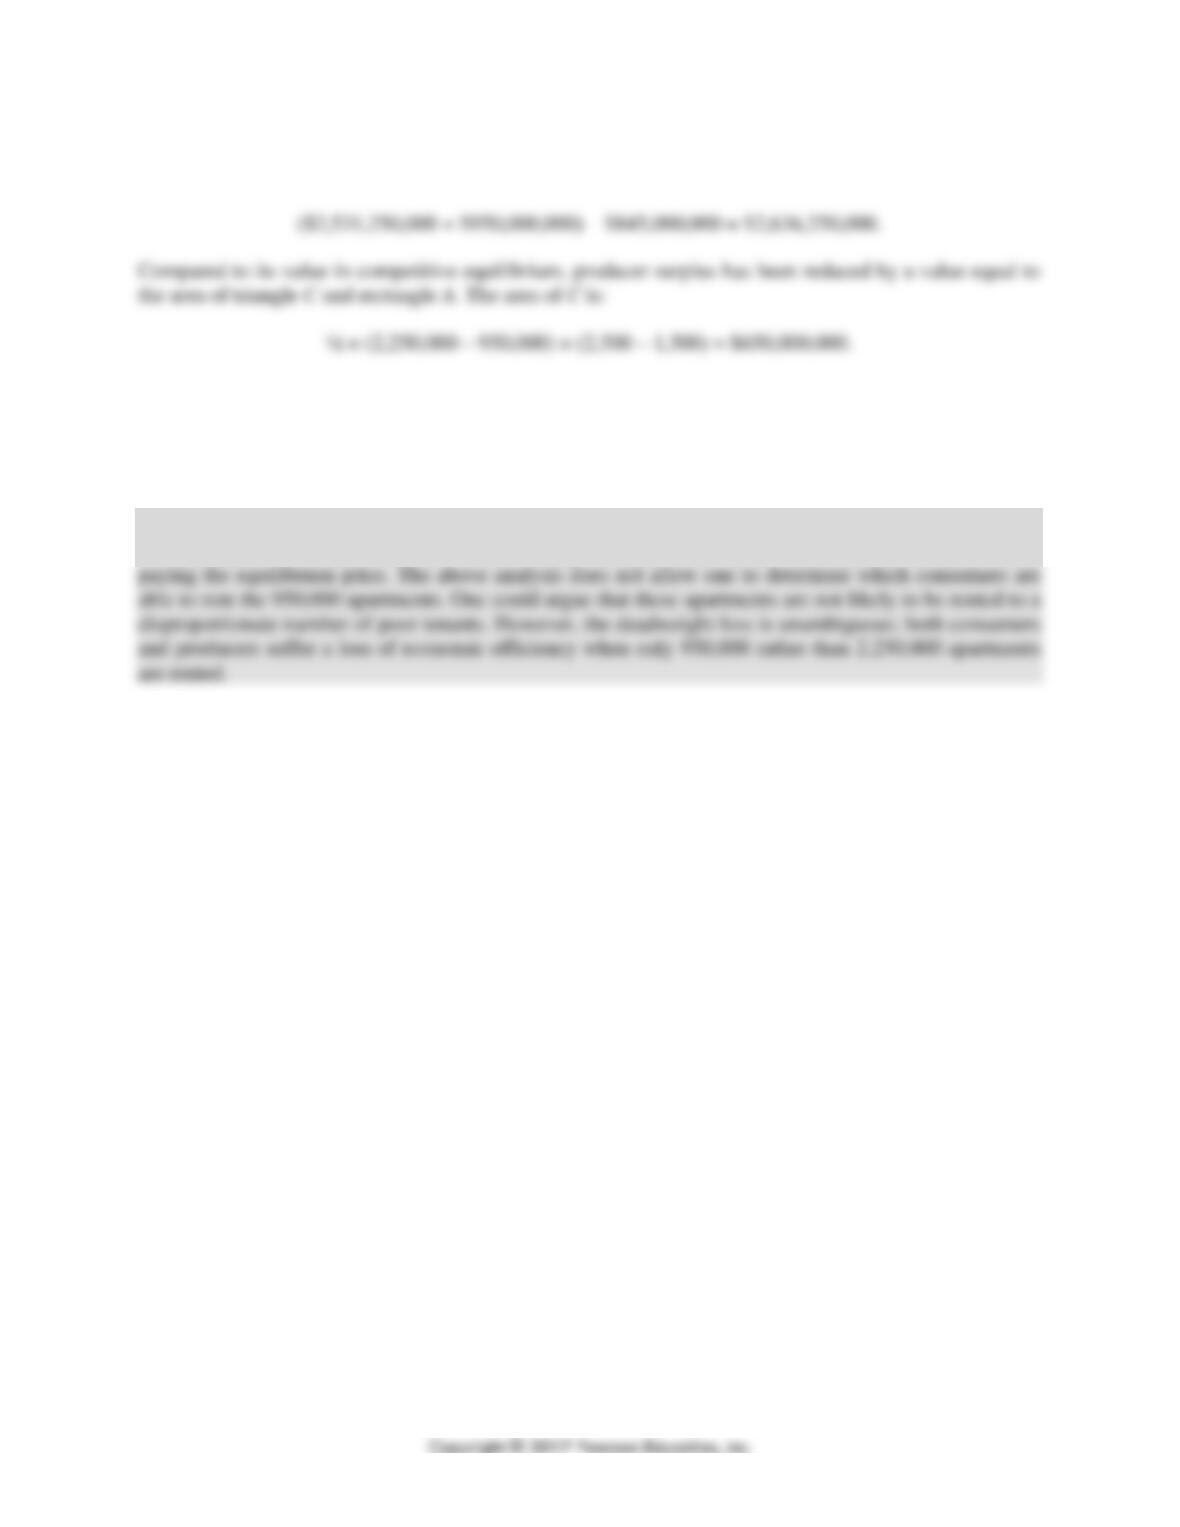
surplus, and economic efficiency. Suppose the city imposes a rent ceiling of $1,500 per month. We can
calculate the quantity of apartments that will be rented by substituting the rent ceiling of $1,500 into the
supply equation:
Compared with its value in competitive equilibrium, consumer surplus has been reduced by the area of
the triangle B in Figure 4A.2, but increased by the area of the rectangle A. The area of B is:
½ × (2,250,000 – 950,000) × (3,800 – 2,500) = $845,000,000,
82 CHAPTER 4 | Economic Efficiency, Government Price Setting, and Taxes
The value of consumer surplus in competitive equilibrium was $2,531,250,000. As a result of the ceiling
it will be:
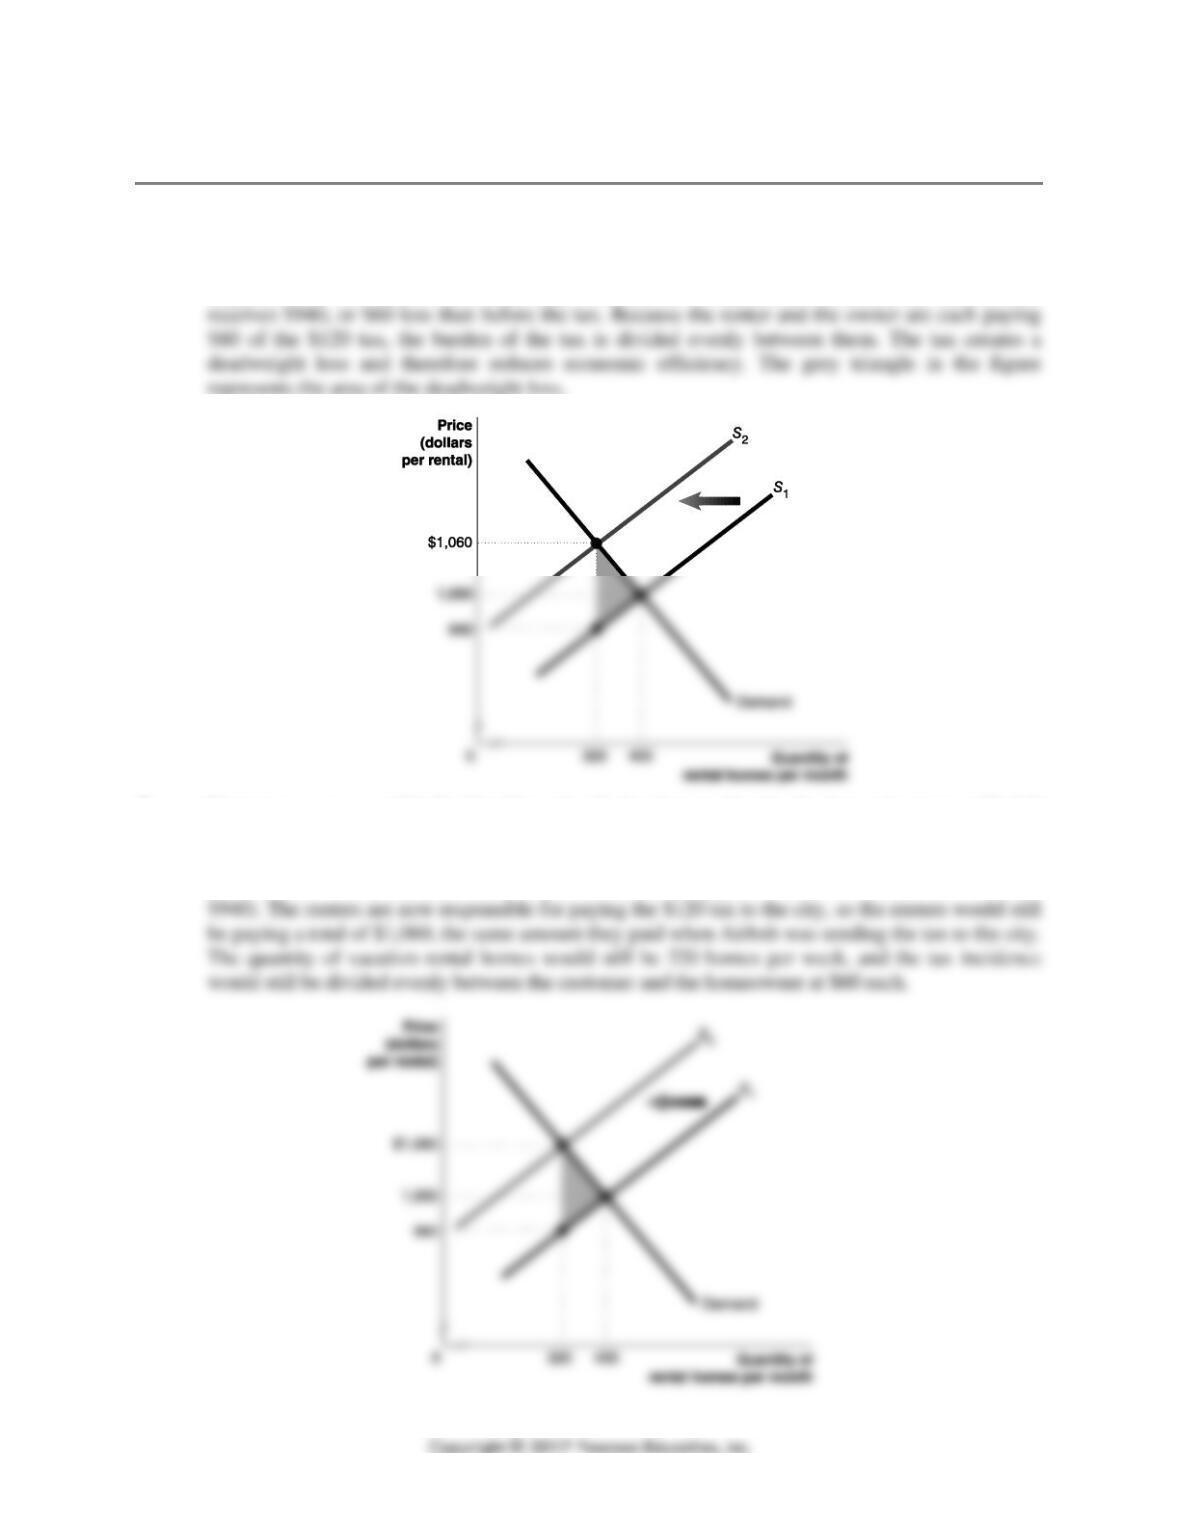
The loss of economic efficiency, as measured by the deadweight loss, is equal to the value represented by
the sum of areas B and C, or
$845,000,000 + $650,000,000 = $1,495,000,000.
Teaching Tips
Many students are inclined to believe rent ceilings are justified because they “protect the poor” from
CHAPTER 4 | Economic Efficiency, Government Price Setting, and Taxes 83
Solutions to End-of-Chapter Exercises
Answers to Thinking Critically Questions
1. The tax of 12% is equal to $120. The equilibrium price before the tax was $1,000. After the
imposition of the tax, the customer pays $1,060, or an additional $60, and the homeowner
2. If renters were responsible for directly paying the hotel tax to the city, the demand curve would shift
down by $120 instead of the supply curve shifting up by $120. The price renters pay to the
homeowners would be $940, which is how much the homeowners received in question 1. when we
assumed that Airbnb deducted the tax from the amount they paid to homeowners ($1,060 − $120 =
84 CHAPTER 4 | Economic Efficiency, Government Price Setting, and Taxes
4.1
Consumer Surplus and Producer Surplus
Learning Objective: Distinguish between the concepts of consumer surplus and producer
surplus.
Review Questions
1.1 Marginal benefit is the additional benefit to a consumer from consuming one more unit of a good
1.2 Marginal cost is the additional cost to a firm from producing one more unit of a good or service.
Supply curves show the willingness of firms to supply a product at different prices. The
1.3 Consumer surplus is the difference between the highest price a consumer is willing to pay and the
1.4 Producer surplus is the difference between the lowest price a firm would be willing to accept and
the price it actually receives. As the equilibrium price of the good rises, producer surplus rises. As
the price falls, producer surplus falls.
Problems and Applications
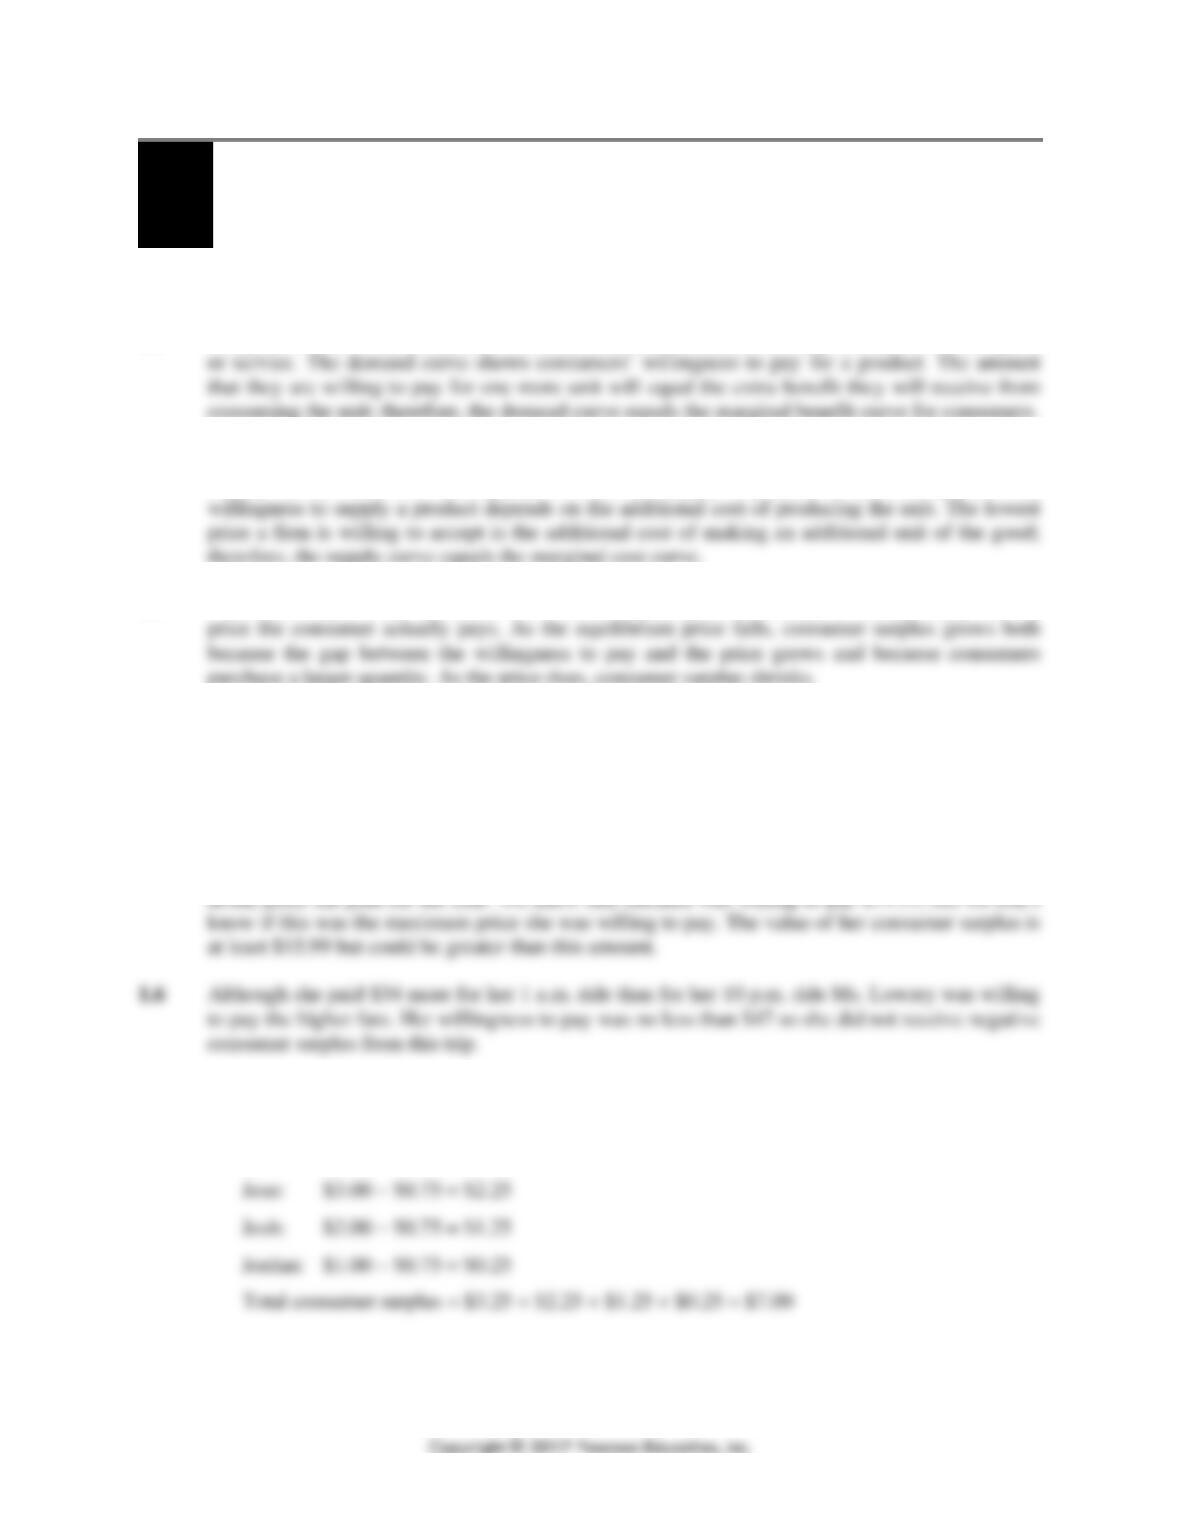
1.5 Consumer surplus is the difference between the highest price Melanie was willing to pay and the
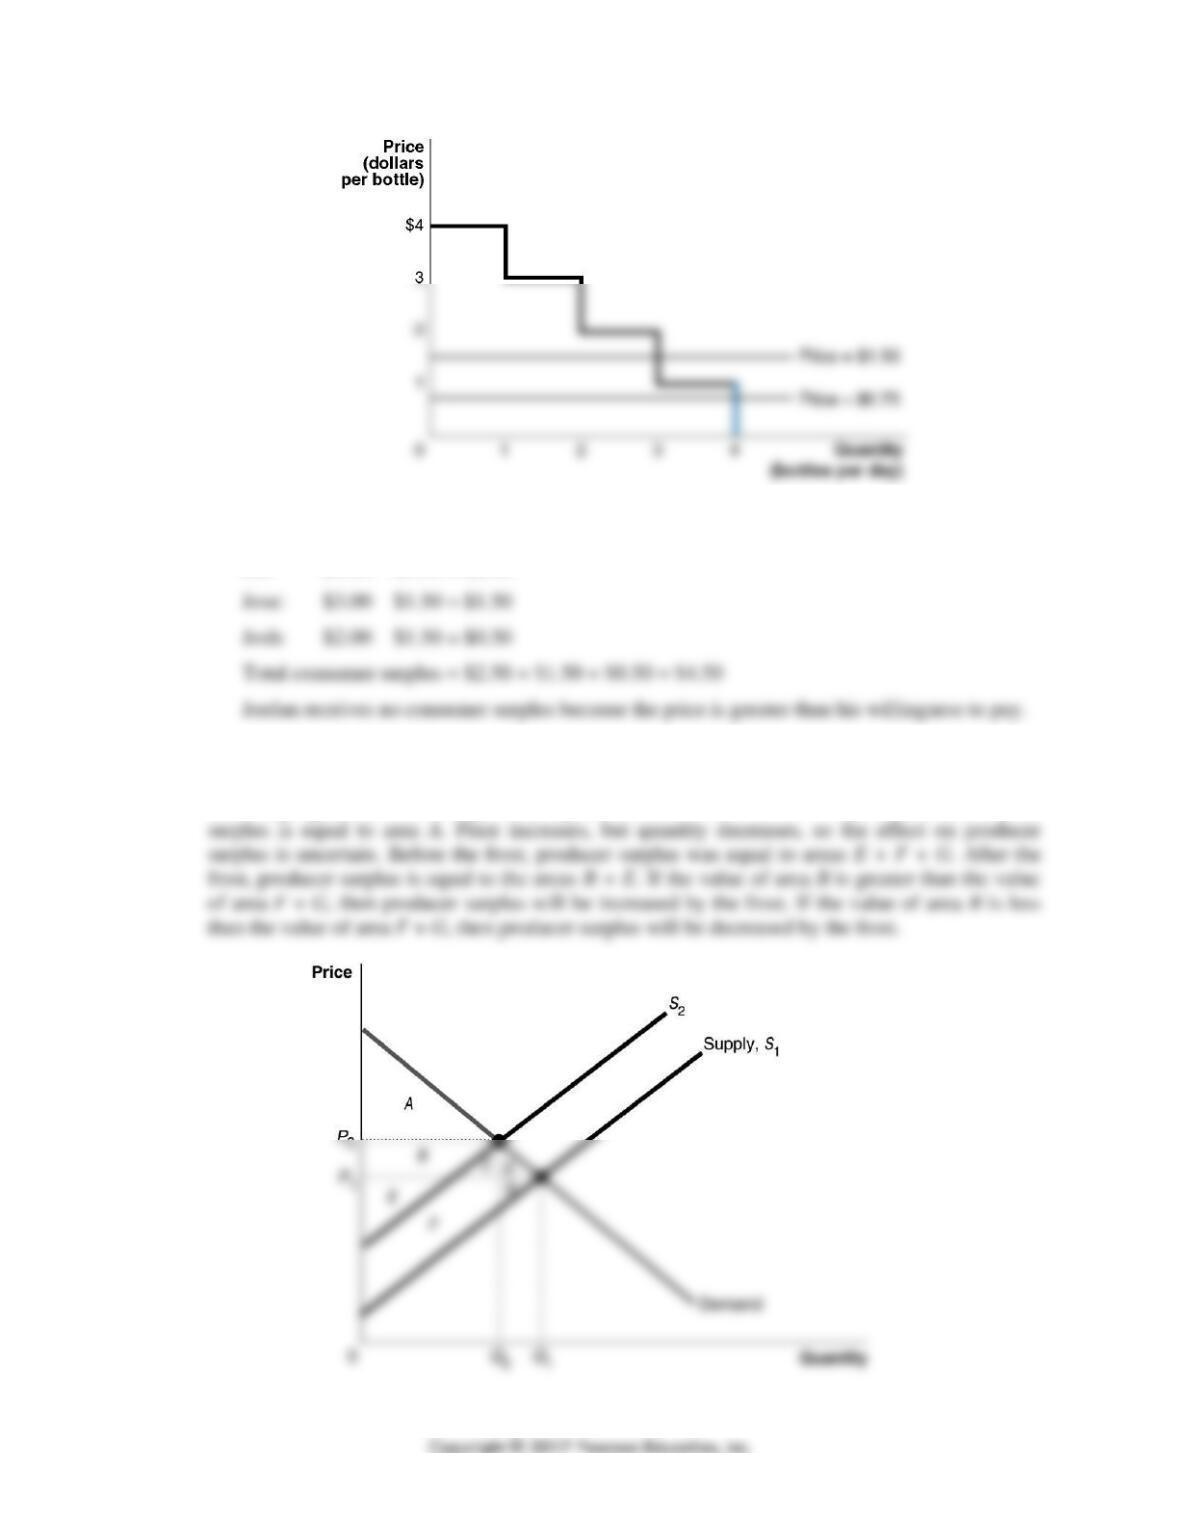
1.7 a. If the price of a bottle of orange juice is $0.75 per bottle then the consumer surplus received
by each consumer is:
Jill: $4.00 − $0.75 = $3.25
CHAPTER 4 | Economic Efficiency, Government Price Setting, and Taxes 85
b. If the price of a bottle of orange juice is $1.50 per bottle, then the consumer surplus received
by each consumer is:
Jill: $4.00 − $1.50 = $2.50
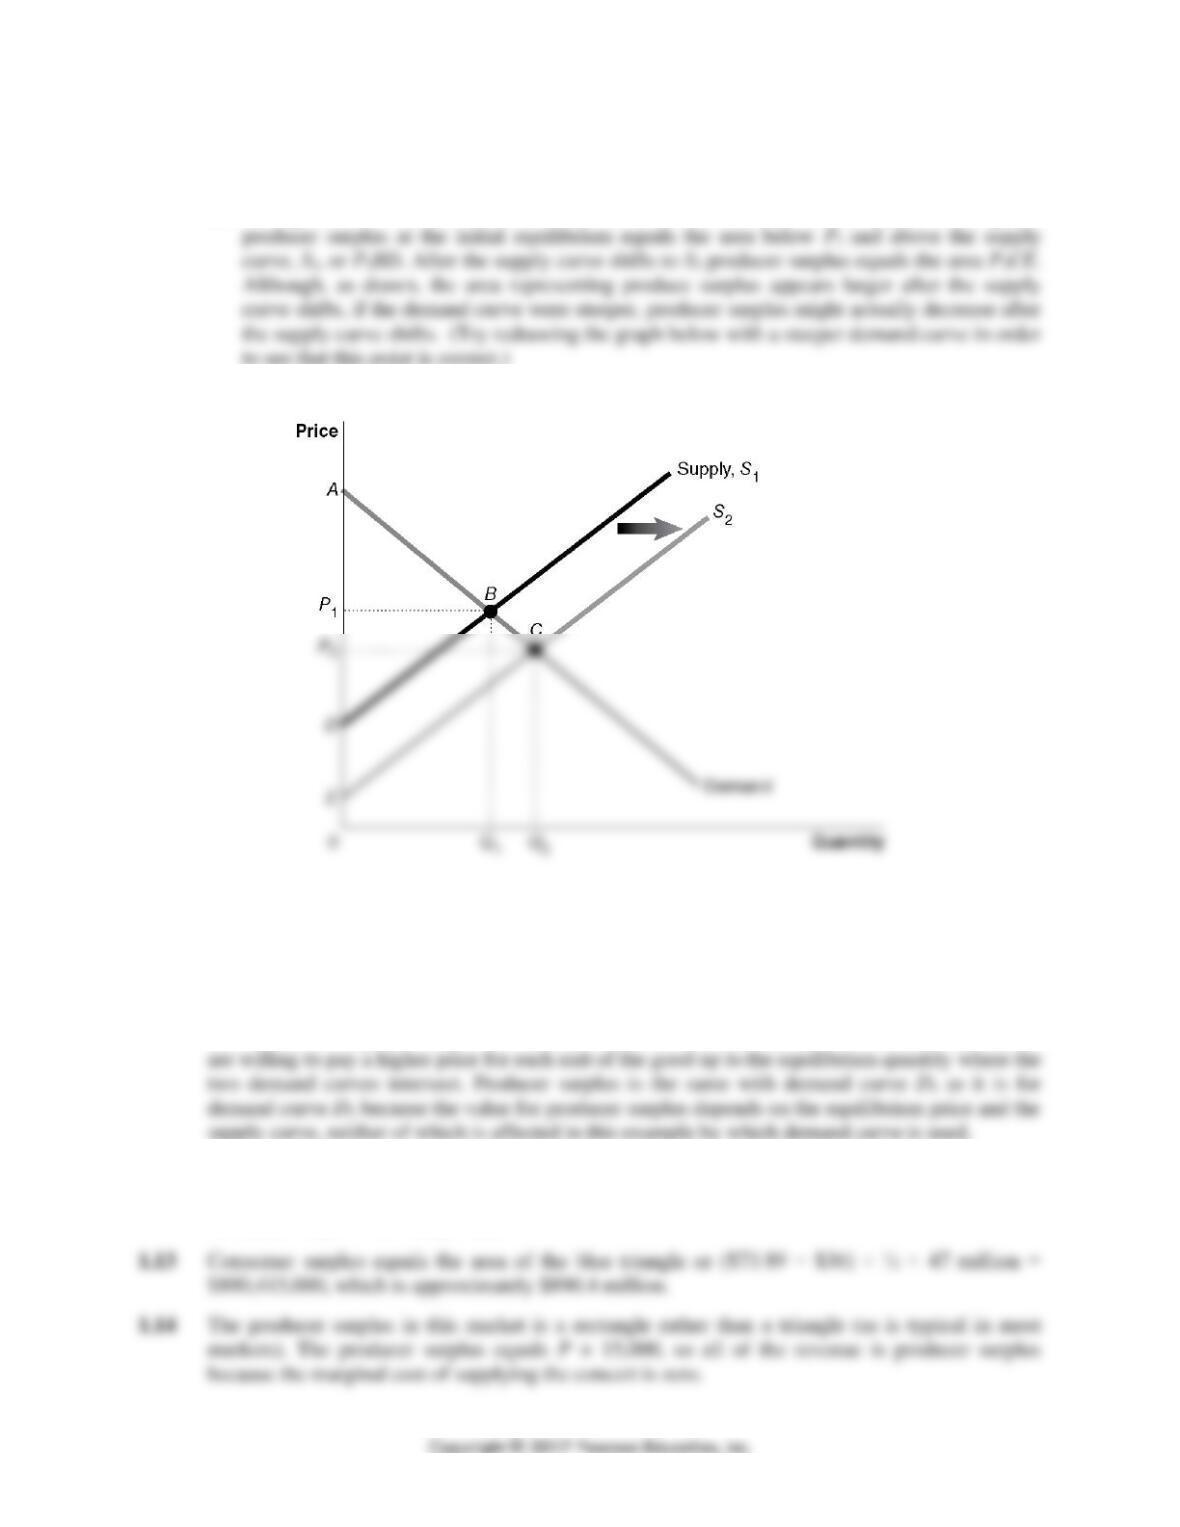
1.8 Because the frost will cause the equilibrium price to increase and the equilibrium quantity to
decrease, consumer surplus will decrease. Before the decline in supply caused by the frost, in the
following figure consumer surplus was equal to areas A + B + C + D. After the frost, consumer
86 CHAPTER 4 | Economic Efficiency, Government Price Setting, and Taxes
1.9 a. Consumer surplus will increase as consumers will buy more 4K televisions sets at a lower
price. In the following graph consumer surplus increases from area AP1B to AP2C.
b. Falling costs for 4K television sets may increase or decrease producer surplus. In the graph
1.10 The argument is incorrect. The price of the last unit sold equals the willingness of consumers to
pay for that unit, but on all previous units, the willingness of consumers to pay exceeds the
equilibrium price, and so there is consumer surplus.
1.11 The equilibrium price and quantity occurs where the demand curves intersect the supply curve.
The consumer surplus is larger with demand curve D1 than demand curve D2 because consumers
1.12 A vertical demand curve implies that there is no limit to the price consumers are willing to pay,
resulting in an infinite consumer surplus. In the markets we have studied up to this point,
consumer surplus was always finite.
CHAPTER 4 | Economic Efficiency, Government Price Setting, and Taxes 87
4.2
The Efficiency of Competitive Markets
Learning Objective: Understand the concept of economic efficiency.
Review Questions
2.1 Economic surplus is the sum of consumer surplus and producer surplus. Deadweight loss is
2.2 Economic efficiency occurs when the marginal benefit to consumers of the last unit produced
Problems and Applications
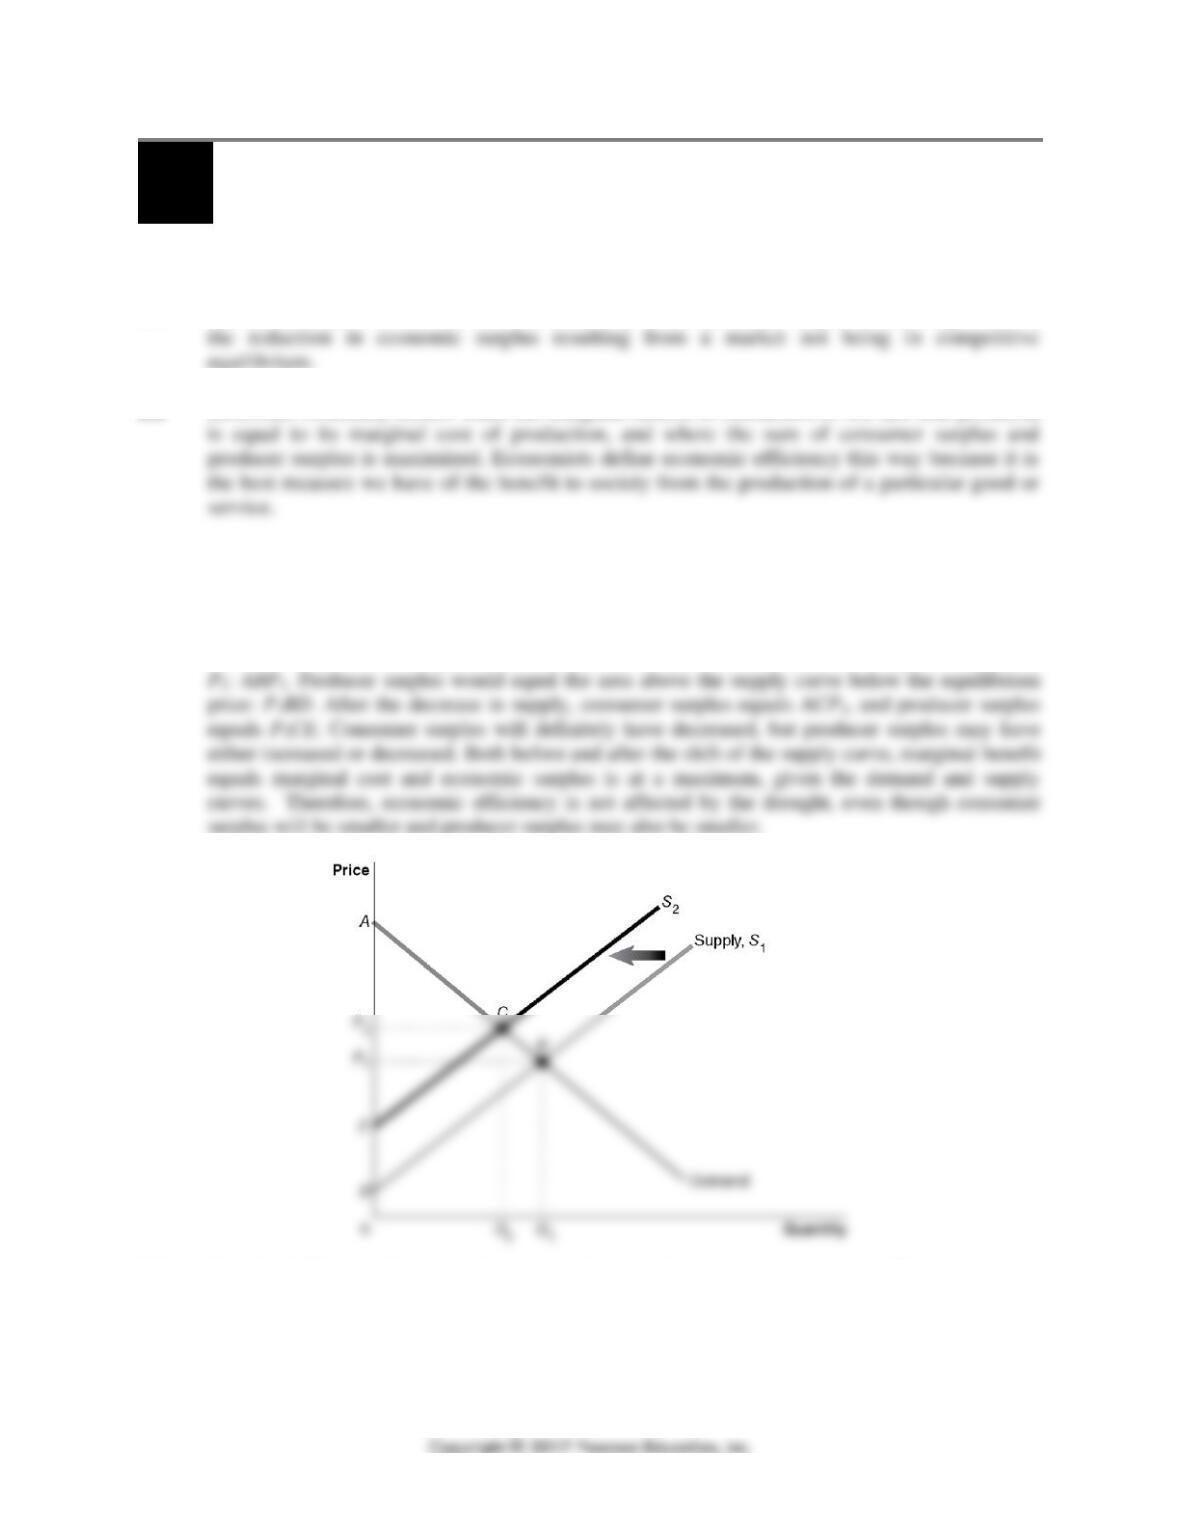
2.3 The drought would decrease the supply of tomatoes. In the following graph the effect of the
drought is shown by a shift in the supply curve from S1 to S2. Prior to the decrease in supply,
consumer surplus would equal the area under the demand curve and above the equilibrium price,
2.4 You should disagree because a lower price doesn’t always increase economic efficiency. A price
that is lower than the equilibrium price decreases economic efficiency in the market. When the
price is below equilibrium, suppliers decrease the quantity supplied, and the marginal benefit
exceeds the marginal cost of an additional unit of the good. Therefore, economic efficiency will
have decreased.