Chapter 4
Population and Economic Growth
Note: Special icons in the margin identify problems requiring a computer or calculator and those
requiring calculus .
◼ Solutions to Problems
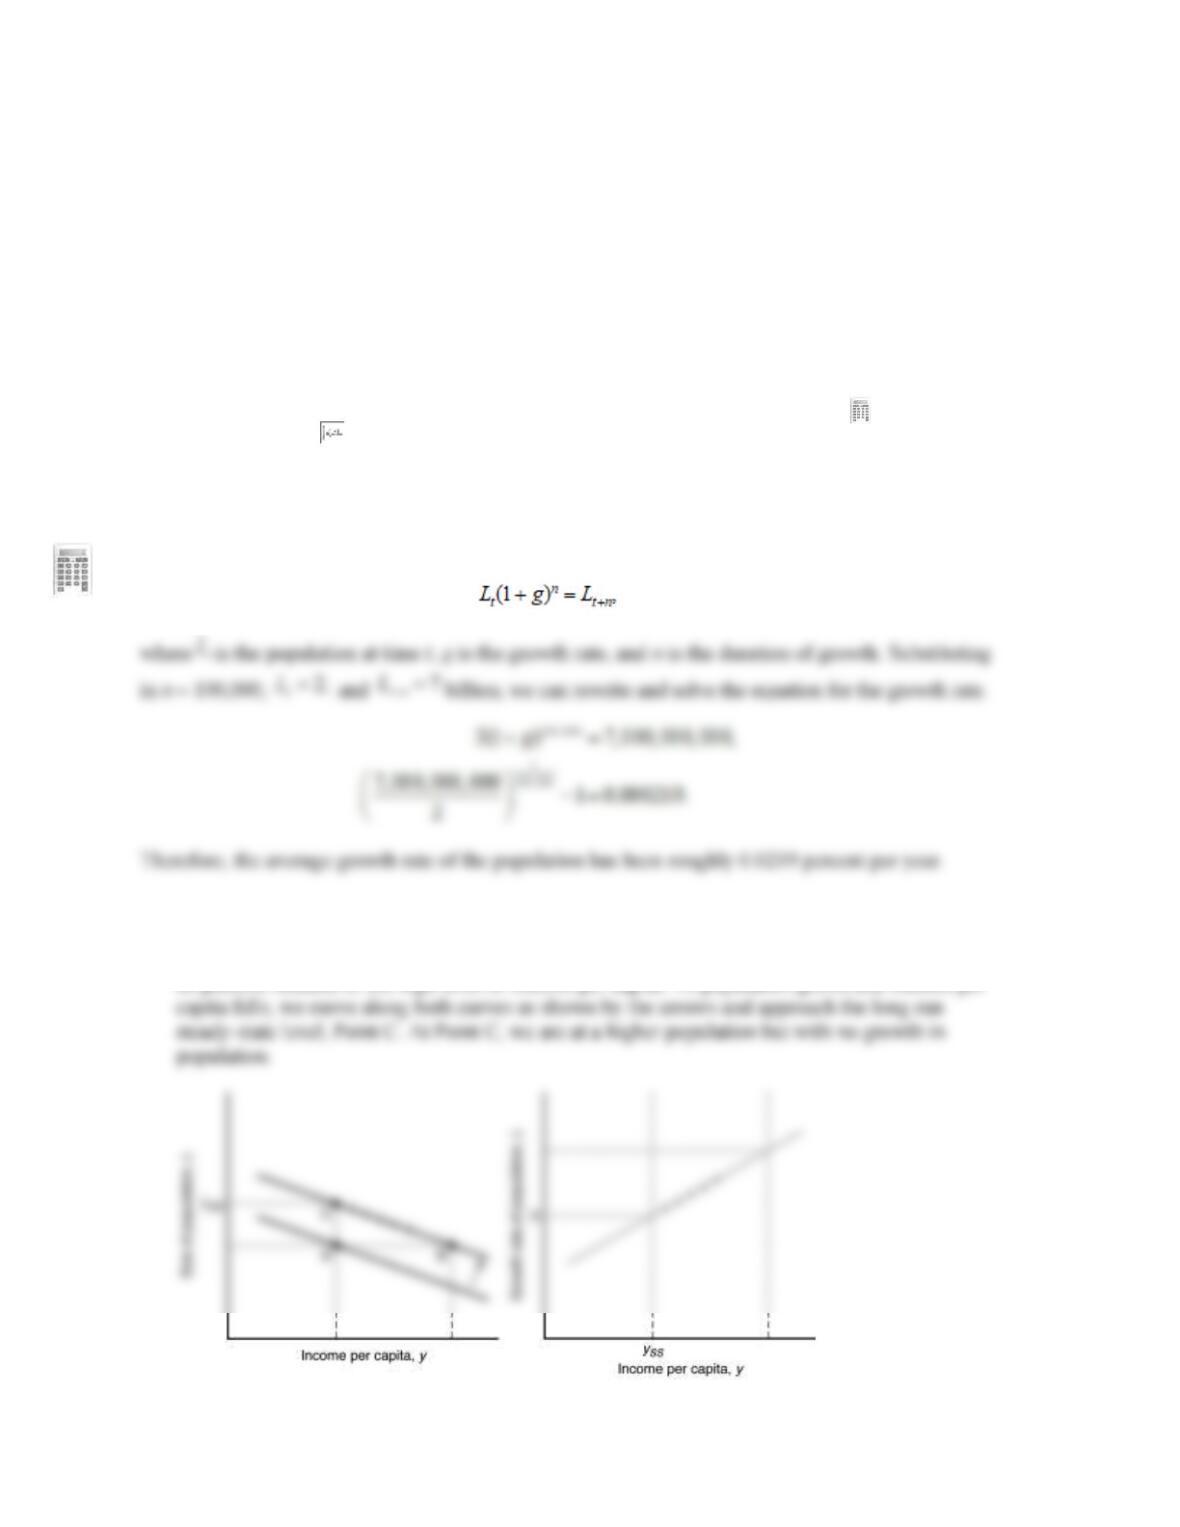
1. To find the average growth rate of the population, we use the following equation:
2. a. We begin from Point A, where the population size is stable with no growth. With the
discovery of a new strain of wheat that is twice as productive, the curve relating population size
and income per capita shifts outward. At this point, we are at Point B. Here, population growth will
be positive because of the high level of income per capita. As population grows and income per
Chapter 4 Population and Economic Growth 13
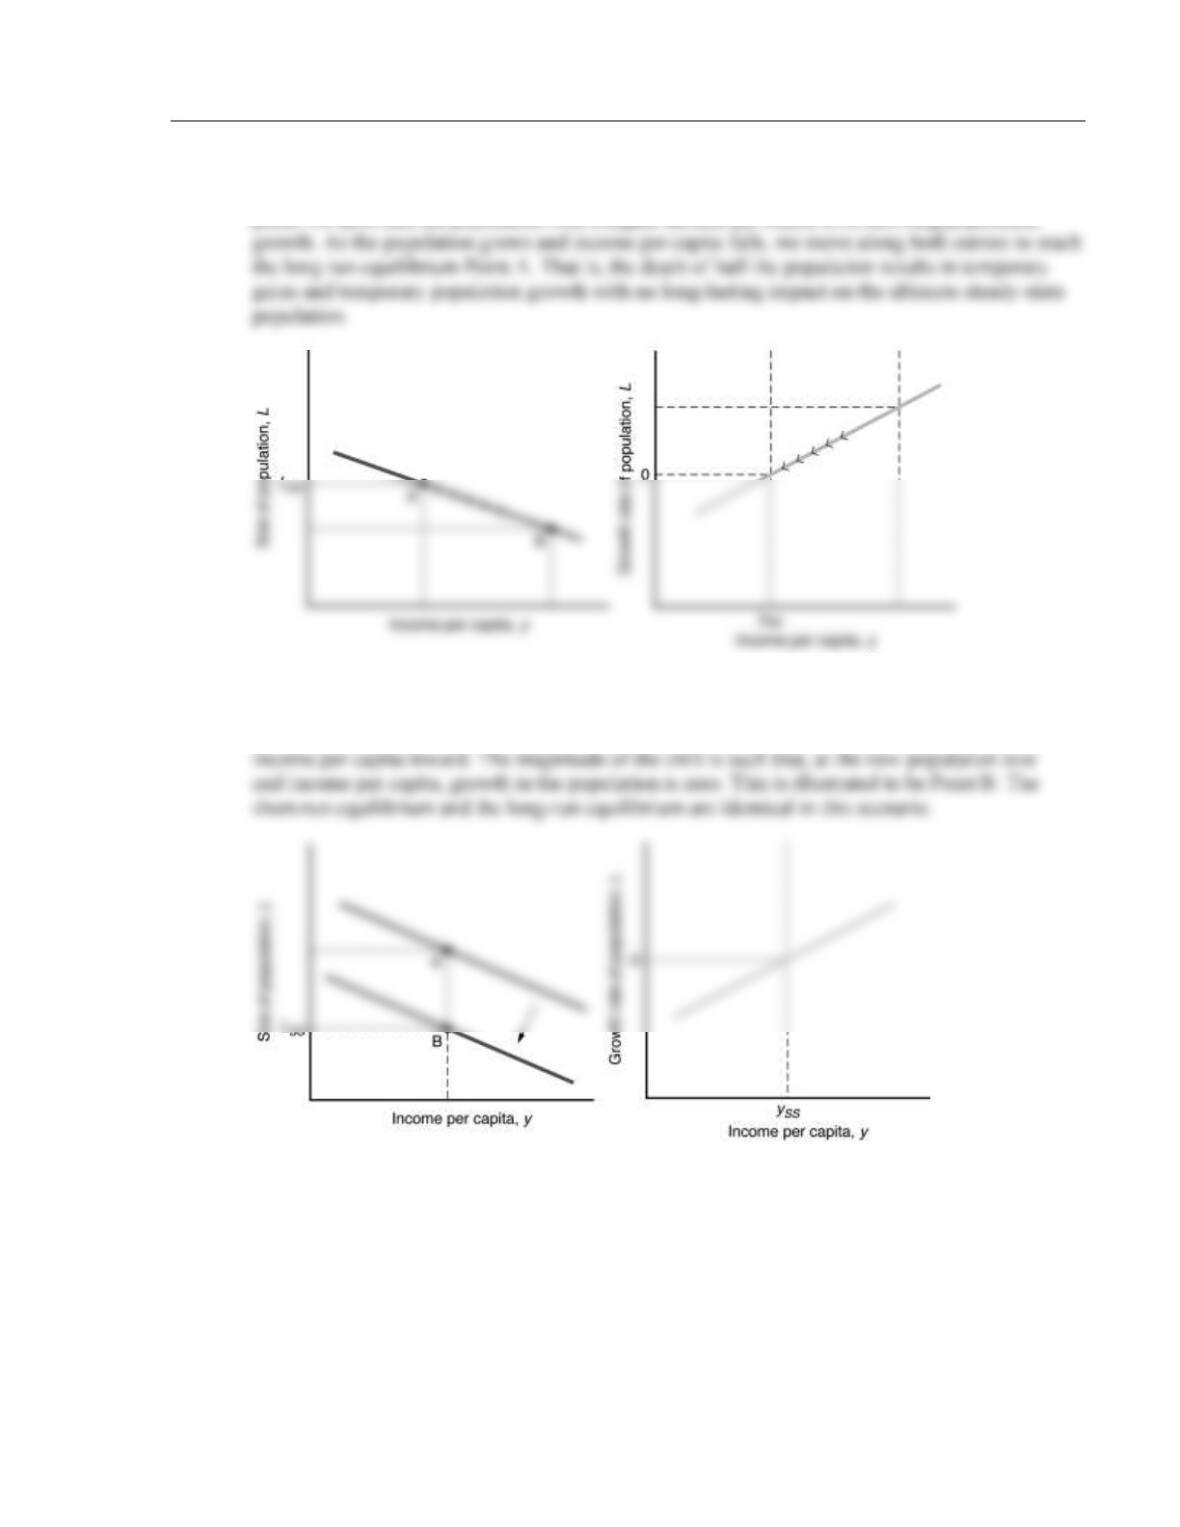
b. We begin from Point A, where the population size is stable with no growth. With war killing half
the population, no curve is shifted. Instead, we jump to Point B along the original curve. At this
point, we have half the population with a higher income per capita level allowing population
c. We begin from Point A, where the population size is stable with no growth. With a volcanic
eruption that kills half the people, we are faced with the same scenario as in Part (b). However,
the volcanic eruption destroys half the land, shifting the curve relating population size and
14 Weil • Economic Growth, Second Edition
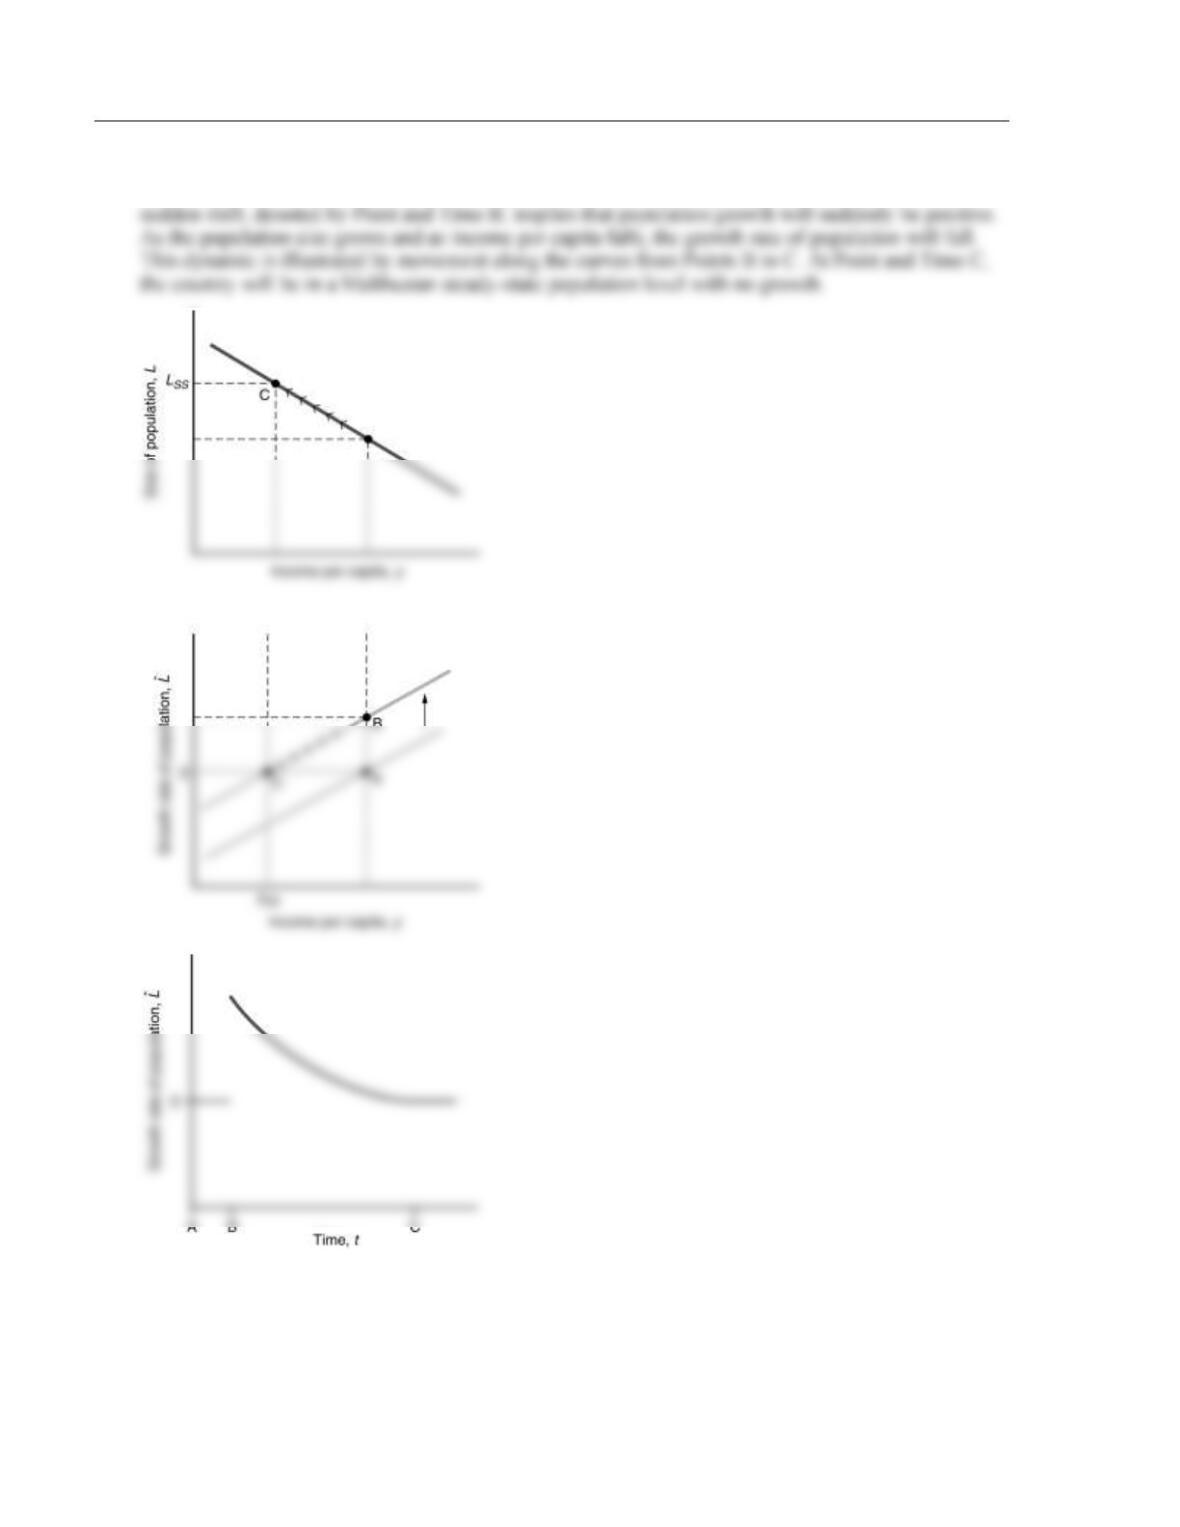
3. At Point A in time, the population size is stable with no growth. With a sudden change in cultural
attitudes, the curve relating the population growth rate and income per capita shifts upward. The
4. In a randomized controlled trial, one would have to randomly vary either the quantity or the quality of
children in a treatment group and compare the children in this treatment group to children in a control group.
For example, providing enhanced education to the treatment group represents an exogenous downward shock to
the cost of having higher quality children. Providing family planning to a treatment group would represent an
exogenous downward shock to the quantity of children. Using twins would be a good natural experiment. Since

Chapter 4 Population and Economic Growth 15
5. To calculate the steady-state level ratio of income per capita, we first find the steady-state level for each
country and then divide. The steady-state level ratio for Country X to Y is given by:
16 Weil • Economic Growth, Second Edition
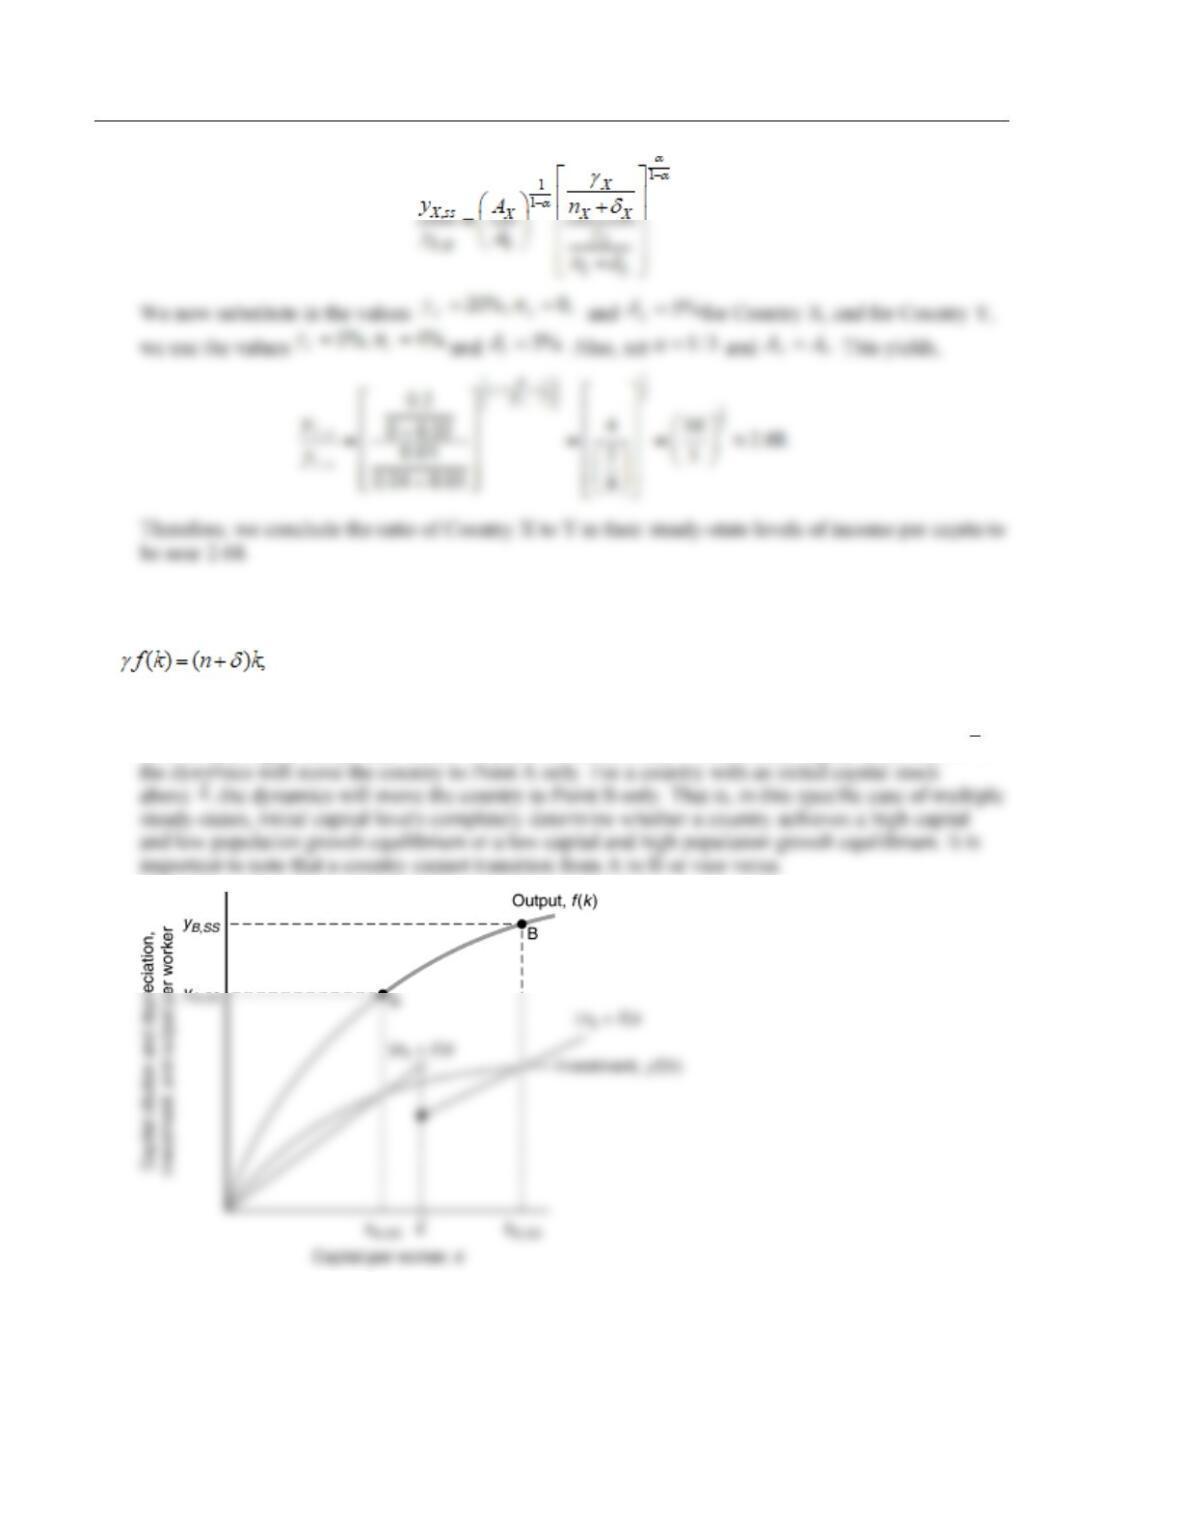
6. Because the equation for capital accumulation suggests that in the steady state,
multiple values of population growth will yield multiple steady states under some conditions. In the
diagram, Points A and B are the multiple capital per capita steady-state values and hence the resulting
incomes per capita steady-state values. In addition, for a country with an initial capital stock below
,k
7. Country A and B are identical in every respect but for their population growth rates. That is,
.
AB
nn
However, this implies that their respective steady states are not equal. Writing the reduced ratio
equation, as on page 98, we get:
Chapter 4 Population and Economic Growth 17
8. a. TFR = 4.
NRR = (1/2) [(1 child) (Probability of reaching age 25) + (1 child) (Probability of reaching
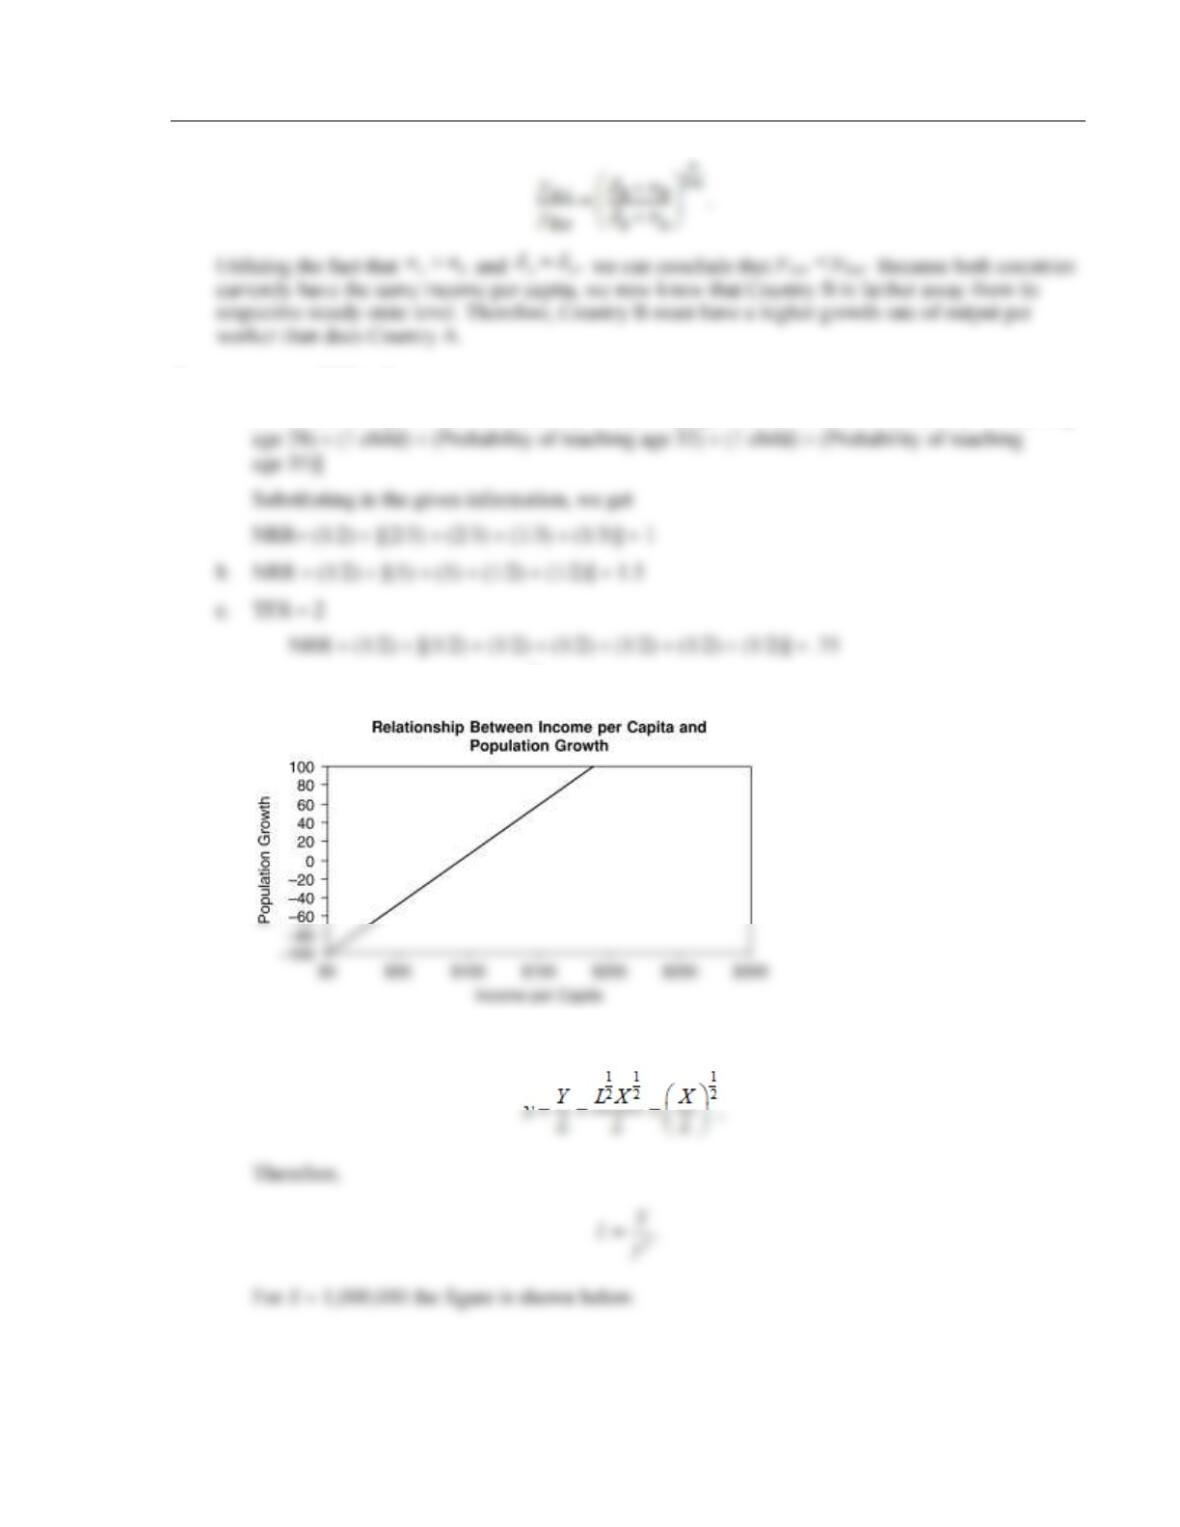
9. a. We graph the equation,
ˆ100,Ly=−
in the figure below.
b. First, we divide both sides of the production function by L and rearrange to get:
18 Weil • Economic Growth, Second Edition
Chapter 4 Population and Economic Growth 19
Substituting in this value into the production function, we back out the value of
ss
L
as follows:
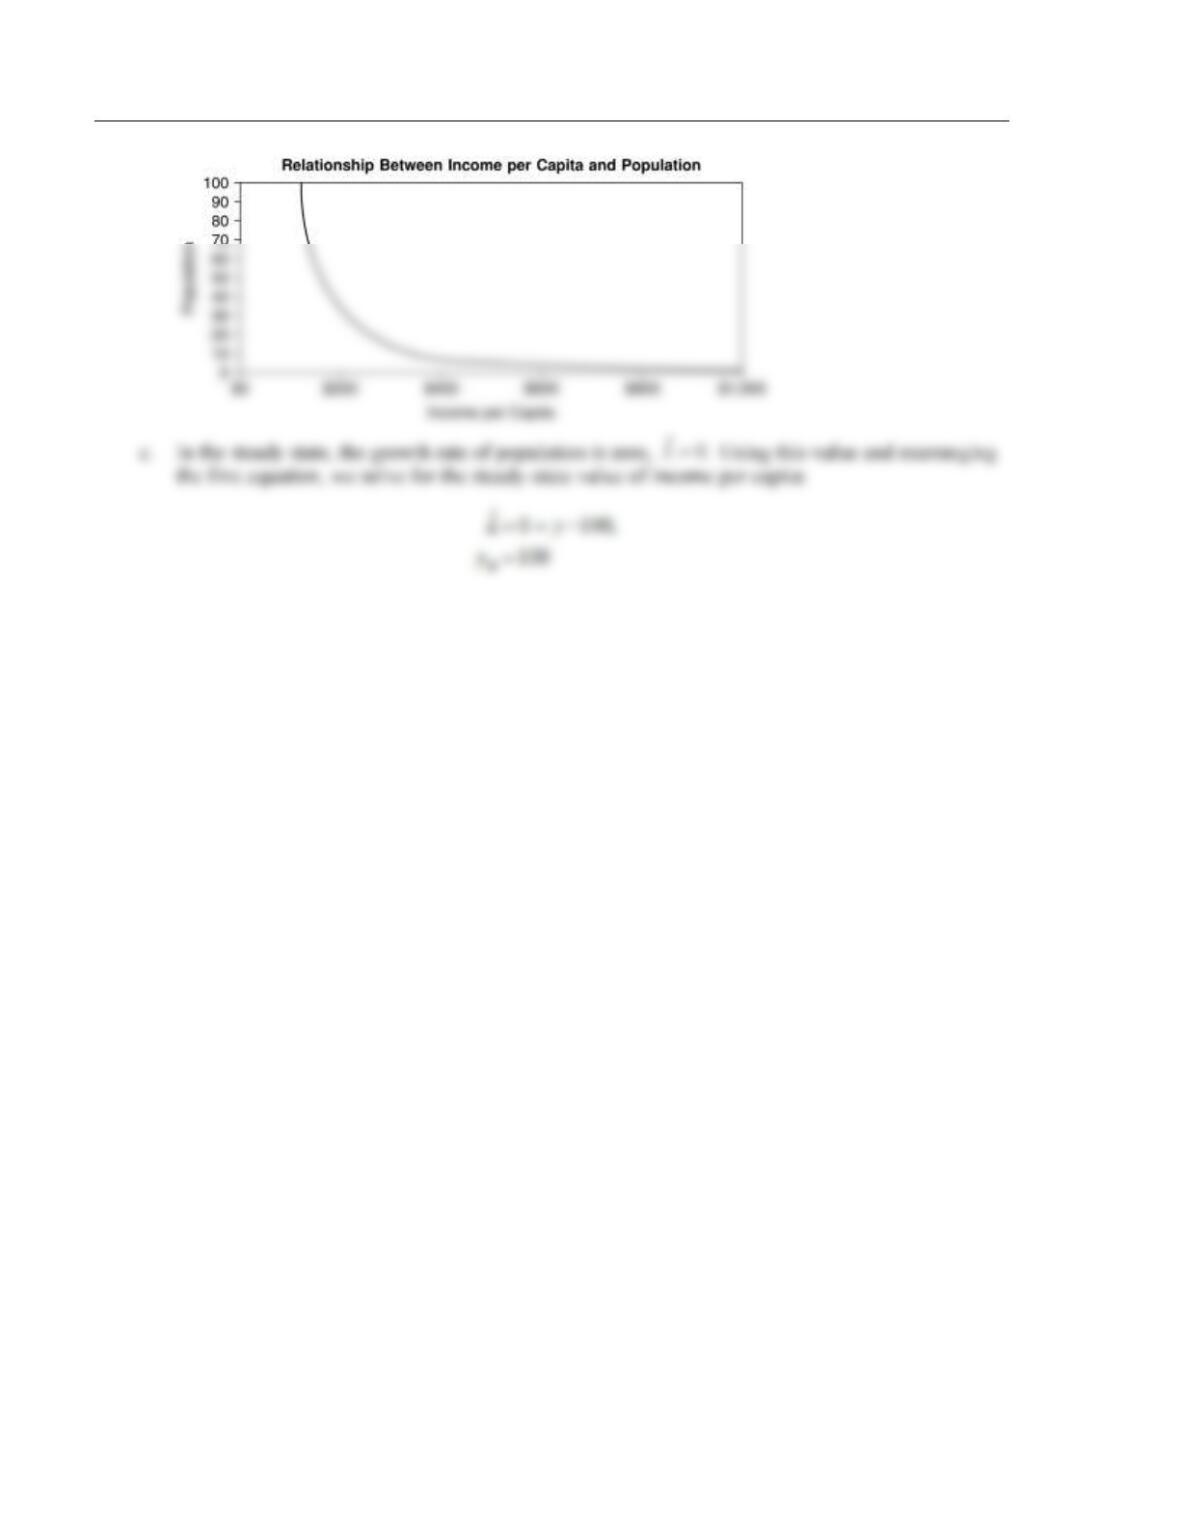
10. a. The steady-state level of income per worker is characterized by
ˆ0.y=
Hence, we must
first find the relationship among the growth rate of income per worker, productivity, and
population.
By taking natural logs of the production function and taking the derivative with respect to time,
we get:
b. Referring back to our equation relating the growth rate of income per capita, productivity, land,
and population, we can set
ˆ0X=
and
ˆ0.1.A=
20 Weil • Economic Growth, Second Edition
◼ Solutions to Appendix Problems
A.1. a. To calculate life expectancy at birth, we must find the area under the survivorship
function.
This amounts to solving the equation:
b. To calculate the total fertility rate, we must find the area under the age-specific fertility
rate function. This amounts to solving equation:
In discrete time analysis, we can extrapolate that the average number of children per
woman from age 20 to 39 is one and the average number of children per woman for any other
age is zero. Summing these probabilities, we get:
c. The net rate of reproduction is found by multiplying the number of girls that each girl
born can be expected to give birth to. First noting that the probability of being alive from age 20
to 29 is one with the age-specific fertility rate at one child per woman and the probability of
being alive from age 30 to 39 is 0.5 with the age-specific fertility rate at one child per woman,
we solve the following equation:
Chapter 4 Population and Economic Growth 21
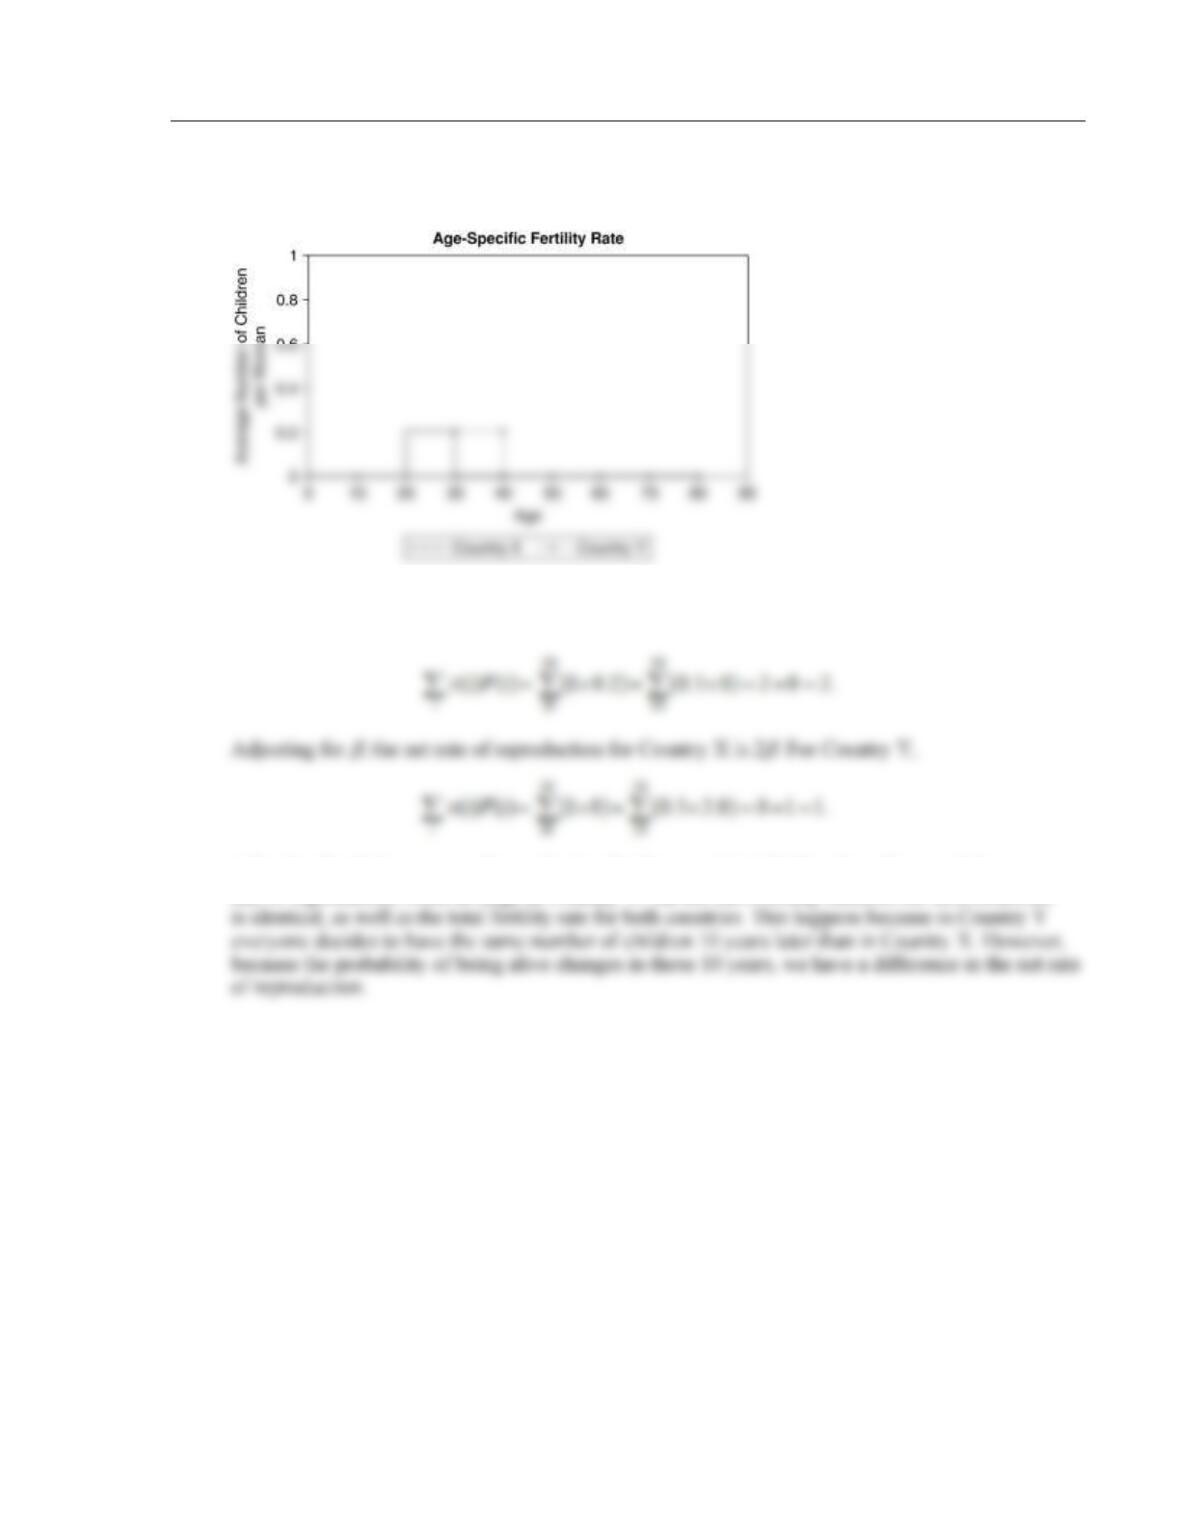
A.2. For Country X and Country Y assume that the survivorship function is that given in Problem 1. The
total fertility rates for both countries are given below.
The total fertility rate is the same for both countries. However, the rate of reproduction differs.
For Country X,
Adjusting for
, the net rate of reproduction for Country Y is 1
. Therefore, Country X has a net
rate of reproduction twice as large as Country Y, but the survivorship function for both countries