1
2
3
4
5
6
7
8
9
10
11
12
13
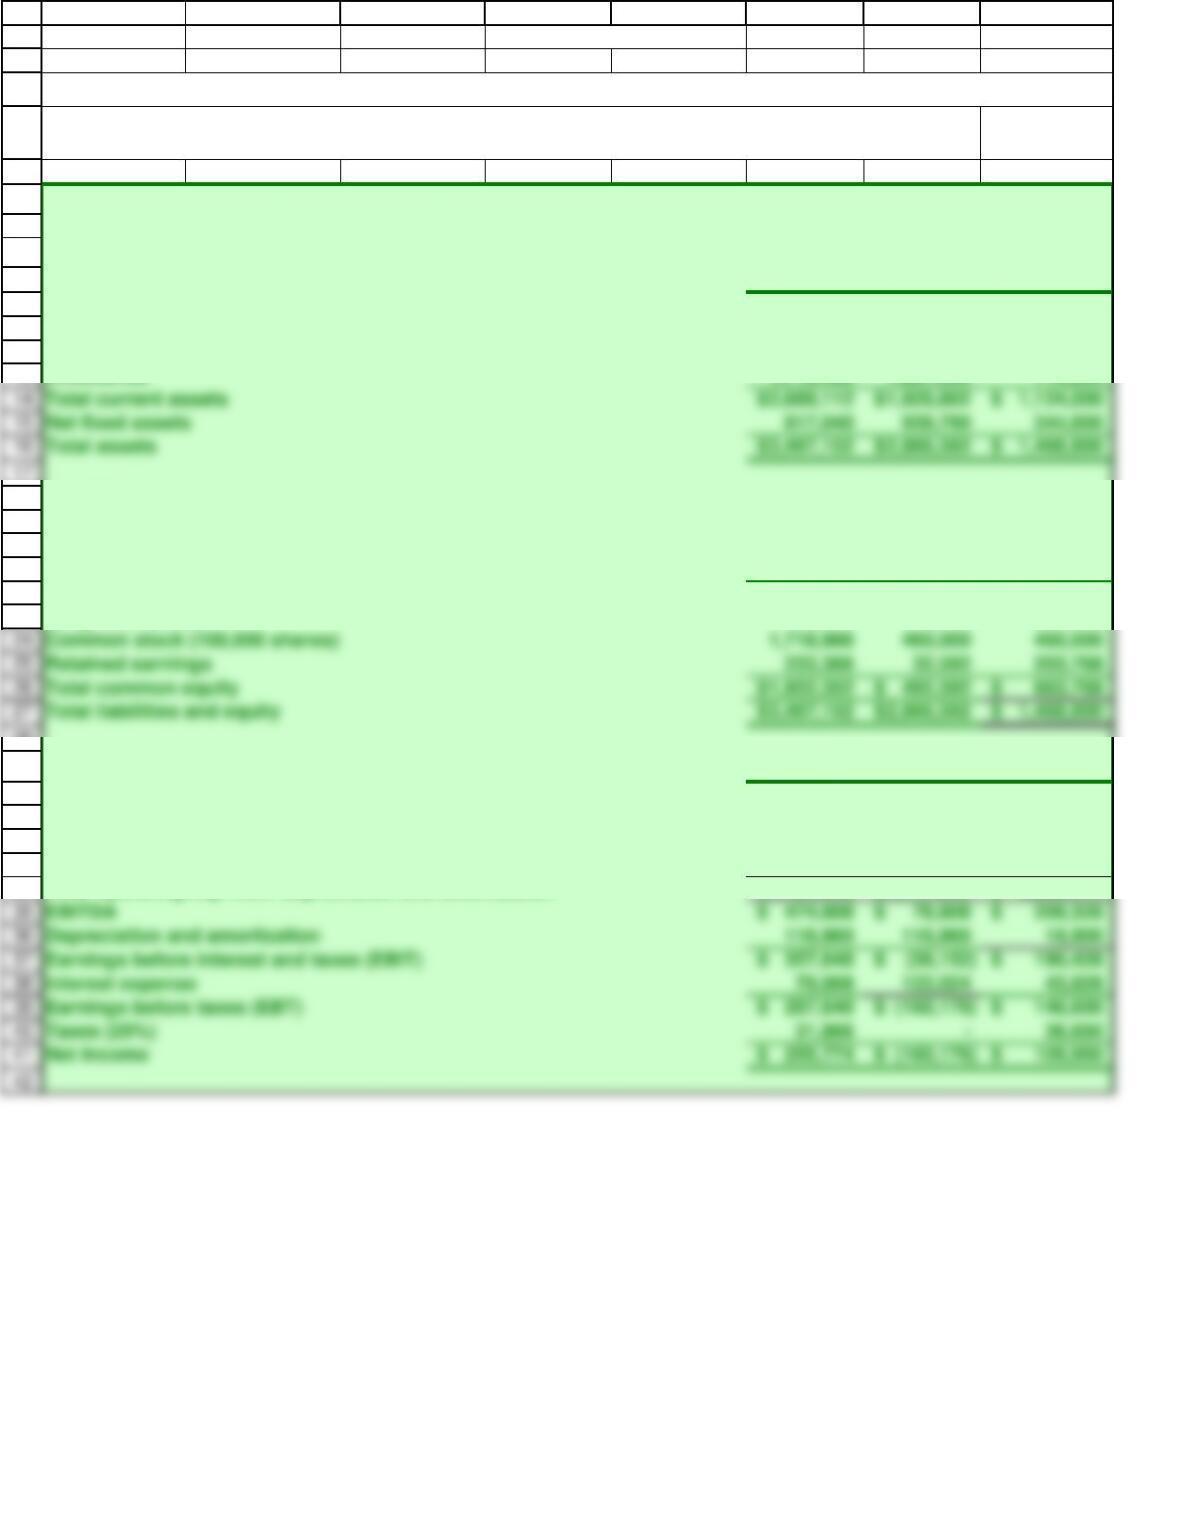
Common stock (100,000 shares)
Retained earnings 233,366 32,592 203,768
Total common equity 1,952,352$ 492,592$ 663,768$
18
19
20
21
22
23
Depreciation and amortization 116,960 116,960 18,900
Earnings before interest and taxes (EBIT) 357,648$ (38,152)$ 190,428$
Interest expense 70,008 122,024 43,828
Earnings before taxes (EBT) 287,640$ (160,176)$ 146,600$
Taxes (25%) 31,866 – 36,650
28
29
30
31
32
33
34
A B C D E F G H
04 Case model 12/9/2018
EXHIBITS: INPUT DATA (for D’Leon)
Table IC4.1 Balance Sheets
2020E 2019 2018
Assets
Cash 85,632$ 7,282$ 57,600$
Accounts receivable 878,000 632,160 351,200
Inventories 1,716,480 1,287,360 715,200
Liabilities and equity
Accounts payable 436,800$ 524,160$ 145,600$
Accruals 408,000 489,600 136,000
Notes payable 300,000 636,808 200,000
Total current liabilities 1,144,800$ 1,650,568$ 481,600$
Long-term bonds 400,000 723,432 323,432
Table IC4.2 Income Statements 2020E 2019 2018
Sales 6,900,600$ 6,126,796$ 3,432,000$
Cost of goods sold 5,875,992 5,528,000 2,864,000
Other expenses 550,000 519,988 358,672
Total operating exp. excl. depreciation and amortization 6,425,992$ 6,047,988$ 3,222,672$
9/12/2022 17:13
This spreadsheet model is designed to be used in conjunction with the chapter’s integrated case and
the related PowerPoint slide presentation.
Chapter 4. Analysis of Financial Statements
Total current assets 2,680,112$ 1,926,802$ 1,124,000$
Net fixed assets 817,040 939,790 344,800
43
44
45
51
52
53
71
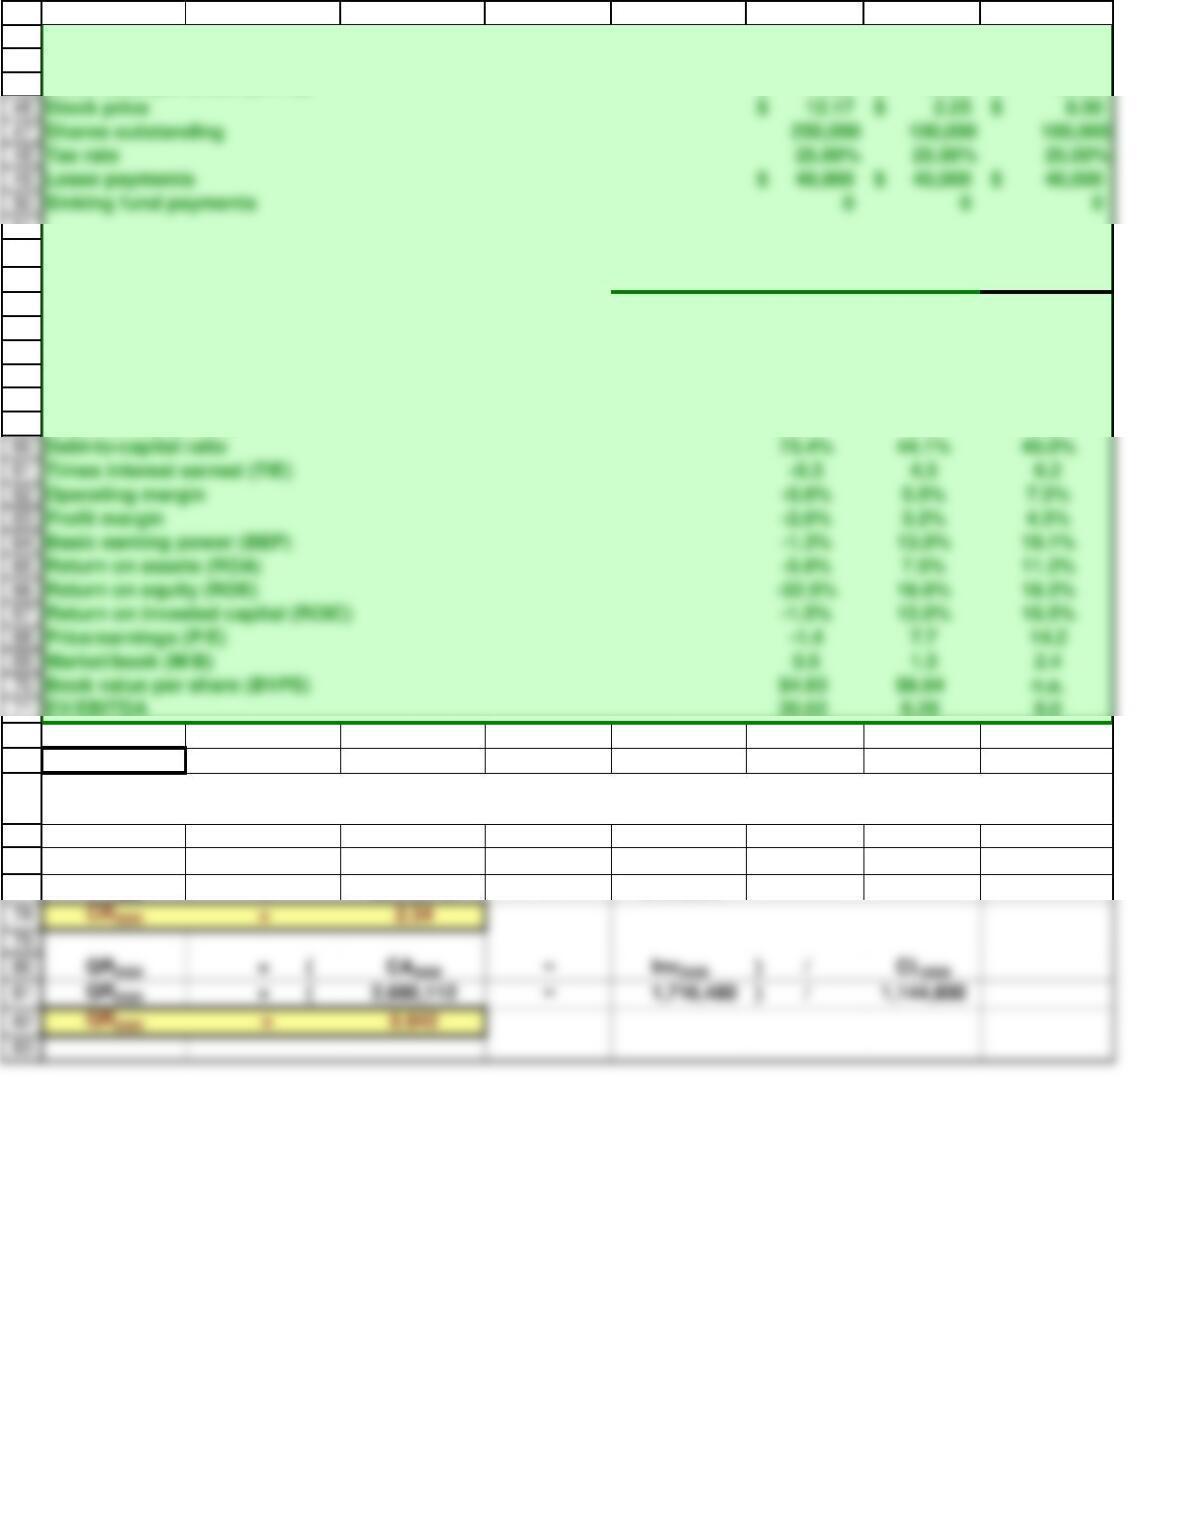
Debt-to-capital ratio 73.4% 44.1% 40.0%
Times interest earned (TIE) -0.3 4.3 6.2
Operating margin -0.6% 5.5% 7.3%
Profit margin -2.6% 3.2% 4.3%
Basic earning power (BEP) -1.3% 13.0% 19.1%
Return on assets (ROA) -5.6% 7.5% 11.2%
Return on equity (ROE) -32.5% 16.6% 18.2%
Return on invested capital (ROIC) -1.5% 12.0% 16.5%
Price/earnings (P/E) -1.4 7.7 14.2
Market/book (M/B) 0.5 1.3 2.4
Book value per share (BVPS) $4.93 $6.64 n.a.
54
55
56
57
58
59
72
73
83
74
75
76
77
A B C D E F G H
Earnings per share (EPS) 1.023$ (1.602)$ 1.100$
Dividends per share (DPS) 0.220$ 0.110$ 0.275$
Book value per share (BVPS) 7.809$ 4.926$ 6.638$
TABLE IC4.3 Ratio Analysis Industry
2020E 2019 2018 Average
Current 1.2 2.3 2.7
Quick 0.4 0.8 1.0
Inventory turnover 4.8 4.8 6.1
Days sales outstanding (DSO) 37.7 37.4 32.0
Fixed assets turnover 6.5 10.0 7.0
Total assets turnover 2.1 2.3 2.6
PART B
CR2020 =CA2020 /CL2020
CR2020 =2,680,112 /1,144,800
Calculate D’Leon’s 2020 current and quick ratios based on the projected balance sheet and income statement data.
Stock price 12.17$ 2.25$ 8.50$
Shares outstanding 250,000 100,000 100,000
Tax rate 25.00% 25.00% 25.00%
Lease payments 40,000$ 40,000$ 40,000$
Sinking fund payments 0 0 0
84
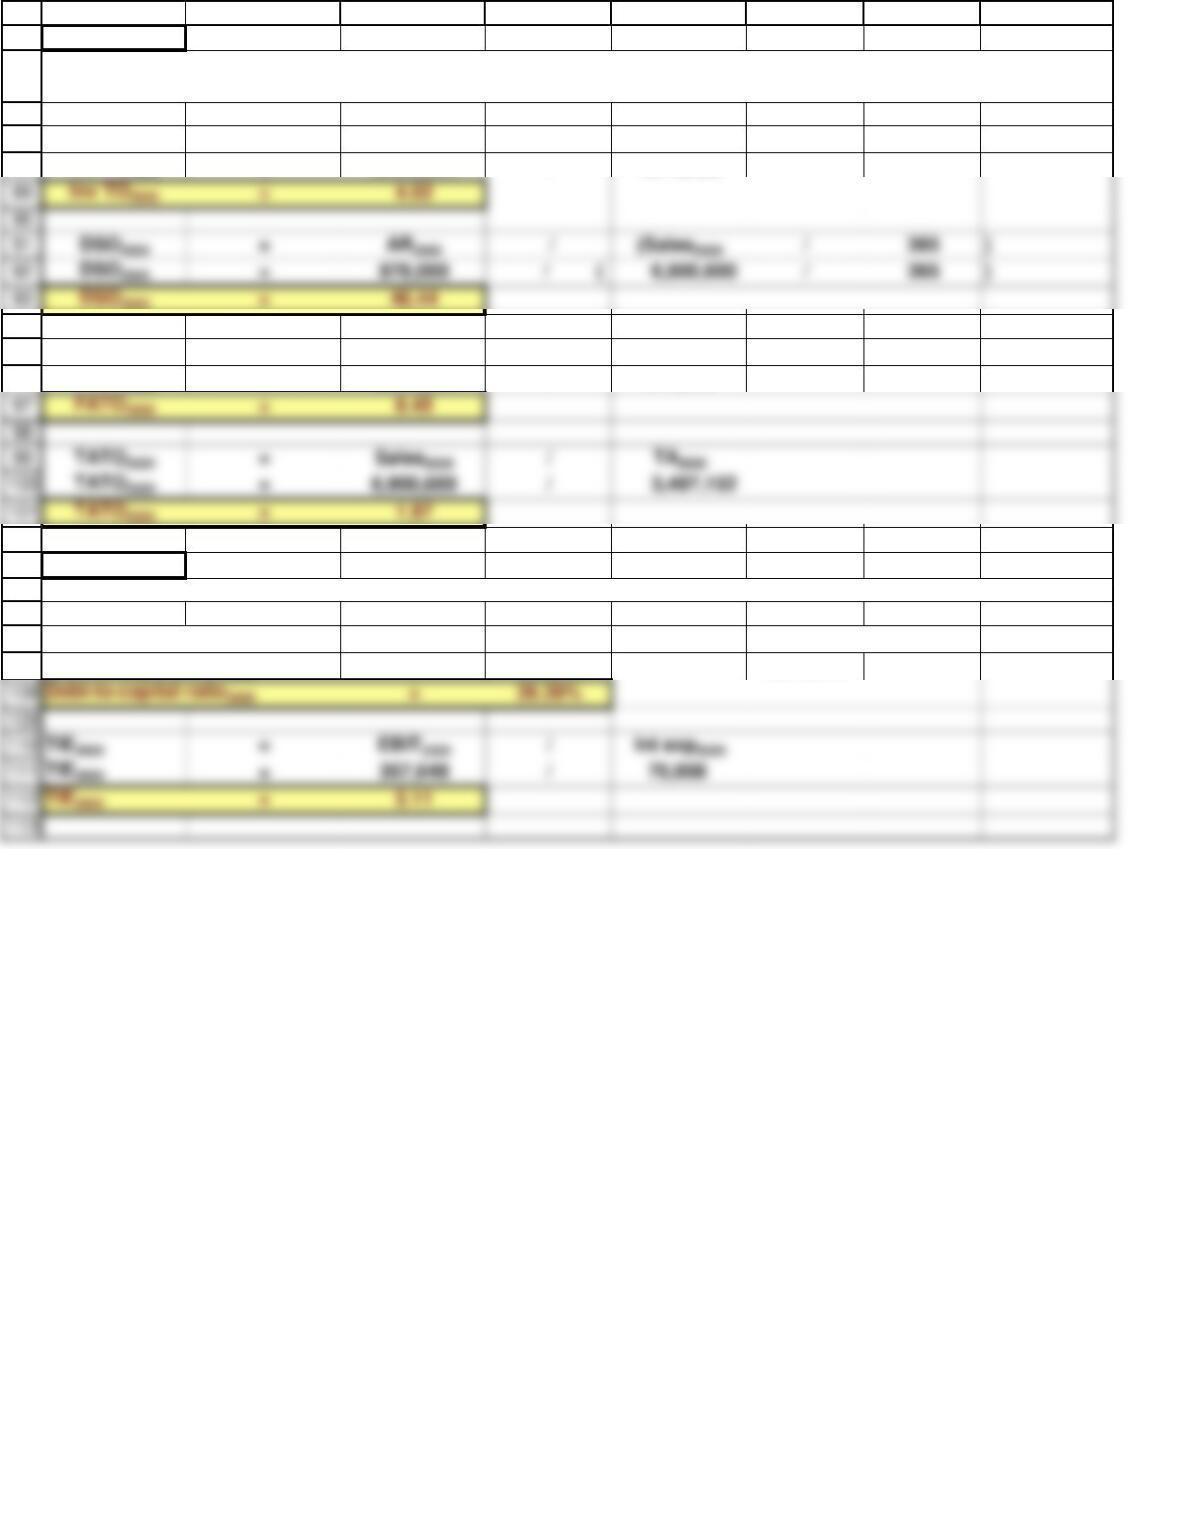
TATO2020 = Sales2020 /TA2020
TATO2020 =6,900,600 /3,497,152
85
86
87
88
94
95
96
102
103
113
104
105
106
107
A B C D E F G H
PART C
Inv TO2020 = Sales2020 / Inv2020
Inv TO2020 =6,900,600 /1,716,480
FATO2020 = Sales2020 / NFA2020
FATO2020 =6,900,600 /817,040
PART D
Debt-to-capital ratio2020 =Total debt2020 /Total invested capital2020
Debt-to-capital ratio2020 =700,000 /2,652,352
Calculate the 2020 debt-to-capital and times-interest-earned ratios.
Calculate the 2020 inventory turnover, days sales outstanding (DSO), fixed assets turnover, and total assets
turnover.
114
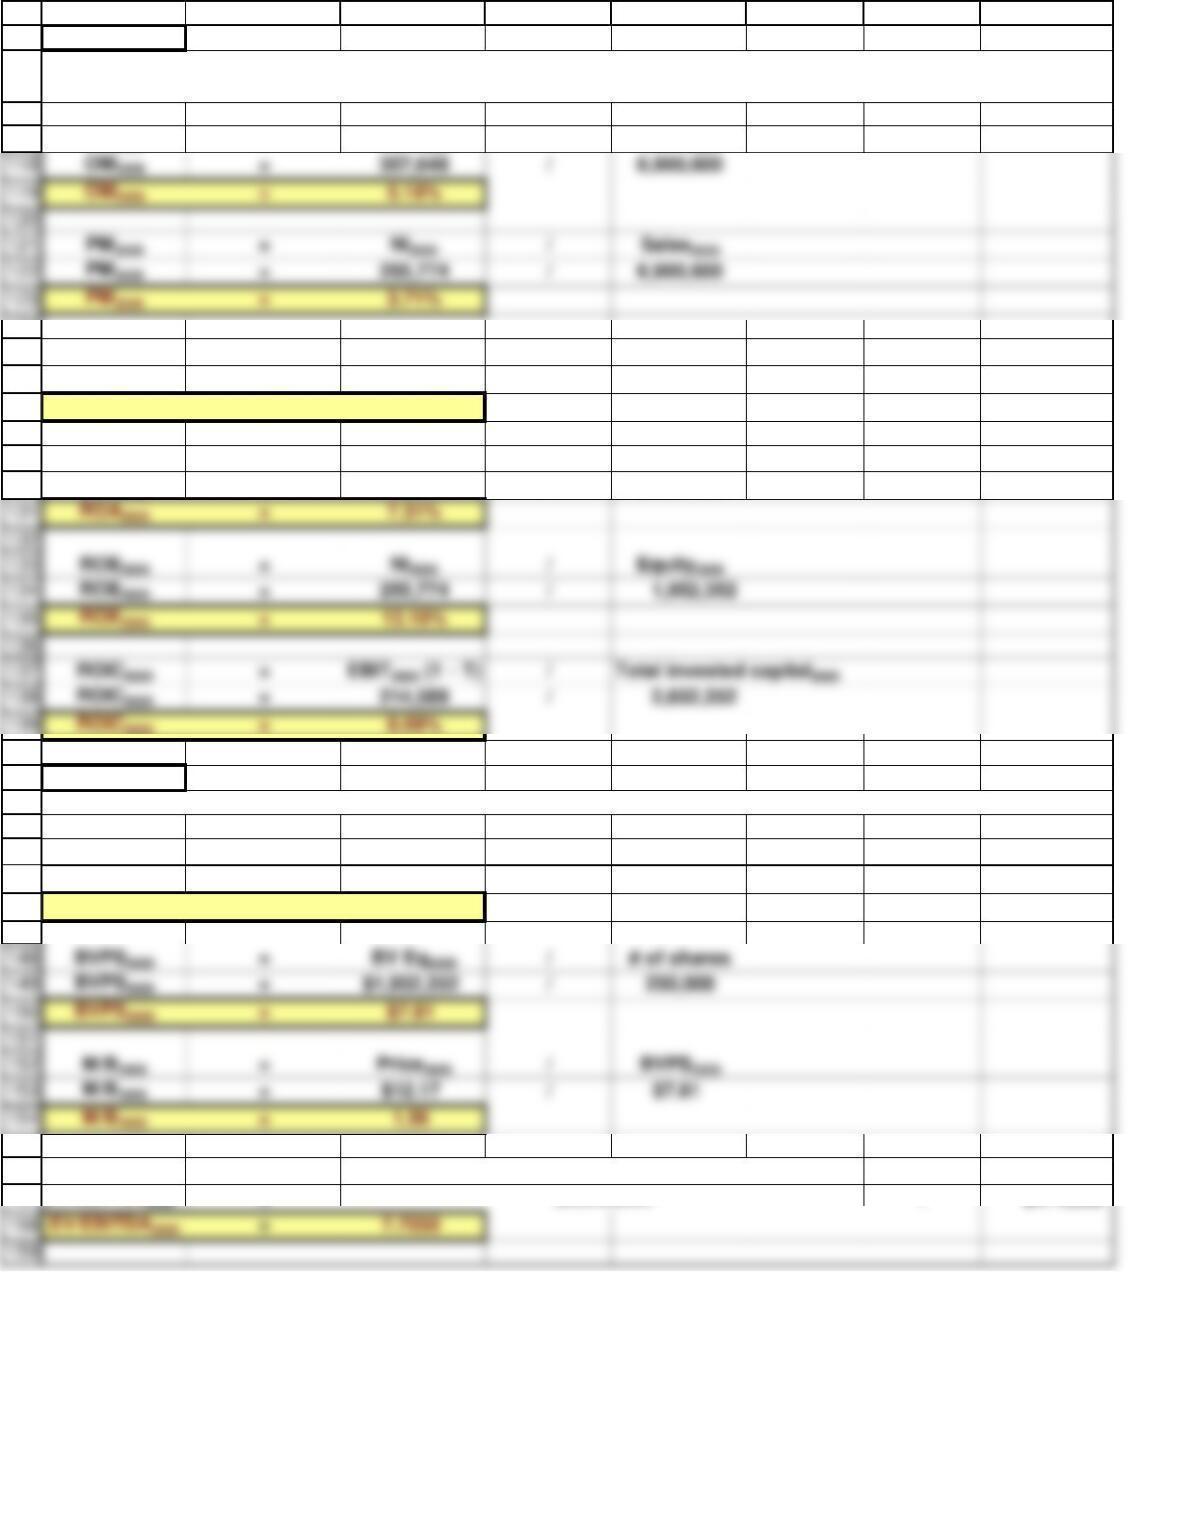
ROE2020 =NI2020 / Equity2020
ROE2020 =255,774 /1,952,352
115
116
117
124
125
126
127
128
129
130
140
141
159
142
143
144
145
146
147
155
156
157
A B C D E F G H
PART E
OM2020 = EBIT2020 / Sales2020
BEP2020 = EBIT2020 /TA2020
BEP2020 =357,648 /3,497,152
BEP2020 =10.23%
ROA2020 =NI2020 /TA2020
ROA2020 =255,774 /3,497,152
PART F
P/E2020 = Price2020
/ (
NI2020 / # of shares )
P/E2020 =$12.17
/ (
$255,774 /250,000 )
P/E2020 =11.90
EV/EBITDA2020 = (MVE + MVD + MVClaims – Cash and Equivalents) / EBITDA
EV/EBITDA2020 = / $474,608
Calculate the 2020 operating margin, profit margin, basic earning power (BEP), return on assets (ROA), return on
equity (ROE), and return on invested capital (ROIC).
Calculate the 2020 price/earnings ratio,market/book ratio, and EV/EBITDA ratio.
$3,656,868
160
161
162
163
164
167
168
174
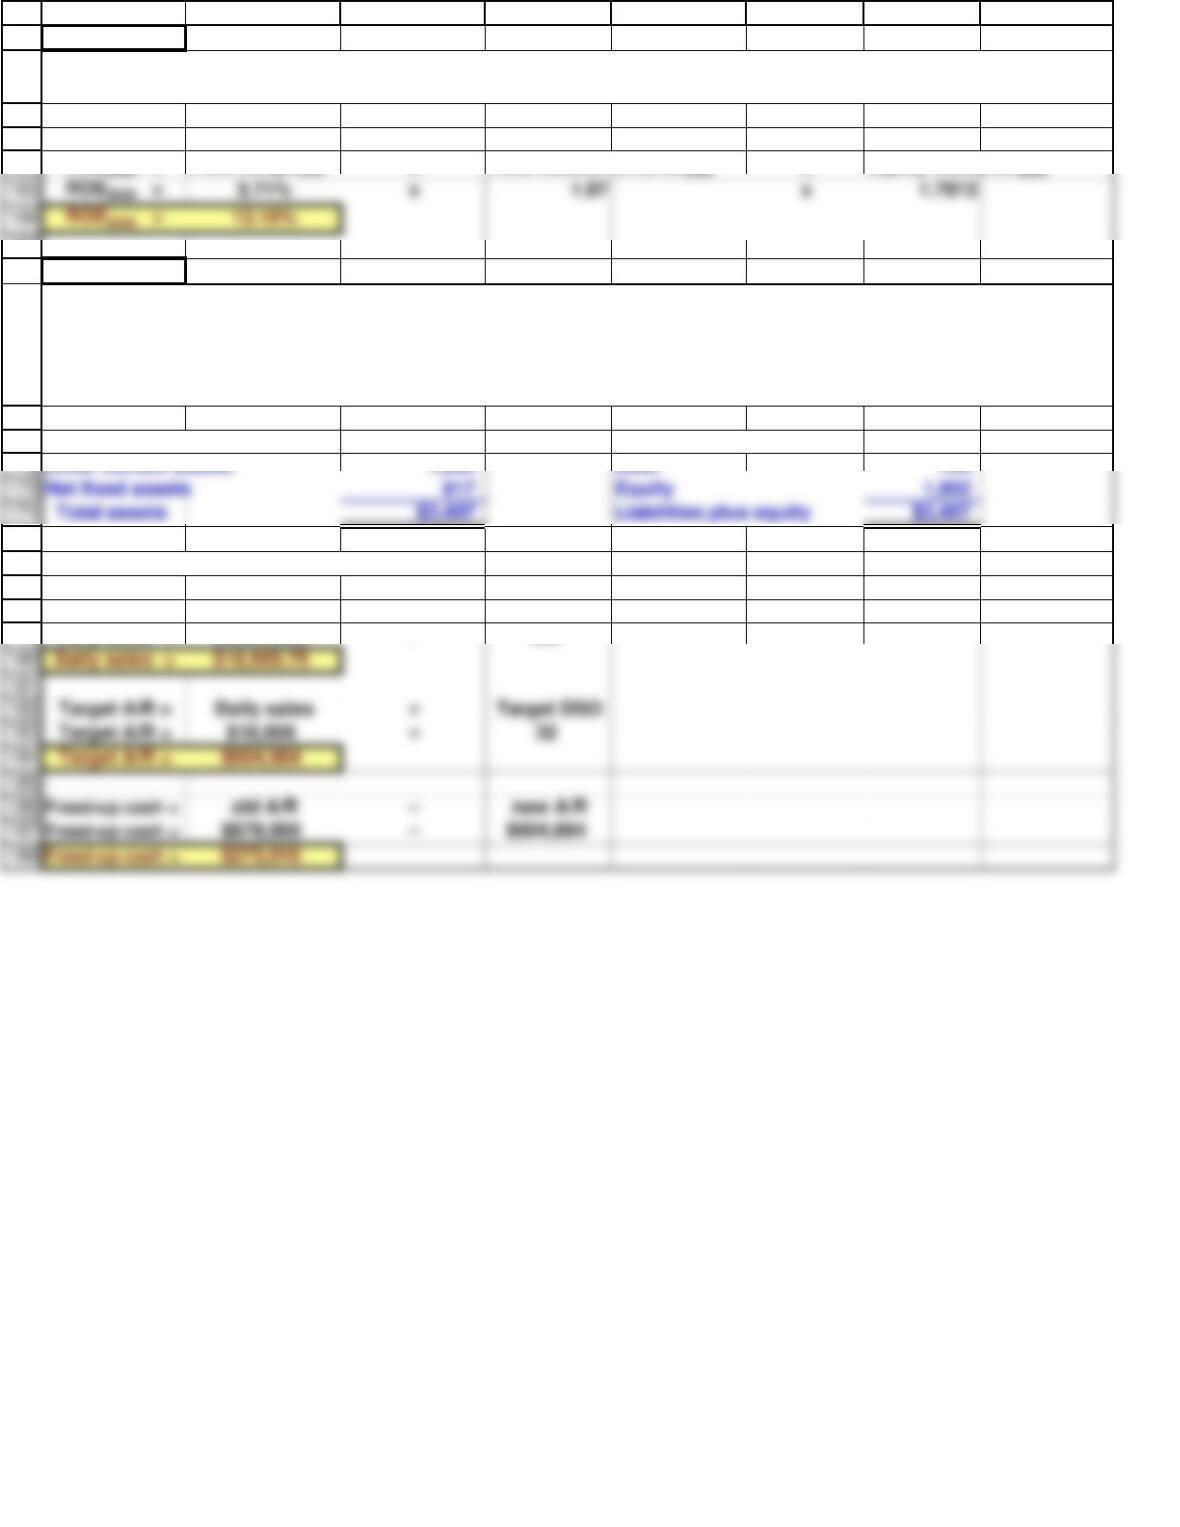
Other current assets 1,802 Debt 700
Net fixed assets 817 Equity 1,952
169
170
171
175
176
177
178
179
180
183
184
187
188
A B C D E F G H
PART G
ROE2020 = Profit margin2020 x Total assets turnover2020 x Equity multiplier2020
PART H
Accounts receivable $878 Current liabilities $845
First, we need to calculate D’Leon’s daily sales.
Daily sales = Sales / 365
Daily sales = $6,900,600 /365
Use the DuPont equation to provide a summary and overview of D’Leon’s financial condition as projected for 2020.
Use the following simplified 2020 balance sheet to show, in general terms, how an improvement in the DSO would
tend to affect the stock price. For example, if the company could improve its collection procedures and thereby
lower its DSO from 46.4 days to the 32-day industry average without affecting sales, how would that change “ripple
through” the financial statements (shown in thousands below) and influence the stock price?