* * This is Chapter 21 in Economics.
A n s w e r s t o t h e R e v i e w Q u i z z e s
Page 86 (page 494 in Economics)
1. Define GDP and distinguish between a final good and an intermediate good. Provide examples.
GDP is the market value of all the final goods and services produced within a country in a given time
period. A final good or service is an item that is sold to the final user, that is, the final consumer,
2. Why does GDP equal aggregate income and also equal aggregate expenditure?
3. What are the distinctions between domestic and national, and gross and net?
“Domestic” means that the production being measured is within a country no matter by whom;
Page 89 (page 497 in Economics)
1. What is the expenditure approach to measuring GDP?
4
MEASURING GDP
AND ECONOMIC
GROWTH**
C h a p t e r
2. What is the income approach to measuring GDP?
The income approach measures GDP by focusing on aggregate income. This approach sums all the
incomes paid to households by firms for the factors of production they hire. The National Income and
3. What adjustments must be made to total income to make it equal GDP?
4. What is the distinction between nominal GDP and real GDP?
5. How is real GDP calculated?
Page 95 (page 503 in Economics)
1. Distinguish between real GDP and potential GDP and describe how each grows over time.
Real GDP is the value of final goods and services produced in a given year when valued at the prices of
a reference base year. Potential GDP is the maximum amount of real GDP that can be produced while
2. How does the growth rate of real GDP contribute to an improved standard of living?
3. What is a business cycle and what are its phases and turning points?
4. What is PPP and how does it help us to make valid international comparisons of real GDP?
5. Explain why real GDP might be an unreliable indicator of the standard of living.
Real GDP is sometimes used to measure the standard of living but real GDP can be misleading for
several reasons. Real GDP does not include household production, productive activities done in and
around the house by the homeowner. Because these tasks often are an important component of
54 C H A P T E R 4
A n s w e r s t o t h e S t u d y P l a n Pr o b l e m s a n d A p p l i c a t i o ns
1. Classify each of the following items as a final good or service or an intermediate good or service
and identify each item as a component of consumption expenditure, investment, or government
expenditure on goods and services:
• Airline ticket bought by a student.
Airline tickets are intermediate goods that are used for the final service, airline flights. They are part of
consumption expenditure.
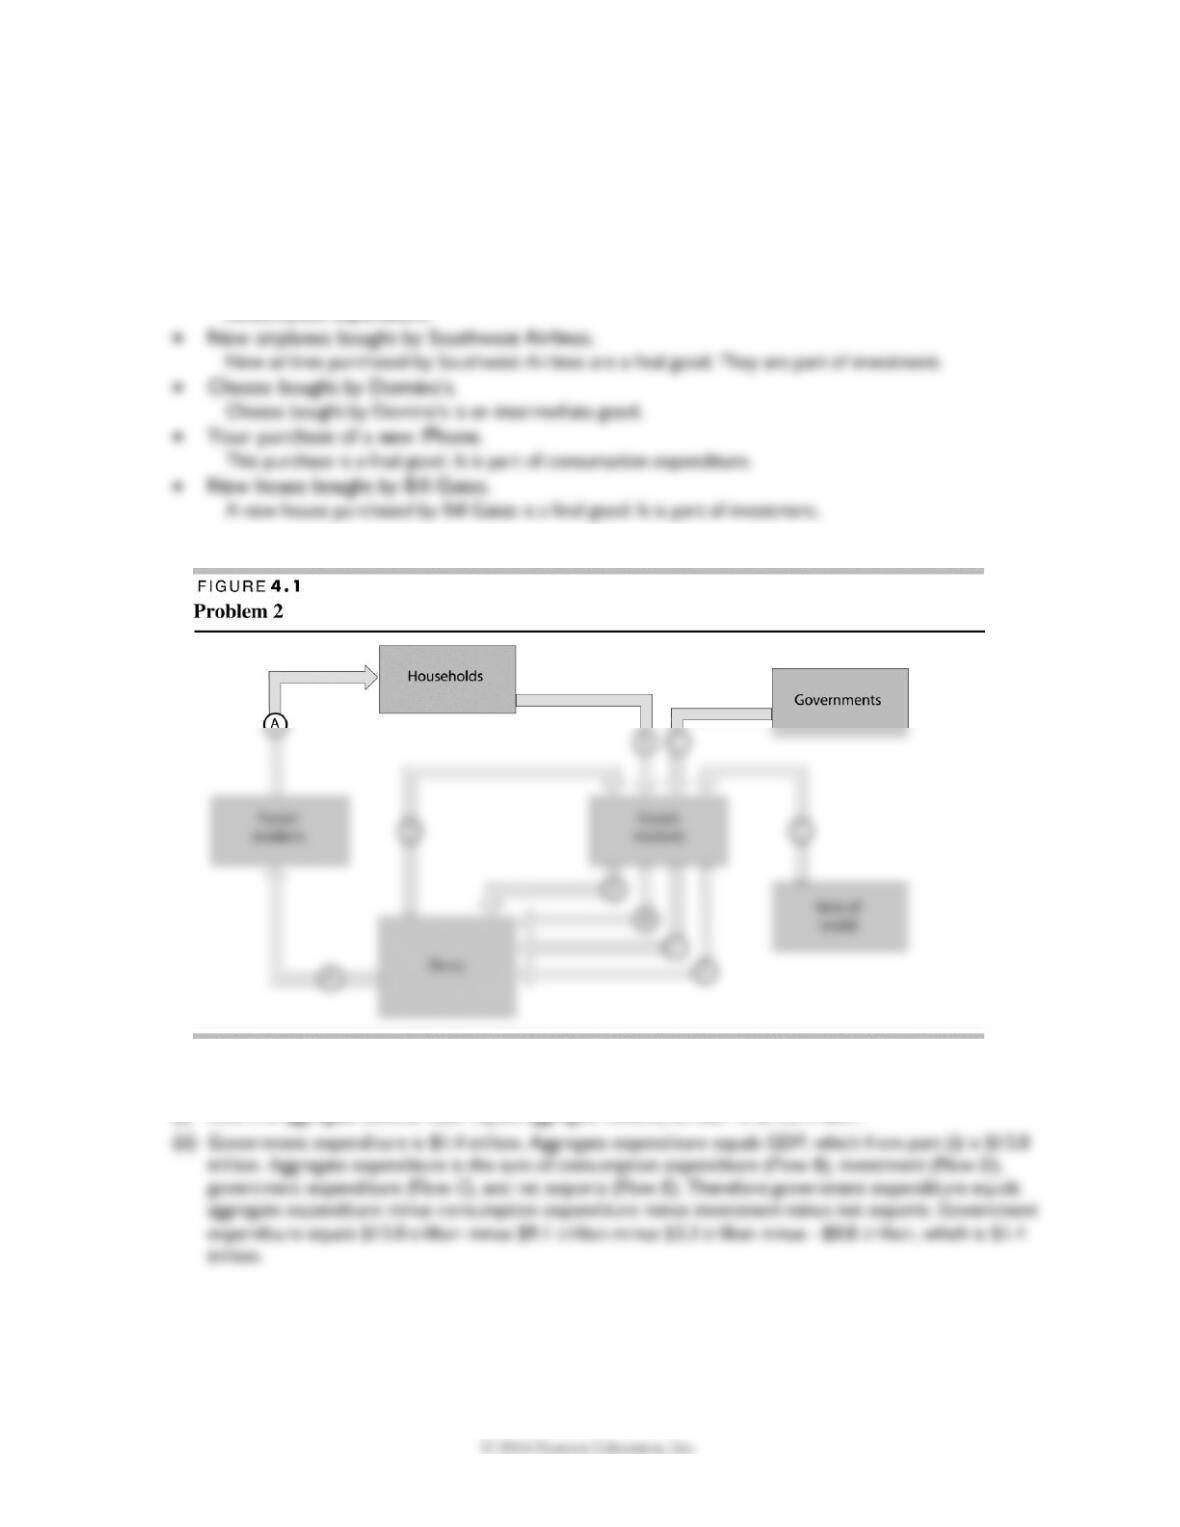
Use the following figure illustrates the circular flow model.
2. During 2014, flow A was $13.0 trillion, flow B was $9.1 trillion, flow D was $3.3 trillion, and flow
E was –$0.8 trillion. Calculate (i) GDP and (ii) Government expenditure.
(i) Flow A is aggregate income. GDP equals aggregate income, so GDP is $13.0 trillion.
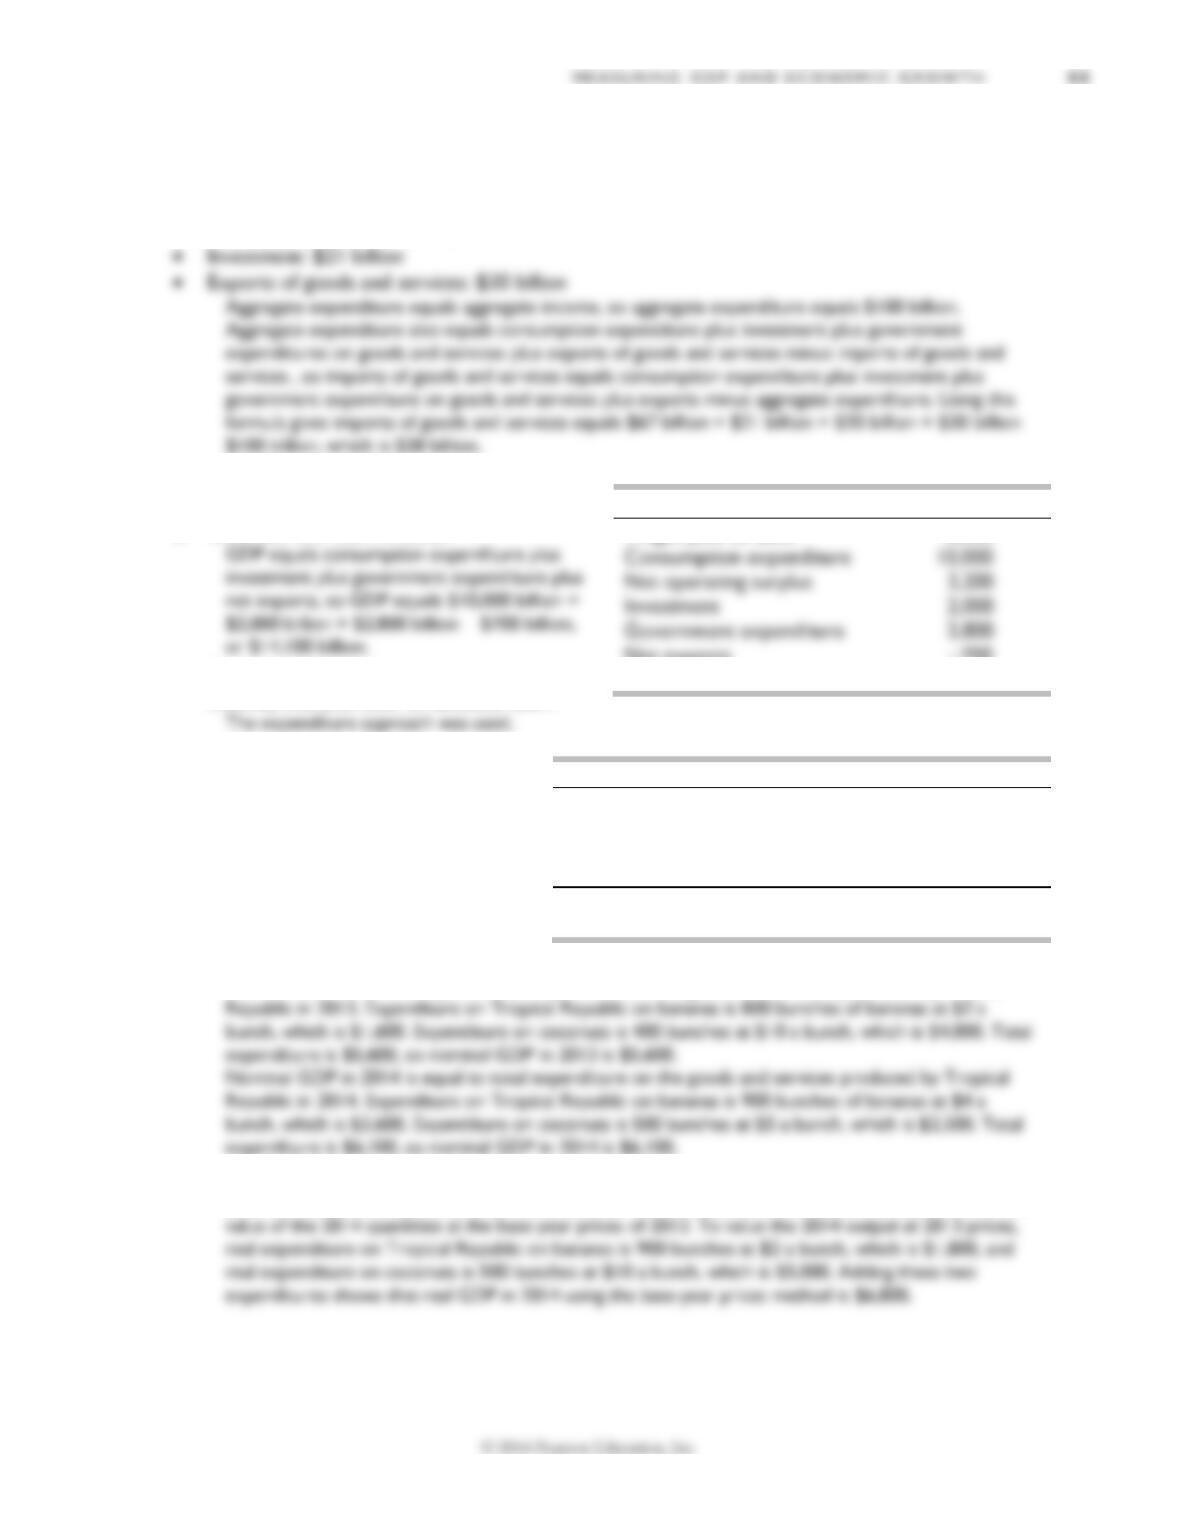
Consumption expenditure
Net operating surplus
3,200
Investment
2,000
Government expenditure
2,800
3. Use the following data to calculate aggregate expenditure and imports of goods and services.
• Government expenditure: $20 billion
• Aggregate income: $100 billion
• Consumption expenditure: $67 billion
4. The table lists some national accounts data for
the United States in 2008.
a. Calculate U.S. GDP in 2008.
b. Explain the approach (expenditure or
income) that you used to calculate GDP.
Use the following data to work Problems 5
and 6.
Tropical Republic produces only bananas and
coconuts. The base year is 2013, and the
tables give the quantities produced and the
prices.
5. Calculate nominal GDP in 2013 and
2014.
In 2013, nominal GDP is $5,600. In 2014, nominal GDP is $6,100.
Nominal GDP in 2013 is equal to total expenditure on the goods and services produced by Tropical
6. Calculate real GDP in 2014 expressed in base-year prices.
Real GDP in 2014 using base-year prices is $6,800. The base-year prices method calculates the market
Item
Billions of dollars
Wages paid to labor
8,000
Net exports
−700
Depreciation
1,800
Quantities
2013
2014
Bananas
800 bunches
900 bunches
Coconuts
400 bunches
500 bunches
Prices
2013
2014
Bananas
$2 a bunch
$4 a bunch
Coconuts
$10 a bunch
$5 a bunch
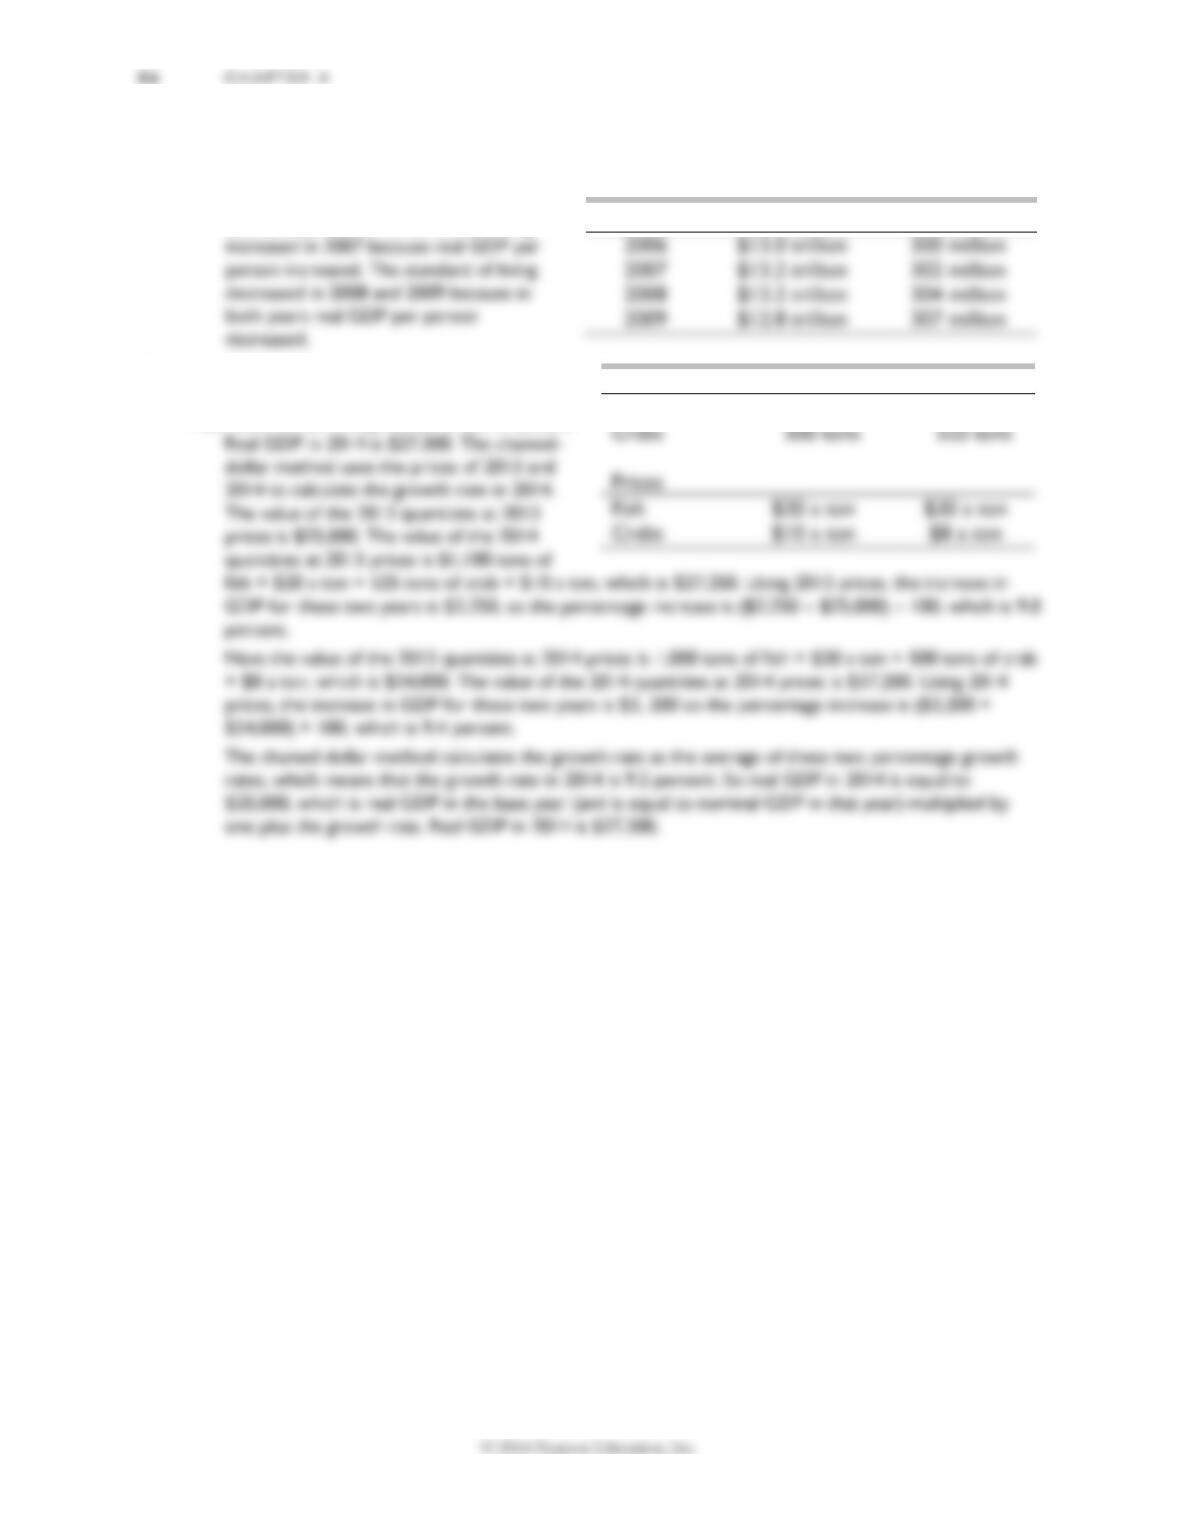
Crabs
Prices
Fish
Crabs
7. Use the table to work out in which year the U.S. standard of living (i) increases and (ii) decreases.
Explain your answer.
The standard of living is measured by real
GDP per person. The standard of living
8. An island economy produces only fish and
crabs. Calculate the island’s chained-dollar
real GDP in 2014 expressed in 2013 dollars.
Year
Real GDP
Population
Quantities
2013
2014
Fish
1,000 tons
1,100 tons
M E A S U R I N G G D P A N D E C O N O M I C G R O W T H 57
Answers to Additional Problems and Applications
9. Classify each of the following items as a final good or service or an intermediate good or service
and identify which is a component of consumption expenditure, investment, or government
expenditure on goods and services:
• Banking services bought by Google.
The banking services are an intermediate service.
Use Figure 4.2 to work Problems 10 and 11.
10. In 2013, flow A was $1,000 billion, flow C was $250 billion, flow B was $650 billion, and flow E
was $50 billion. Calculate investment.
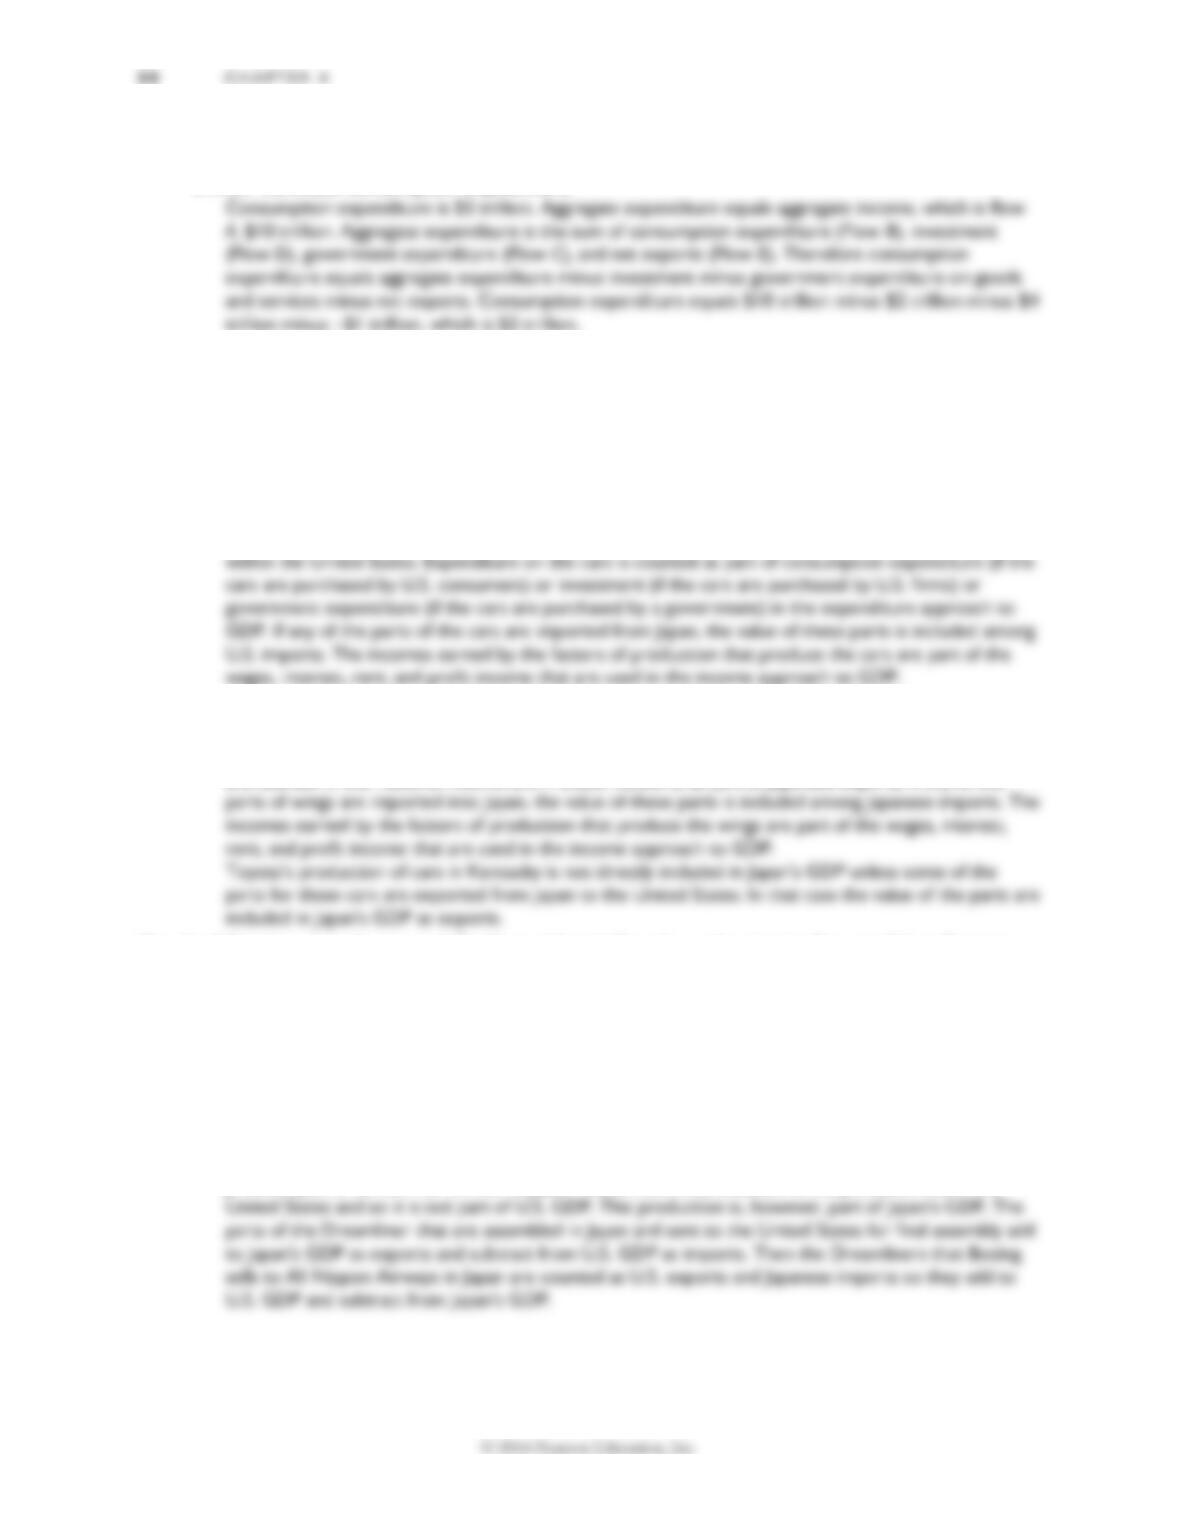
11. In 2014, flow D was $2 trillion, flow E was –$1 trillion, flow A was $10 trillion, and flow C was $4
trillion. Calculate consumption expenditure.
trillion minus −$1 trillion, which is $5 trillion.
Use the following information to work Problems 12 and 13.
Mitsubishi Heavy Industries makes the wings of the new Boeing 787 Dreamliner in Japan. Toyota
assembles cars for the U.S. market in Kentucky.
12. Explain where these activities appear in the U.S. National Income and Product Accounts.
When the Dreamliner wings are sent from Japan to the United States, they are counted in the U.S.
National Income and Product Accounts as imports, which is a negative entry in the expenditure
approach to U.S. GDP.
Toyota’s production of cars in Kentucky is included in U.S. GDP because it represents production
13. Explain where these activities appear in Japan’s National Income and Product Accounts.
Mitsubishi Heavy Industries’ production of Dreamliner wings in Japan is included in Japanese GDP
because it represents production within Japan. When these wings are sent to the United States, they
are counted in the National Income and Product Accounts as part of Japanese exports. If any of the
Use the following news clip to work Problems 14 and 15, and use the circular flow model to illustrate
your answers.
Boeing Bets the House
Boeing is producing some components of its new 787 Dreamliner in Japan and is assembling it in the
United States. Much of the first year’s production will be sold to ANA (All Nippon Airways), a Japanese
airline.
Source: The New York Times, May 7, 2006
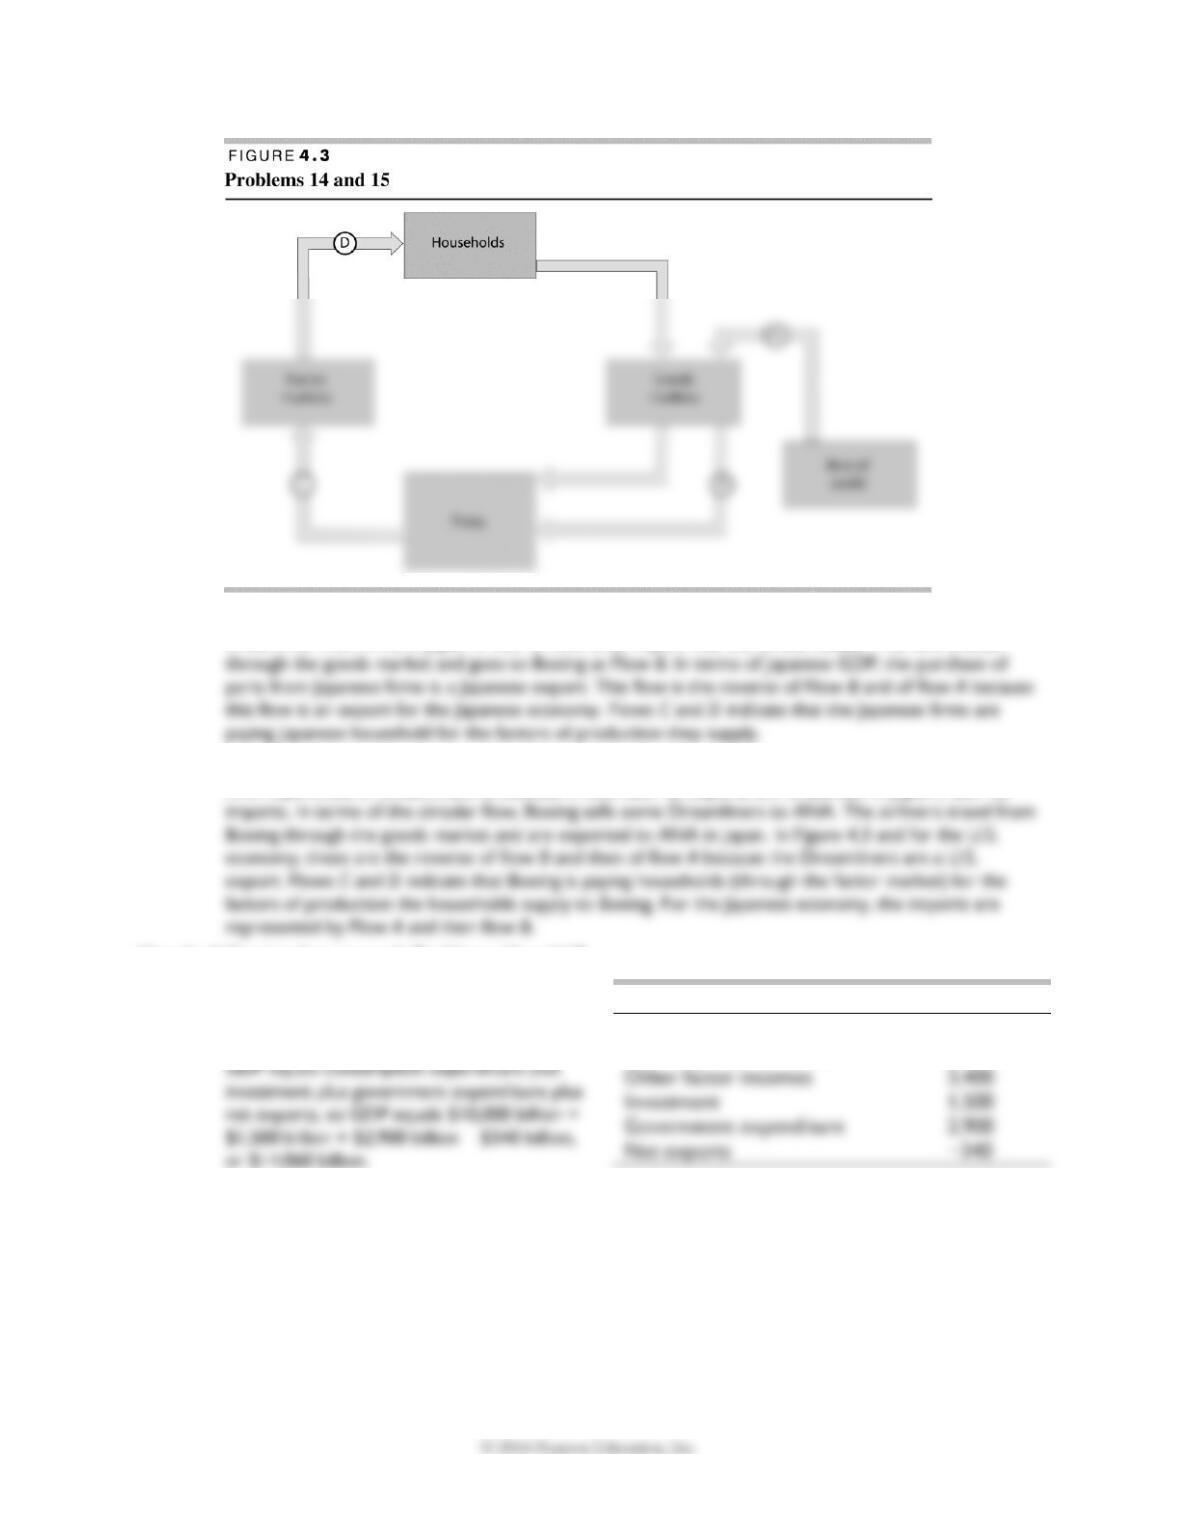
14. Explain how Boeing’s activities and its transactions affect U.S. and Japanese GDP.
Goods and services produced within the United States are part of U.S. GDP. Boeing’s decision to
produce part of its new 787 airliner in Japan means that this production is not produced within the
M E A S U R I N G G D P A N D E C O N O M I C G R O W T H 59
Other factor incomes
3,400
Investment
1,500
Government expenditure
Net exports
In terms of the circular flow diagram in Figure 4.3 and U.S. GDP, Boeing’s purchase of parts of the
Dreamliner from firms in Japan is flow is Flow A, an import into the United States. This flow travels
15. Explain how ANA’s activities and its transactions affect U.S. and Japanese GDP.
ANA’s purchase of Dreamliners is counted in U.S. GDP as exports and is counted in Japan’s GDP as
Use the following data to work Problems 16 and 17.
The table lists some macroeconomic data for the
United States in 2009.
16. Calculate U.S. GDP in 2009.
17. Explain the approach (expenditure or income) that you used to calculate GDP.
The expenditure approach was used.
Item
Billions of dollars
Wages paid to labor
8,000
Consumption expenditure
10,000
60 C H A P T E R 4
Apples
$0.50
Oranges
$0.25
Use the following data to work Problems 18 to 19.
An economy produces only apples and
oranges. The base year is 2012, and the table
gives the quantities produced and the prices.
18. Calculate nominal GDP in 2012 and
2013.
In 2012 nominal GDP is $50 and in
19. Calculate real GDP in 2012 and 2013 expressed in base-year prices.
Real GDP in 2012 is $50 and in 2013 is $135. Real GDP in the base year, 2012, is equal to nominal
20. GDP Expands 11.4 Percent, Fastest in 13 Years
China’s gross domestic product grew 11.4 percent last year and marked a fifth year of double-
digit growth. The increase was especially remarkable given that the United States is experiencing a
slowdown due to the sub-prime crisis and housing slump. Citigroup estimates that each 1 percent
drop in the U.S. economy will shave 1.3 percent off China’s growth, because Americans are heavy
users of Chinese products. In spite of the uncertainties, China is expected to post its sixth year of
double-digit growth next year.
Source: The China Daily, January 24, 2008
21. The United Nations’ Human Development Index (HDI) is based on real GDP per person, life
expectancy at birth, and indicators of the quality and quantity of education.
a. Explain why the HDI might be better than real GDP as a measure of economic welfare.
The HDI might be a better measure of economic welfare because it includes some important factors
b. Which items in the HDI are part of real GDP and which items are not in real GDP?
Quantities
2012
2013
Apples
60
160
Oranges
80
220
Prices
2012
2013
M E A S U R I N G G D P A N D E C O N O M I C G R O W T H 61
c. Do you think the HDI should be expanded to include items such as pollution, resource
depletion, and political freedom? Explain.
Ideally factors such as pollution, political freedom, and so forth should be included in a broad measure
d. What other items should be included in a comprehensive measure on economic welfare?
22. U.K. Living Standards Outstrip U.S.
Oxford analysts report that living standards in Britain are set to rise above those in America for
the first time since the nineteenth century. Real GDP per person in Britain will be £23,500 this
year, compared with £23,250 in America. But the Oxford analysts also point out that Americans
benefit from lower prices than those in Britain.
Source: The Sunday Times, January 6, 2008
If real GDP per person is greater in the United Kingdom than in the United States but Americans
pay lower prices, does this comparison of real GDP person really tell us which country has the
higher standard of living?
23. Use the news clip in Problem 20.
a. Why might China’s recent GDP growth rates overstate the actual increase in the level of
production taking place in China?
b. Explain the complications involved with attempting to compare the economic welfare in China
and the United States by using the GDP for each country.
China’s GDP is calculated using prices in China while U.S. GDP is calculated using prices in the United
24. Poor India Makes Millionaires at Fastest Pace
India, with the world’s largest population of poor people, created millionaires at the fastest pace
in the world in 2007. India added another 23,000 more millionaires in 2007 to its 2006 tally of
100,000 millionaires measured in dollars. That is 1 millionaire for about 7,000 people living on less
than $2 a day.
Source: The Times of India, June 25, 2008
a. Why might real GDP per person misrepresent the standard of living of the average Indian?
There are a few reasons why this measurement of real GDP per person misrepresents the standard of
living of the average Indian. First GDP includes only goods and services bought and sold in markets. In
b. Why might $2 a day underestimate the standard of living of the poorest Indians?
One important reason why the $2 a day estimate undervalues the standard of living of the poorest
Economics in the News
25. After you have studied Economics in the News on pp. 96–97 (504–505 in Economics), answer the
following questions.
a. By what percentage did real GDP grow from the second quarter of 2013 to the second quarter
of 2014? (You can find the data you need to calculate this percentage change on p. 97 [505 in
Economics].)
Real GDP in the second quarter of 2014 was $15,986 billion. It had increased by $379 billion since the
b. Comparing the increase in the second quarter with the year-on-year increase, what can you say
about the change in the real GDP growth rate? Is it slowing or speeding up?
of real GDP was speeding up.
c. Describe the relationship between the fluctuations in the change in real GDP and business
inventory investment. Why might inventory changes sometimes lag real GDP changes?
26. Totally Gross
GDP has proved useful in tracking both short-term fluctuations and long-run growth. Which isn’t
to say GDP doesn’t miss some things. Amartya Sen, at Harvard, helped create the United
Nations’ Human Development Index, which combines health and education data with per capita
GDP to give a better measure of the wealth of nations. Joseph Stiglitz, at Columbia, advocates a
“green net national product” that takes into account the depletion of natural resources. Others
want to include happiness in the measure. These alternative benchmarks have merit but can they
be measured with anything like the frequency, reliability, and impartiality of GDP?
Source: Time, April 21, 2008
a. Explain the factors that the new clip identifies as limiting the usefulness of GDP as a measure of
economic welfare.
GDP focuses on the amount of goods and services produced. While goods and services lead to
b. What are the challenges involved in trying to incorporate measurements of those factors in an
effort to better measure economic welfare?
c. What does the ranking of the United States in the Human Development Index imply about the
levels of health and education relative to other nations?
27. Use the information in Problem 18 to calculate the chained-dollar real GDP in 2013 expressed in
2012 dollars.
Real GDP in 2013 is $135.70. The chained-dollar method uses the prices of 2012 and 2013 to calculate
the growth rate in 2013. The value of the 2012 quantities at 2012 prices is $50. The value of the 2013