Chapter 04 – Elasticity
4-1
Chapter 04 Elasticity
QUESTIONS
1. Explain why the choice between 1, 2, 3, 4, 5, 6, 7, and 8 “units,” or 1000, 2000, 3000, 4000, 5000,
6000, 7000, and 8000 movie tickets, makes no difference in determining elasticity in Table 4.1. LO1
Answer: Price elasticity of demand is determined by comparing the percentage change in
price and the percentage change in quantity demanded. The percentage change in quantity
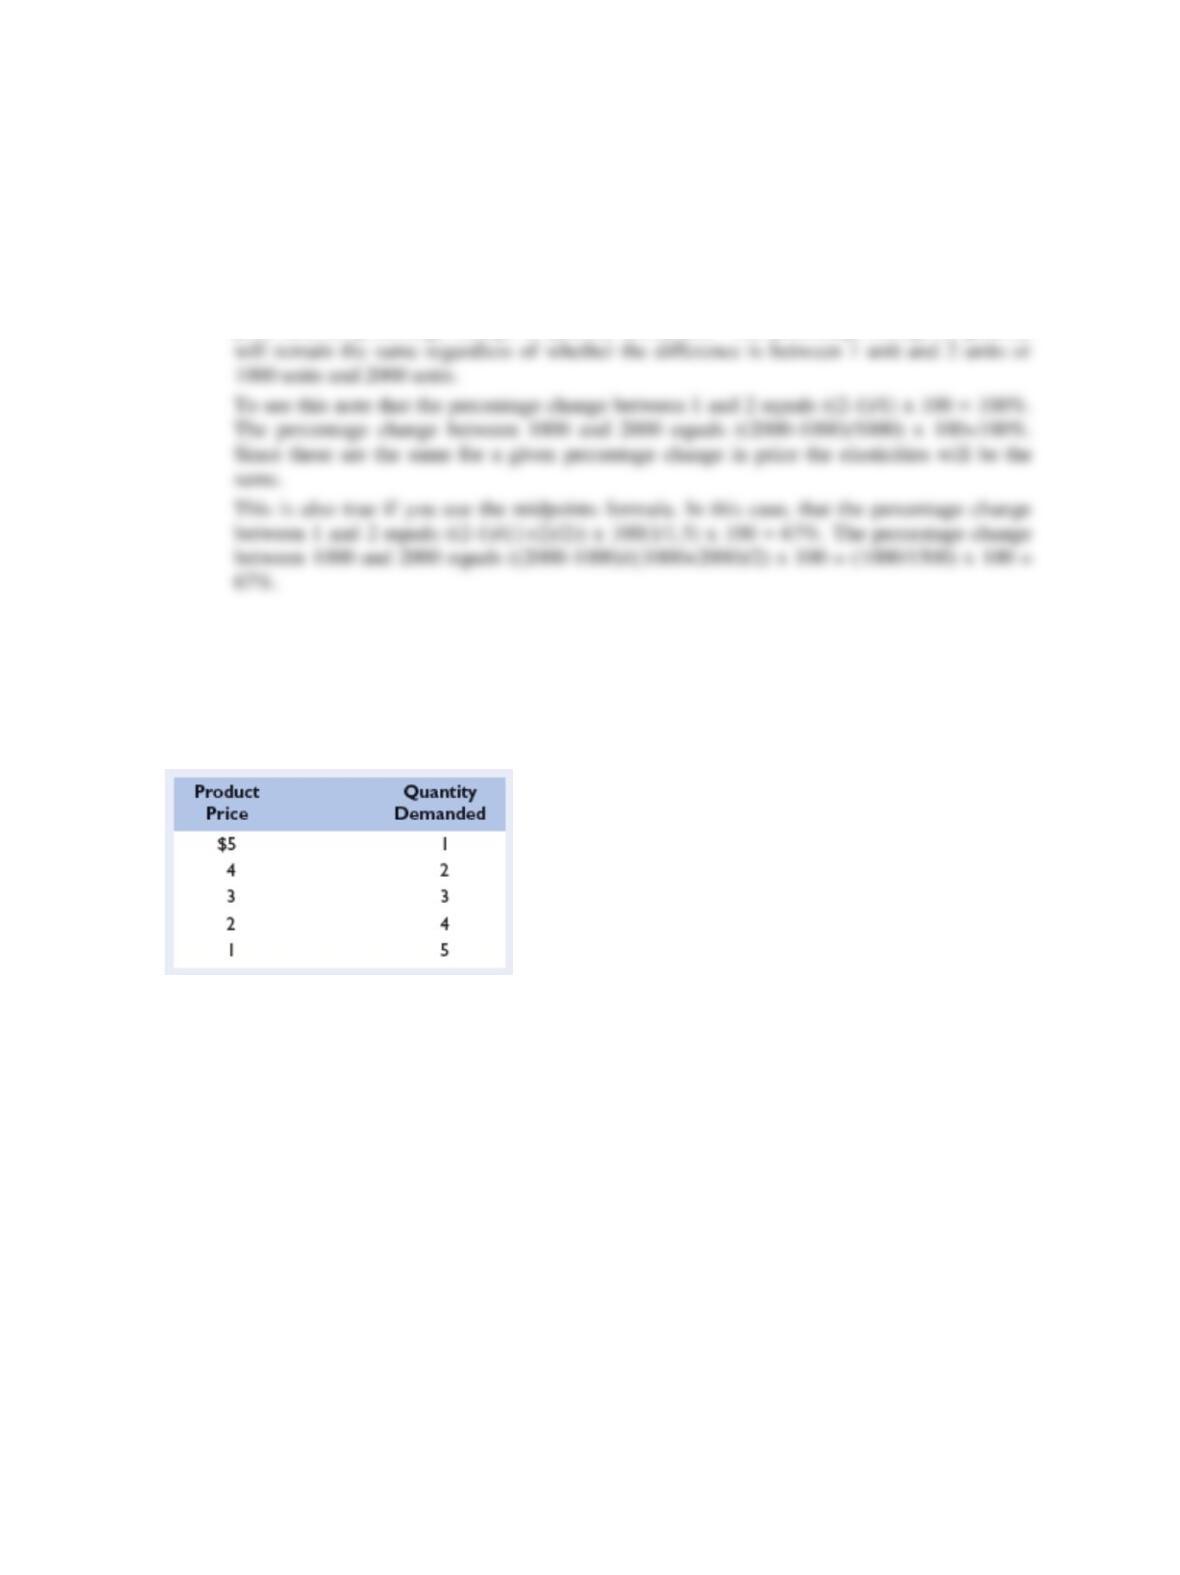
2. Graph the accompanying demand data, and then use the midpoint formula for Ed to determine
price elasticity of demand for each of the four possible $1 price changes. What can you conclude
about the relationship between the slope of a curve and its elasticity?
Explain in a nontechnical way why demand is elastic in the northwest segment of the demand curve
and inelastic in the southeast segment. LO1
Chapter 04 – Elasticity
4-2
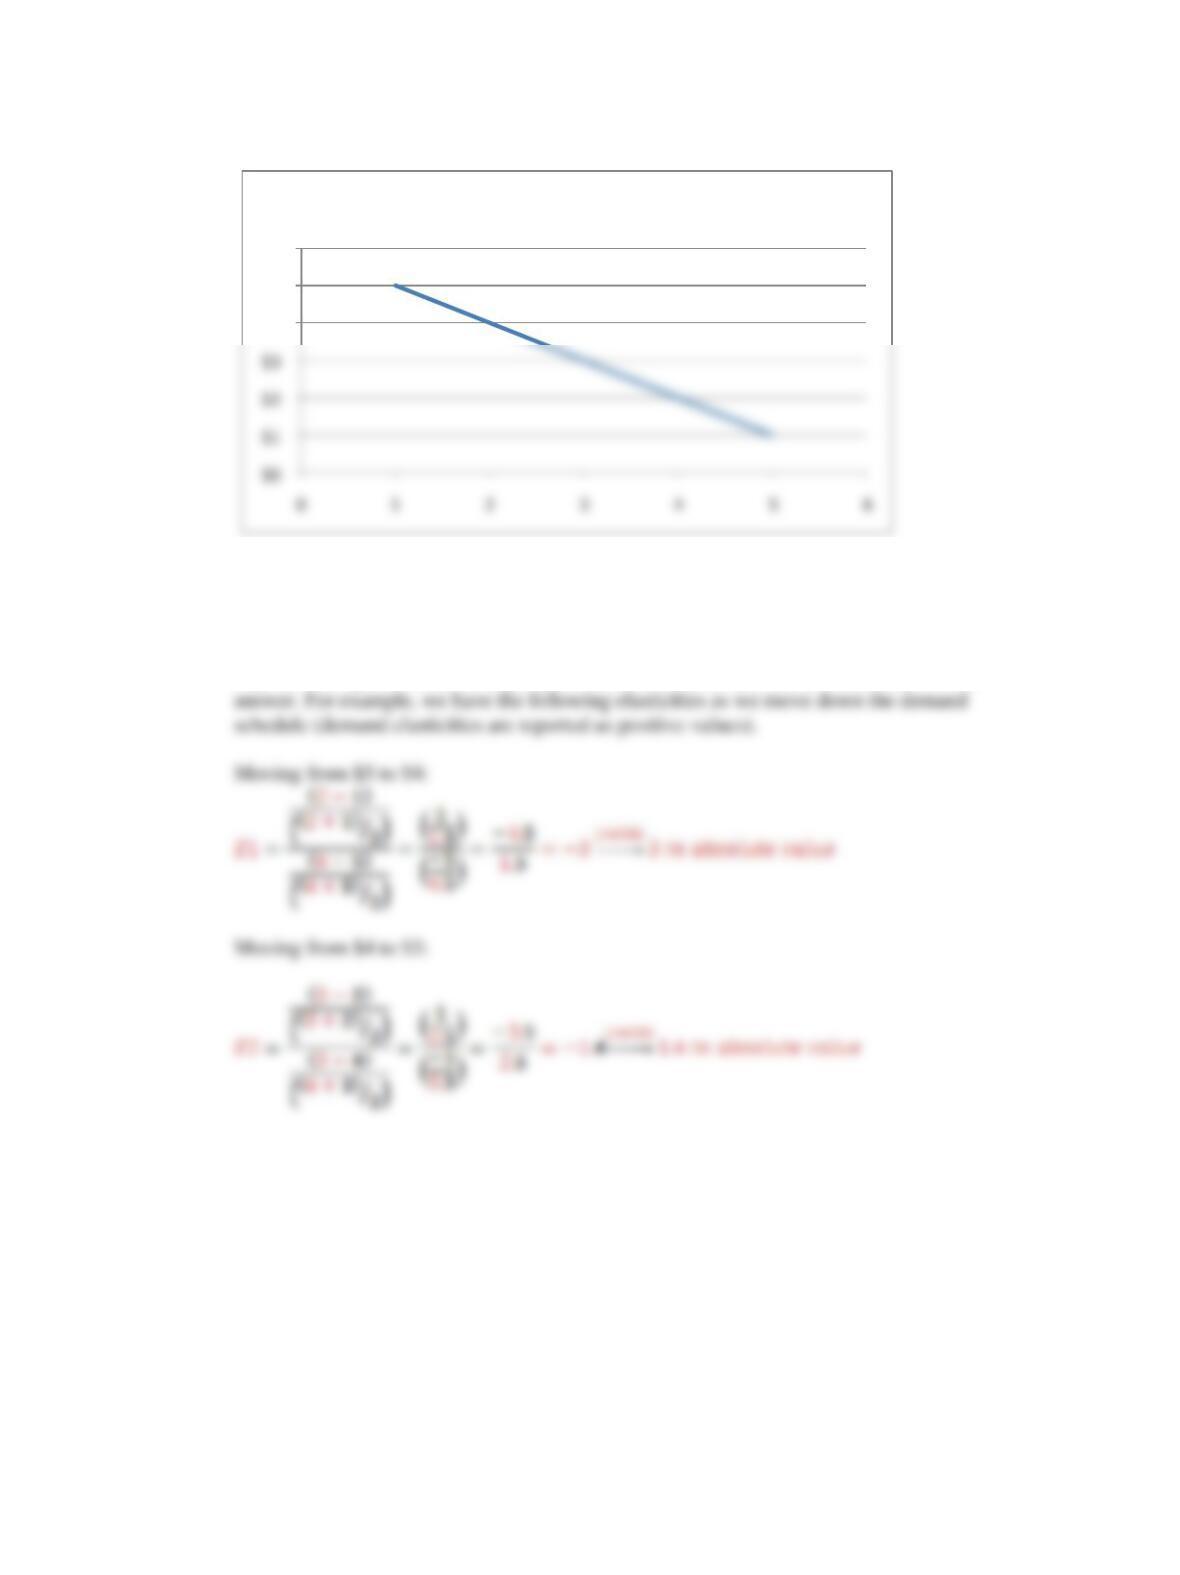
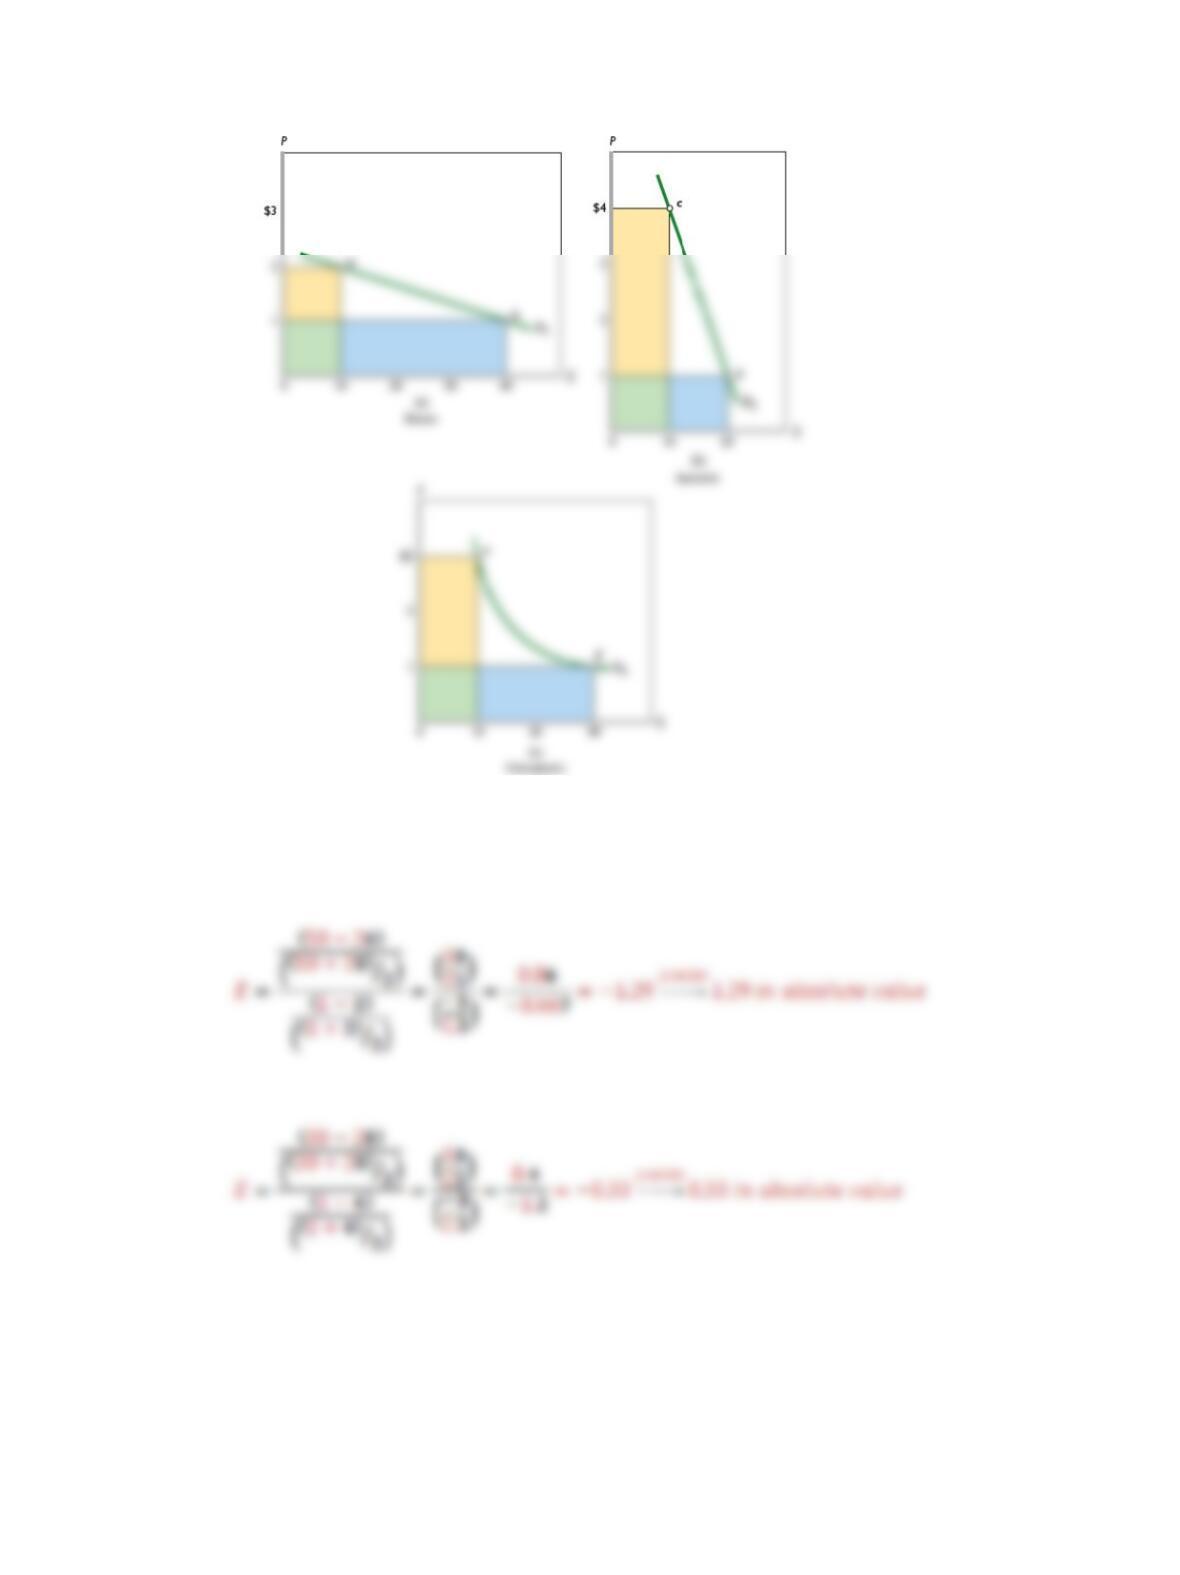
Answer: The graph of the data is:
$4
$5
$6
Demand Schedule
To calculate the elasticity, we use the midpoint formula.
First we calculate the percentage change in quantity. Second we calculate the percentage
change in price. Then we divide the percentage change in quantity by the percentage change
in price. To report the values as positive numbers we then take the absolute value of the
The same process applies to further reductions in price (and increase in quantity): As we
move from $3 to $2 the elasticity is 0.714. As we move from $2 to $1 the elasticity is 0.333.
Chapter 04 – Elasticity
4-3
This demand curve has a constant slope of -1 (= -1/1), but elasticity declines as we move
down the curve. When the initial price is high and initial quantity is low, a unit change in
price is a low percentage while a unit change in quantity is a high percentage change. The
3. What are the major determinants of price elasticity of demand? Use those determinants and your
own reasoning in judging whether demand for each of the following products is probably elastic or
inelastic: (a) bottled water; (b) toothpaste; (c) Crest toothpaste; (d) ketchup; (e) diamond bracelets; (f)
Microsoft’s Windows operating system. LO1
Answer:The key determinants of price elasticity are substitutability, proportion of income;
luxury versus necessity, and time.
4. What effect would a rule stating that university students must live in university dormitories have on
the price elasticity of demand for dormitory space? What impact might this in turn have on room
rates? LO1
Answer: The ruling would make the price elasticity of demand more inelastic than if there
were no such rule, assuming that there is not another equivalent university nearby to which
Chapter 04 – Elasticity
4-4
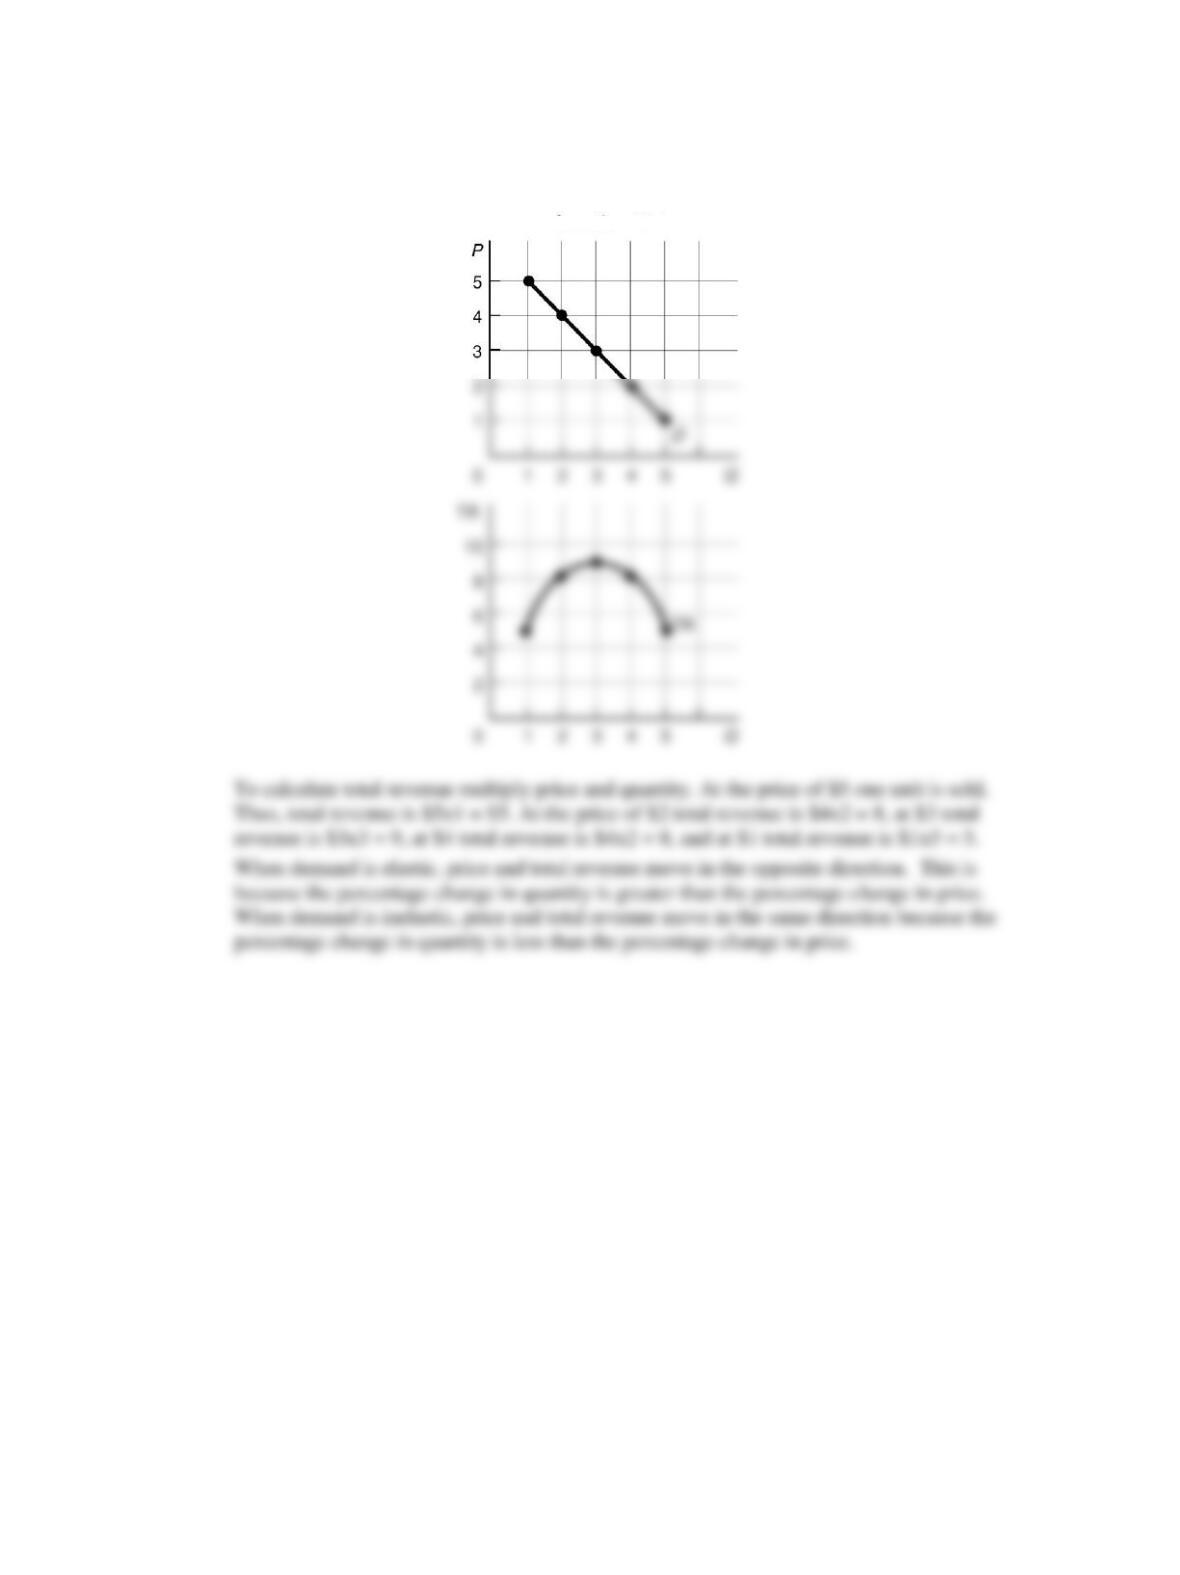
5. Calculate total-revenue data from the demand schedule in question 2. Graph total revenue below
your demand curve. Generalize about the relationship between price elasticity and total revenue. LO2
Answer:
6. How would the following changes in price affect total revenue? That is, would total revenue
increase, decrease, or remain unchanged? LO2
a. Price falls and demand is inelastic.
b. Price rises and demand is elastic.
c. Price rises and supply is elastic.
d. Price rises and supply is inelastic.
e. Price rises and demand is inelastic.
f. Price falls and demand is elastic.
g. Price falls and demand is of unit elasticity.
Chapter 04 – Elasticity
4-5
Answer: When demand is elastic, price and total revenue move in the opposite direction.
This is because the percentage change in quantity is greater than the percentage change in
7. In 2006, Willem De Kooning’s abstract painting Woman III sold for $137.5 million. Portray this
sale in a demand and supply diagram and comment on the elasticity of supply. Comedian George
Carlin once mused, “If a painting can be forged well enough to fool some experts, why is the original
so valuable?” Provide an answer. LO3
Answer: The supply is perfectly inelastic—vertical—at a quantity of 1 unit. The $137.5
million price is determined where the downward sloping demand curve intersected this
8. Suppose the cross elasticity of demand for products A and B is +3.6 and for products C and D is –
5.4. What can you conclude about how products A and B are related? Products C and D? LO4
Answer: The cross elasticity relates the percentage change in quantity to the percentage
change in price of a different good. If the cross elasticity is positive this implies that and
Chapter 04 – Elasticity
4-6
9. The income elasticities of demand for movies, dental services, and clothing have been estimated to
be +3.4, +1, and +.5, respectively. Interpret these coefficients. What does it mean if an income
elasticity coefficient is negative? LO4
Answer: All are normal goods—income and quantity demanded move in the same direction.
These coefficients reveal that a 1 percent increase in income will increase the quantity of
10. Research has found that an increase in the price of beer would reduce the amount of marijuana
consumed. Is cross elasticity of demand between the two products positive or negative? Are these
products substitutes or complements? What might be the logic behind this relationship? LO4
Answer: If the cross elasticity is negative, this implies that an increase in the price of one
good results in a decrease in the quantity purchased of another good. This implies that the
11. LAST WORD What is the purpose of charging different groups of customers different prices?
Supplement the three broad examples in the Last Word with two additional examples of your own.
Hint: Think of price discounts based on group characteristics or time of purchase.
Answer: The primary purpose for charging different prices is to increase revenue and, in
Chapter 04 – Elasticity
4-7
PROBLEMS
1. Look at the demand curve in Figure 4.2a. Use the midpoint formula and points a and b to calculate
the elasticity of demand for that range of the demand curve. Do the same for the demand curves in
Figures 4.2b and 4.2c using, respectively, points c and d for Figure 4.2b and points e and f for Figure
4.2c. LO1
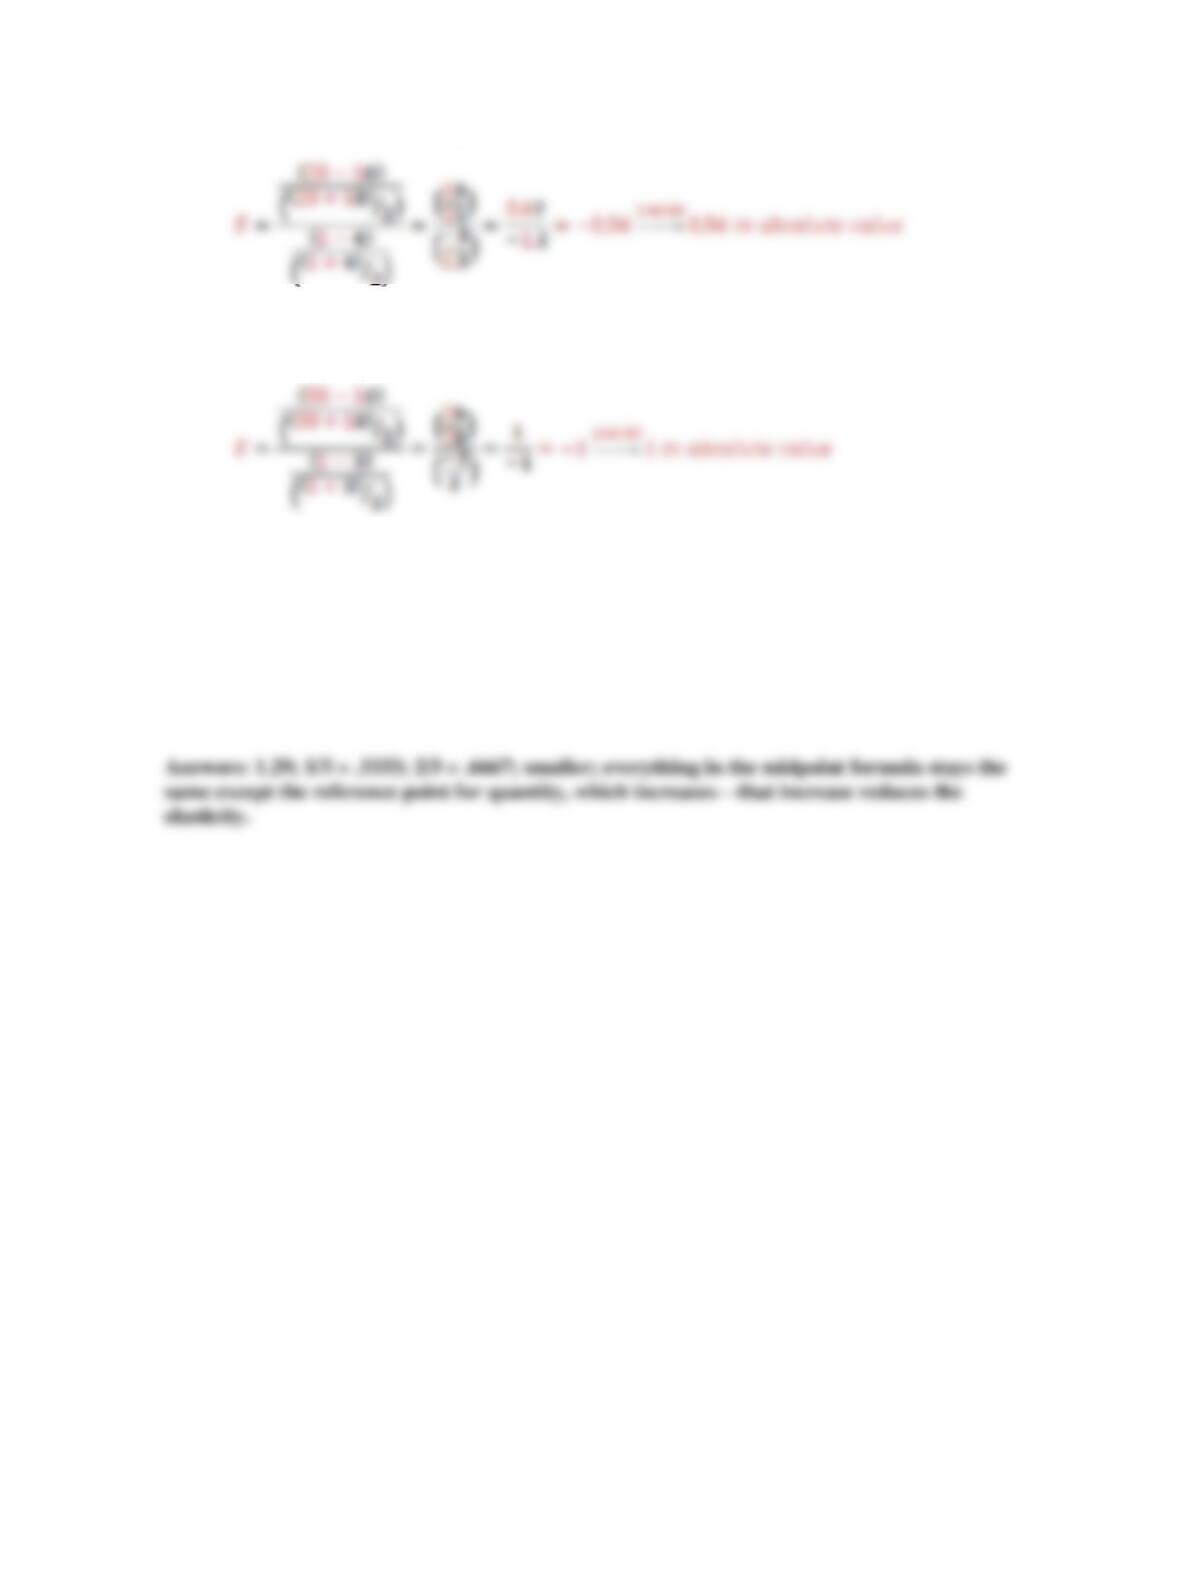
Answers: 9/5 = 1.8; 5/9 = .5556; 1.
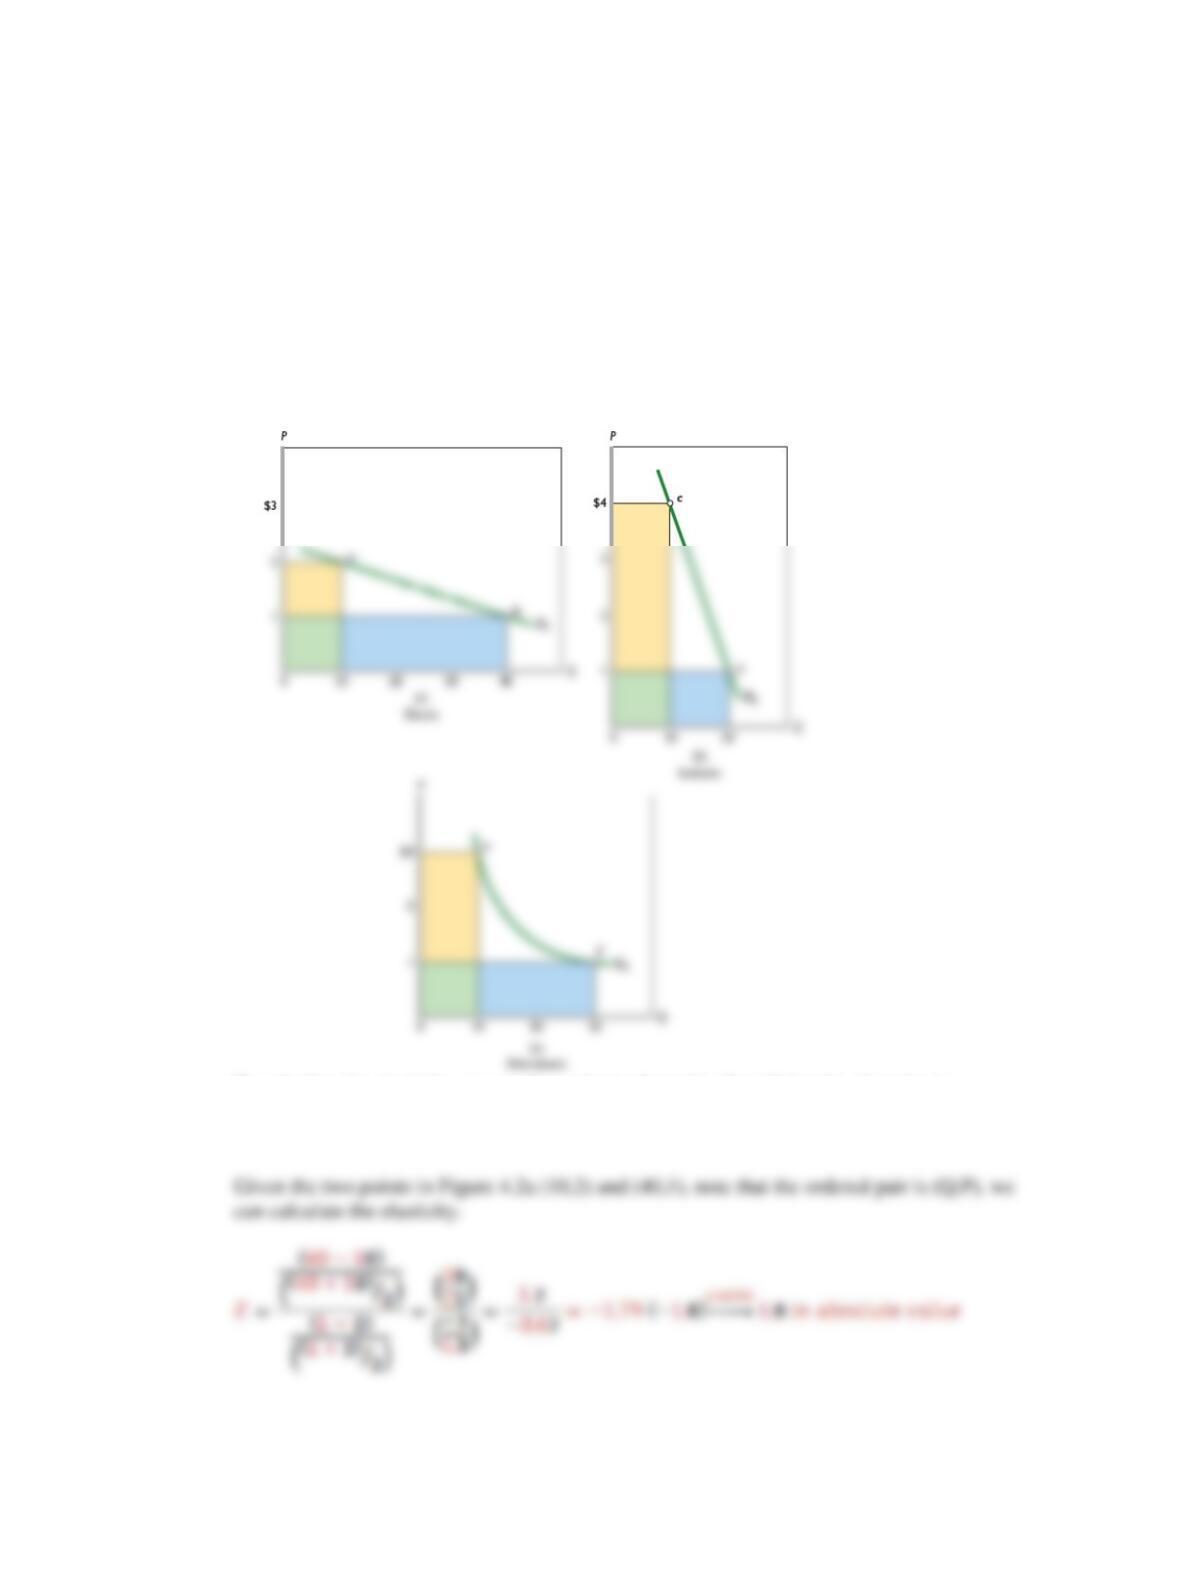
Feedback: Consider the following figures taken from the textbook (Figures 4.2a, 4.2b, and
4.2c).
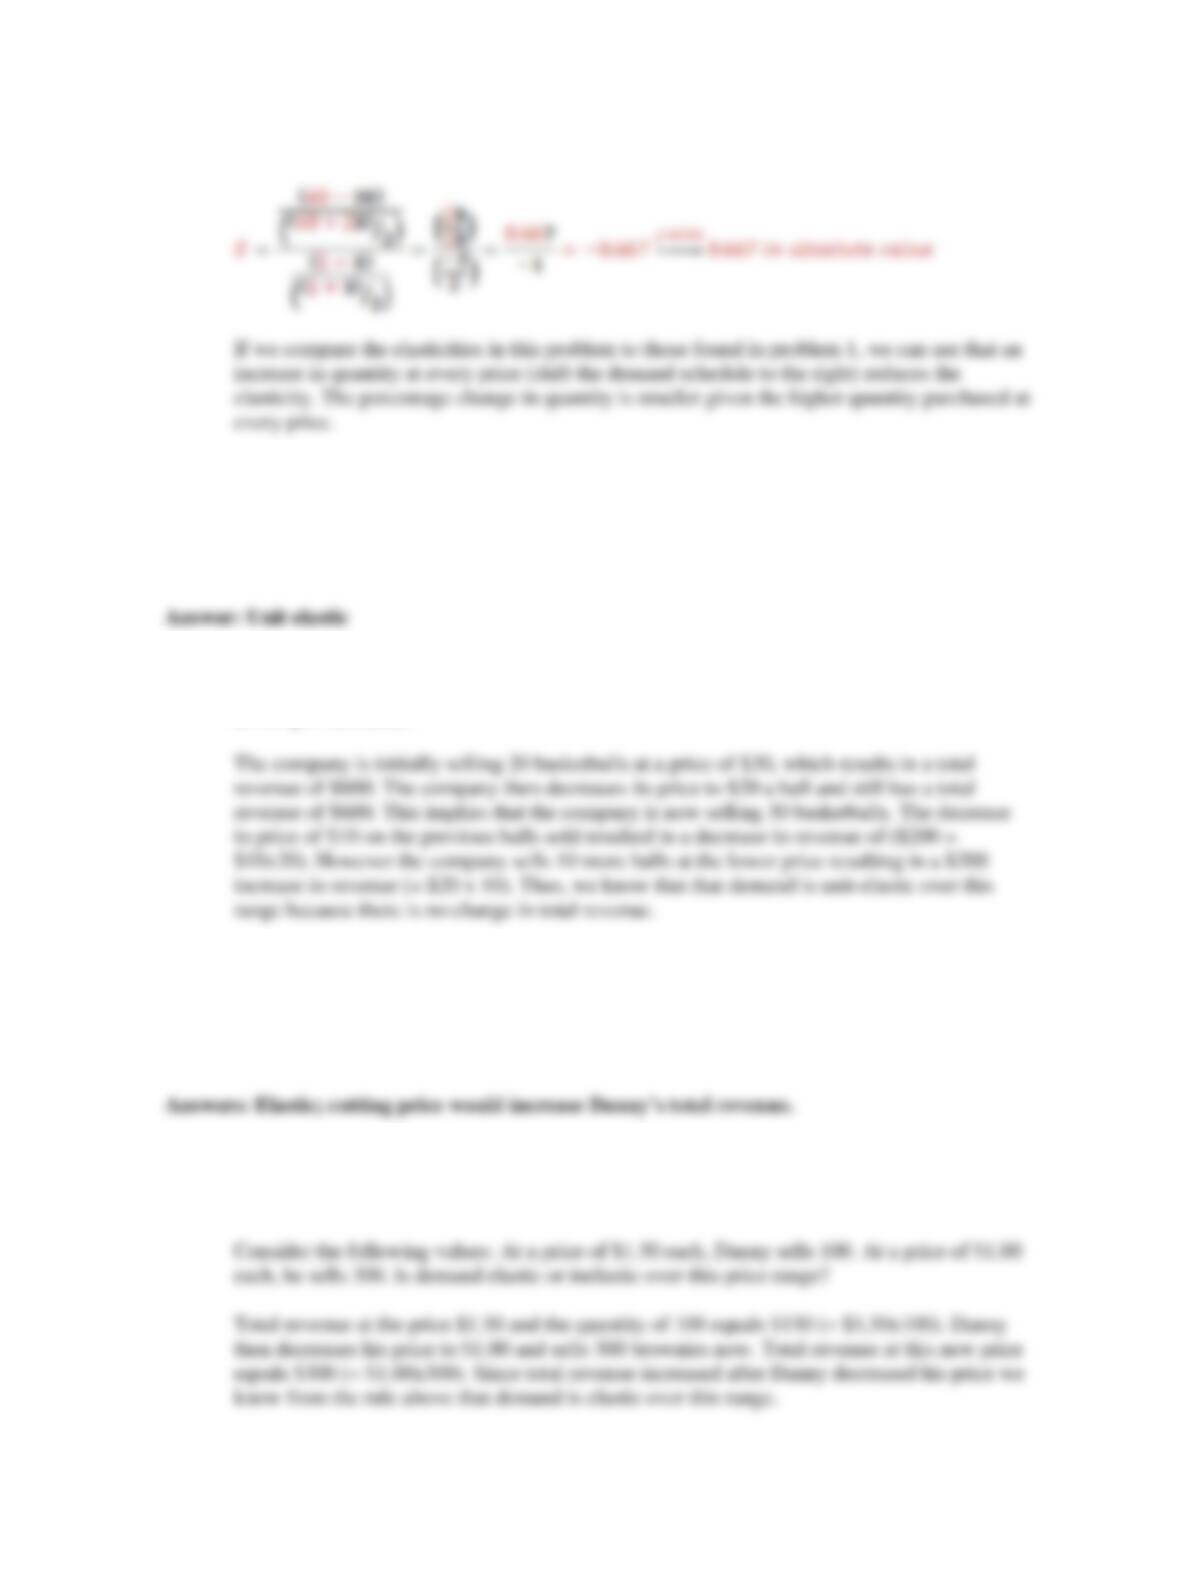
To calculate the elasticity, we use the midpoint formulas. Recall that the elasticity is
percentage change in quantity divided by the percentage change in price. We take the
absolute value to convert the elasticity to a positive number.
Chapter 04 – Elasticity
4-8
Given the two points in Figure 4.2b (10,4) and (20,1), we can calculate the elasticity.
Given the two points in Figure 4.2c (10,3) and (30,1), we can calculate the elasticity. (Note
this is an approximation of the nonlinear schedule.)
2. Investigate how demand elasticities are affected by increases in demand. Shift each of the
demand curves in Figures 4.2a, 4.2b, and 4.2c to the right by 10 units. For example, point a in
Figure 4.2a would shift rightward from location (10 units, $2) to (20 units, $2) while point b would
shift rightward from location (40 units, $1) to (50 units, $1). After making these shifts, apply the
midpoint formula to calculate the demand elasticities for the shifted points. Are they larger or
smaller than the elasticities you calculated in Problem 1 for the original points? In terms of the
midpoint formula, what explains the change in elasticities? LO1
Feedback: Once again, consider the following figures taken from the textbook (Figures 4.2a,
4.2b, and 4.2c).
Chapter 04 – Elasticity
4-9
Here everything remains the same, but the quantity units in the ordered pairs (Q,P) increase
by 10 units.
Given the initial two points in Figure 4.2a (10,2) and (40,1), we now have the two points
(20,2) and (50,1).
Given the two points in Figure 4.2b (10,4) and (20,1), we now have (20,4) and (30,1).
Chapter 04 – Elasticity
4-10
Given the two points in Figure 4.2c (10,3) and (30,1), we now have (20,3) and (40,1).
3. Suppose that the total revenue received by a company selling basketballs is $600 when the price is
set at $30 per basketball and $600 when the price is set at $20 per basketball. Without using the
midpoint formula, can you tell whether demand is elastic, inelastic, or unit-elastic over this price
range? LO2
Feedback: Consider the following values: Total revenue received by a company selling
basketballs is $600 when the price is set at $30 per basketball and $600 when the price is set
at $20 per basketball.
4. Danny “Dimes” Donahue is a neighborhood’s 9-year old entrepreneur. His most recent venture is
selling homemade brownies that he bakes himself. At a price of $1.50 each, he sells 100. At a price of
$1.00 each, he sells 300. Is demand elastic or inelastic over this price range? If demand had the same
elasticity for a price decline from $1.00 to $0.50 as it does for the decline from $1.50 to $1.00, would
cutting the price from $1.00 to $0.50 increase or decrease Danny’s total revenue? LO2
Feedback: The total revenue rule implies that demand is elastic when revenue and price
move in opposite directions. In other words, a decrease in price results in an increase in total
revenue. We can use this rule to answer this question.
Chapter 04 – Elasticity
4-11
5. What is the formula for measuring the price elasticity of supply? Suppose the price of apples goes
up from $20 to $22 a box. In direct response, Goldsboro Farms supplies 1200 boxes of apples instead
of 1000 boxes. Compute the coefficient of price elasticity (midpoints approach) for Goldsboro’s
supply. Is its supply elastic, or is it inelastic? LO3
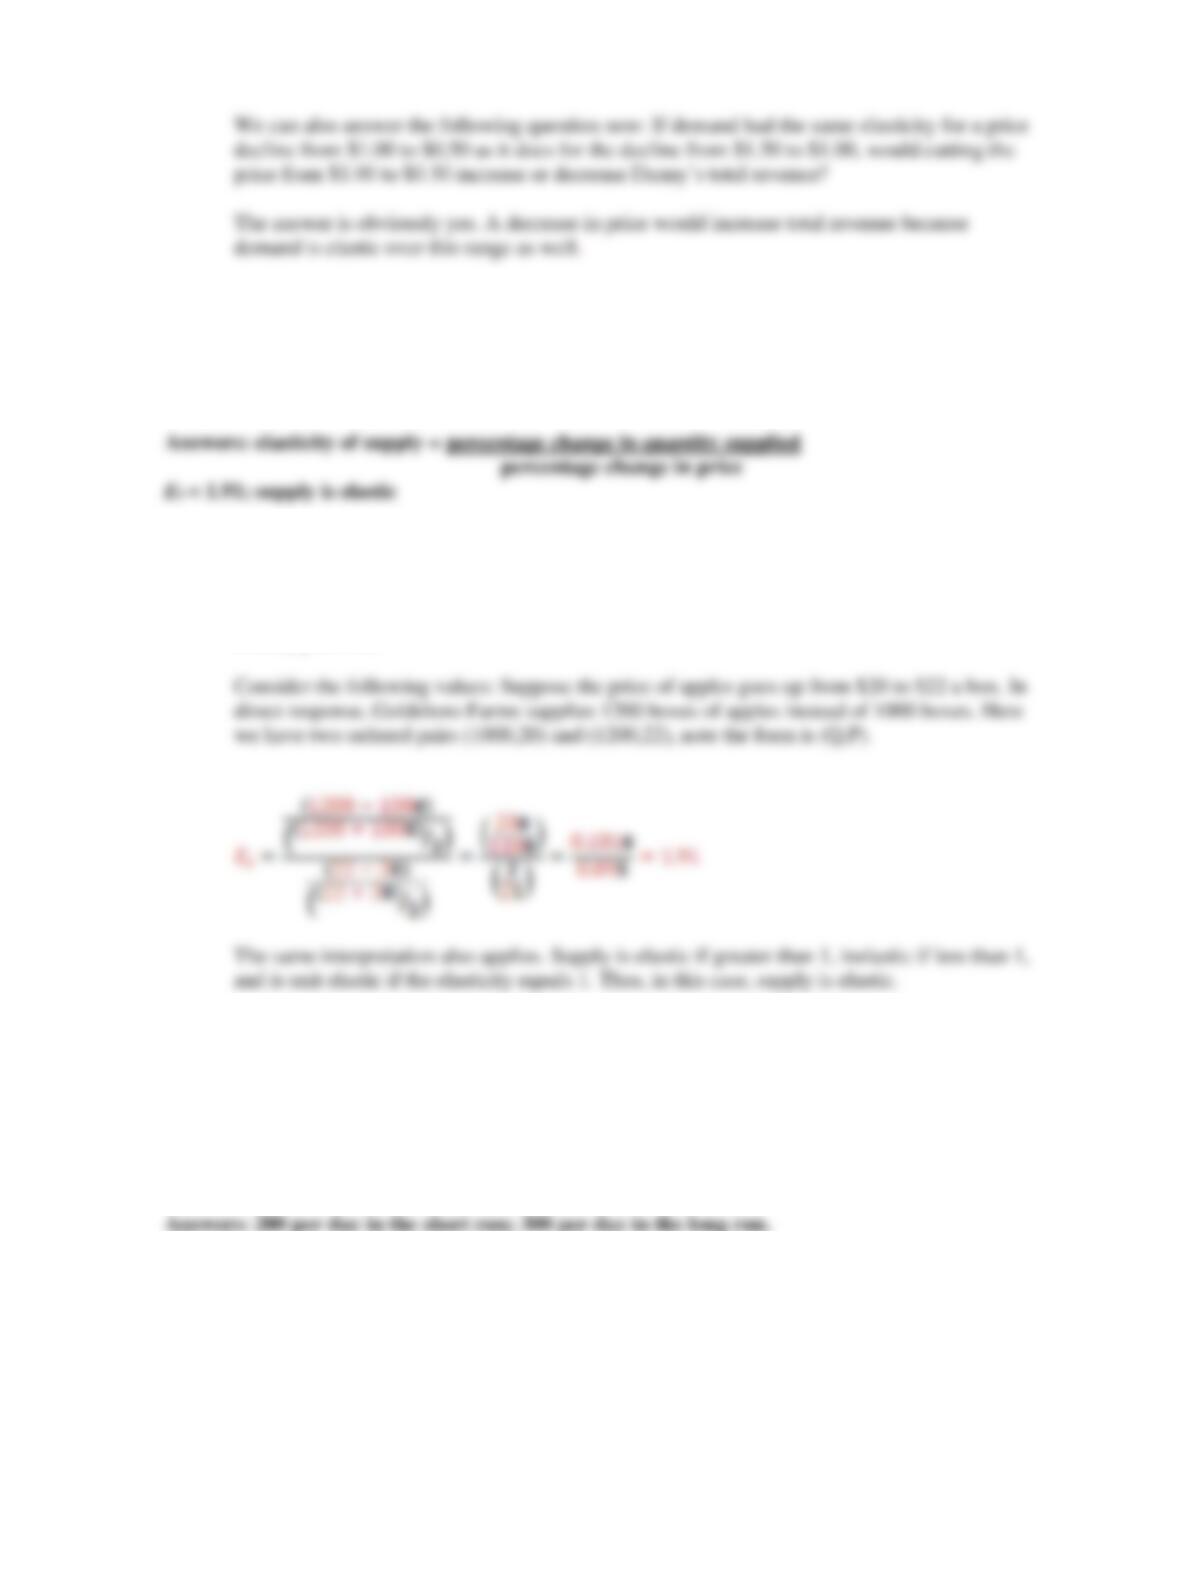
Feedback: The formula for measuring the elasticity of supply is the same as the formula for
measuring the elasticity of demand. Divide the percentage change in quantity by the
percentage change in price. The only difference is that we do not need to take absolute value
here because the price and quantity will move in the same direction (implying the elasticity is
already positive).
6. ADVANCED ANALYSIS Currently, at a price of $1 each, 100 popsicles are sold per day in the
perpetually hot town of Rostin. Consider the elasticity of supply. In the short run, a price increase
from $1 to $2 is unit elastic (Es = 1.0). So how many popsicles will be sold each day in the short run
if the price rises to $2 each? In the long run, a price increase from $1 to $2 has an elasticity of supply
of 1.50. So how many popsicles will be sold per day in the long run if the price rises to $2 each?
(Hint: Apply the midpoints approach to the elasticity of supply.) LO3
Chapter 04 – Elasticity
4-12
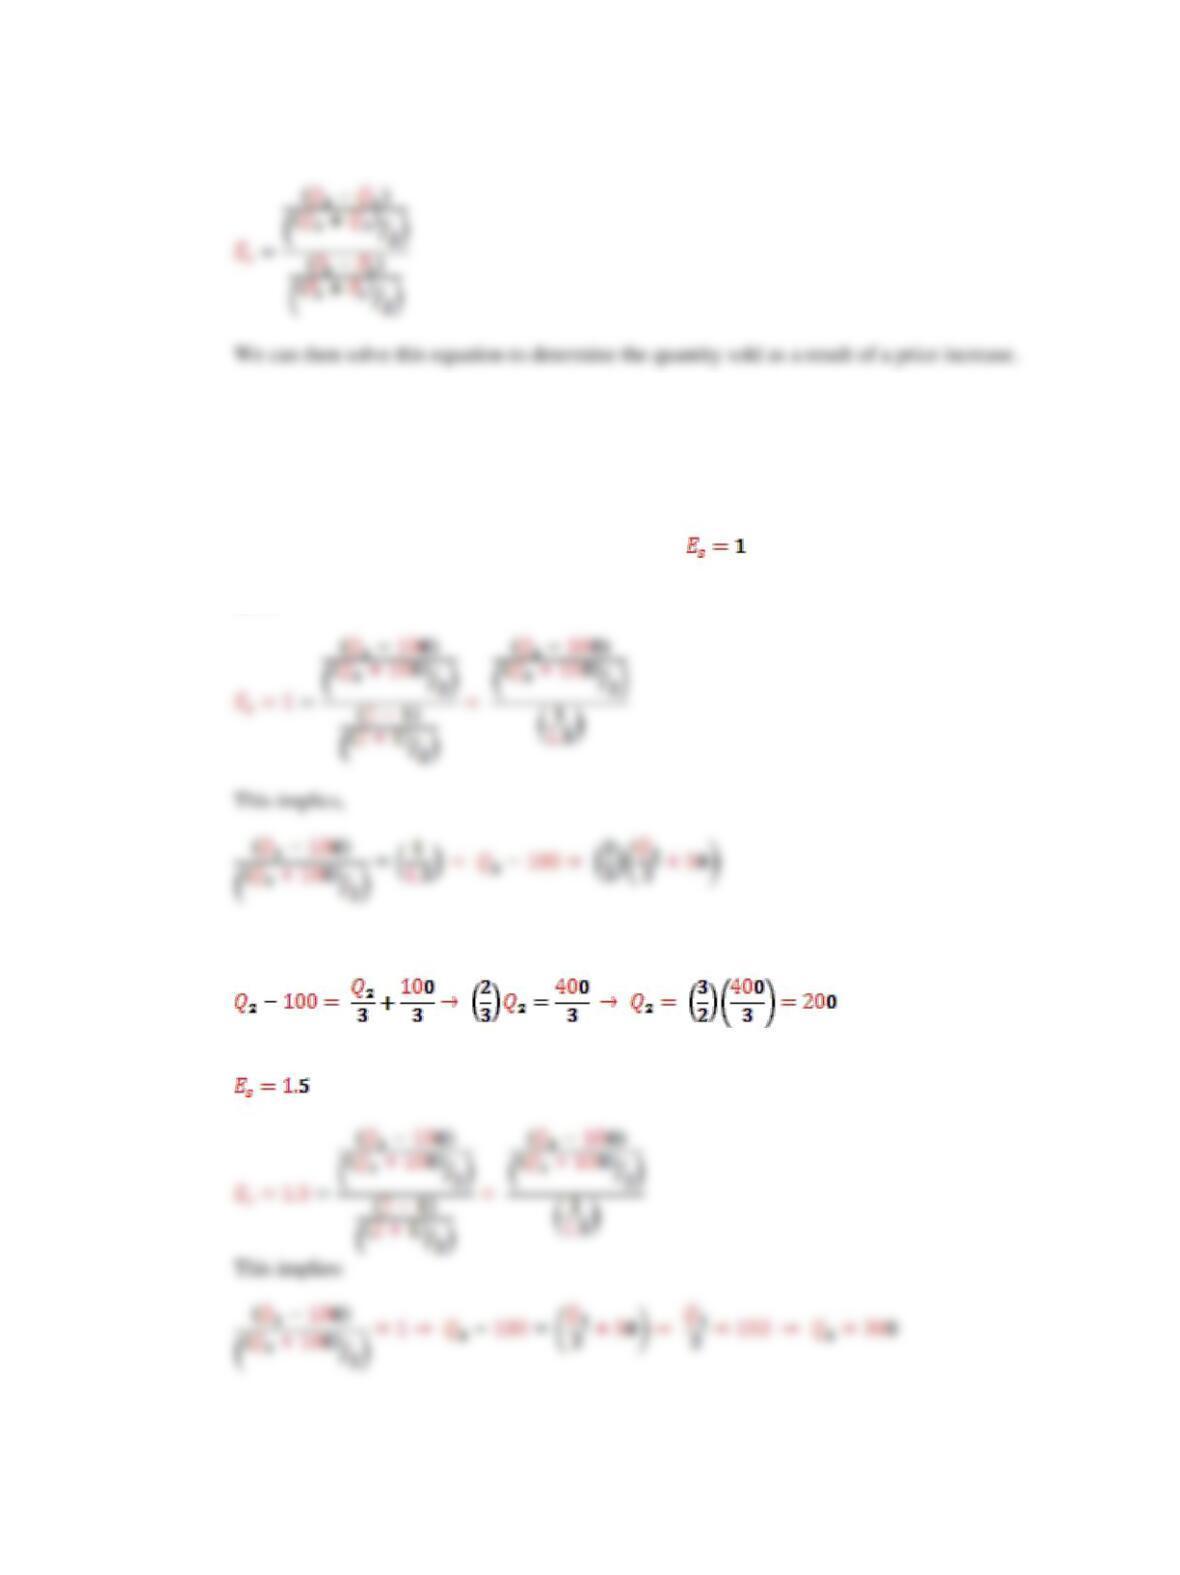
Feedback: To answer this question we need to use the midpoint formula. Assume we have
the two ordered pairs (Q1,P1) and (Q2,P2).
Consider the following values: At a price of $1 each, 100 popsicles are sold per day in
Rostin. In the short run, a price increase from $1 to $2 is unit elastic (Es = 1.0). So how
many popsicles will be sold each day in the short run if the price rises to $2 each? In the long
run, a price increase from $1 to $2 has an elasticity of 1.50. So how many popsicles will be
sold per day in the long run if the price rises to $2 each?
For the short run we have the following information. with the ordered pairs of (100,1)
and (Q2,2). Here we need to solve for Q2. Substituting the values into the above formula, we
have:
Solving for Q2 we have the following:
We can do the same exercise for the long run. Here we have the following information.
with the ordered pairs of (100,1) and (Q2,2). Here we need to solve for Q2.
Chapter 04 – Elasticity
4-13
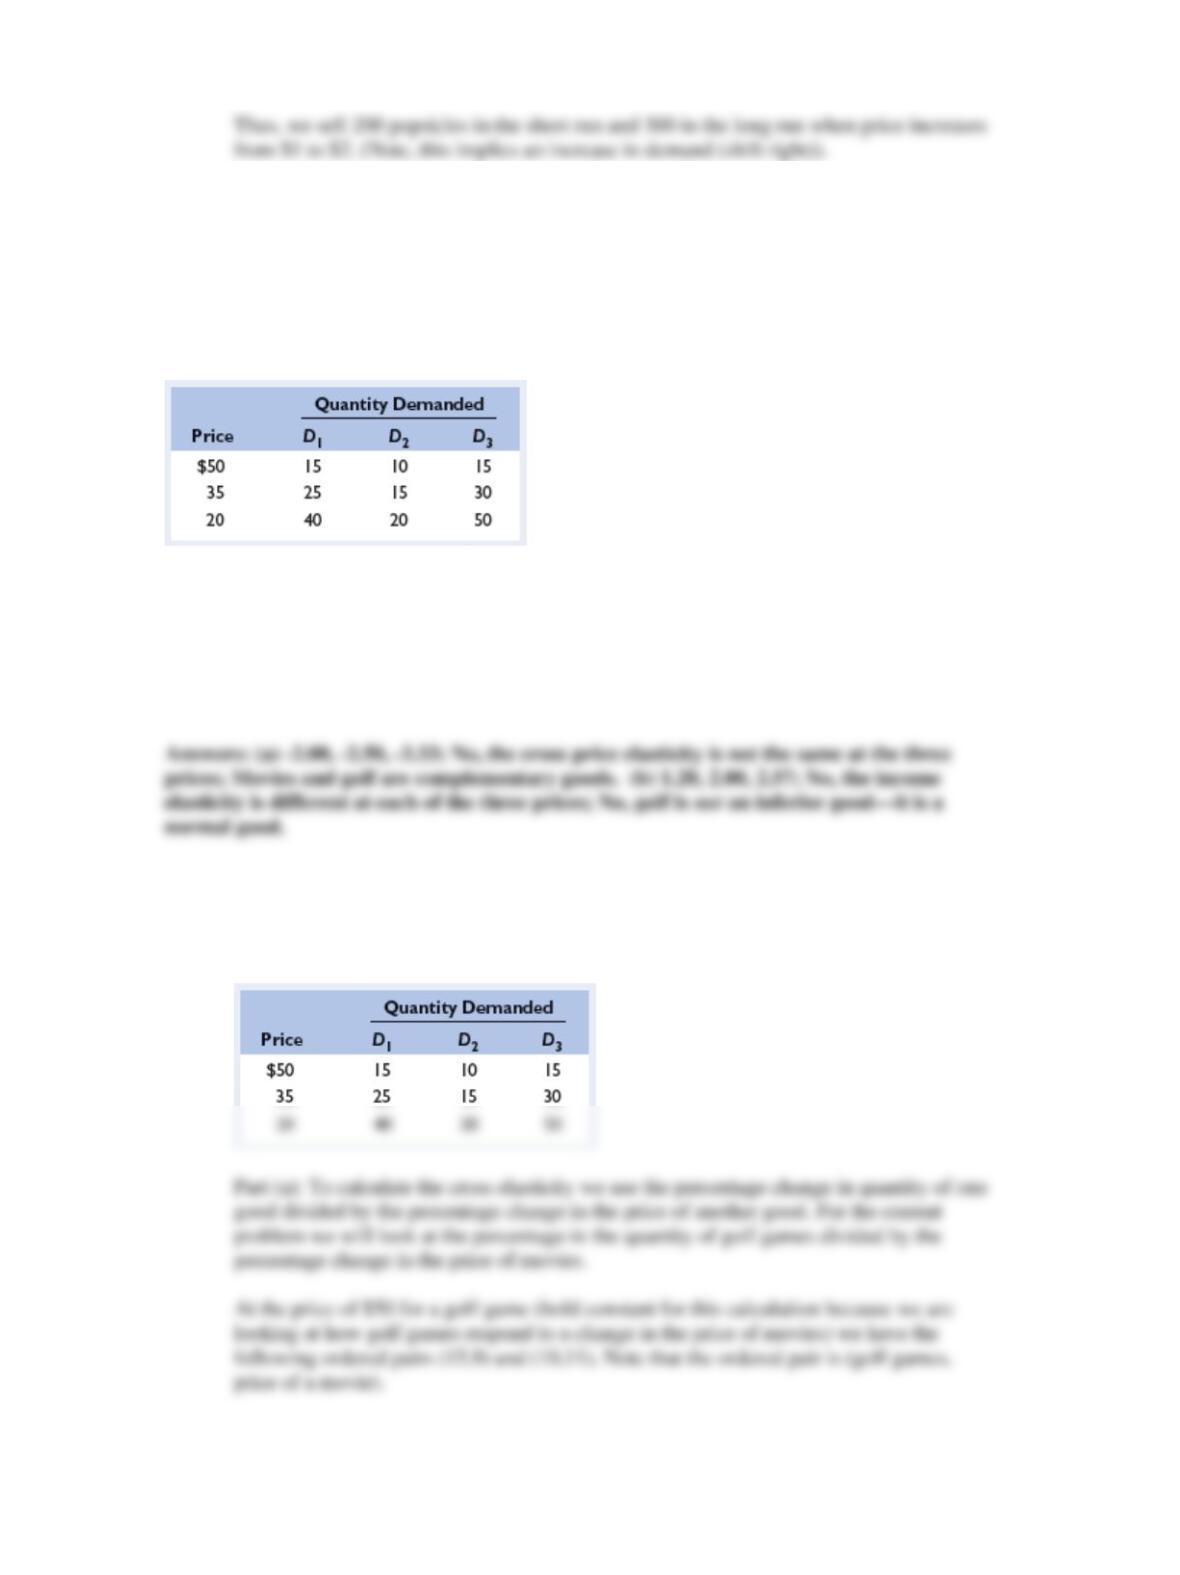
7. Lorena likes to play golf. The number of times per year that she plays depends on both the price of
playing a round of golf as well as Lorena’s income and the cost of other types of entertainment—in
particular, how much it costs to go see a movie instead of playing golf. The three demand schedules
in the table below show how many rounds of golf per year Lorena will demand at each price under
three different scenarios. In scenario D1, Lorena’s income is $50,000 per year and movies cost $9
each. In scenario D2, Lorena’s income is also $50,000 per year, but the price of seeing a movie rises
to $11. And in scenario D3, Lorena’s income goes up to $70,000 per year while movies cost $11.
LO4
a. Using the data under D1 and D2, calculate the cross elasticity of Lorena’s demand for golf at all
three prices. (To do this, apply the midpoints approach to the cross elasticity of demand.) Is the cross
elasticity the same at all three prices? Are movies and golf substitute goods, complementary goods, or
independent goods?
b. Using the data under D2 and D3, calculate the income elasticity of Lorena’s demand for golf at all
three prices. (To do this, apply the midpoints approach to the income elasticity of demand.) Is the
income elasticity the same at all three prices? Is golf an inferior good?
Feedback: Consider the following values and table: In scenario D1, Lorena’s income is
$50,000 per year and movies cost $9 each. In scenario D2, Lorena’s income is also
$50,000 per year, but the price of seeing a movie rises to $11. And in scenario D3,
Lorena’s income goes up to $70,000 per year while movies cost $11.
Chapter 04 – Elasticity
4-14
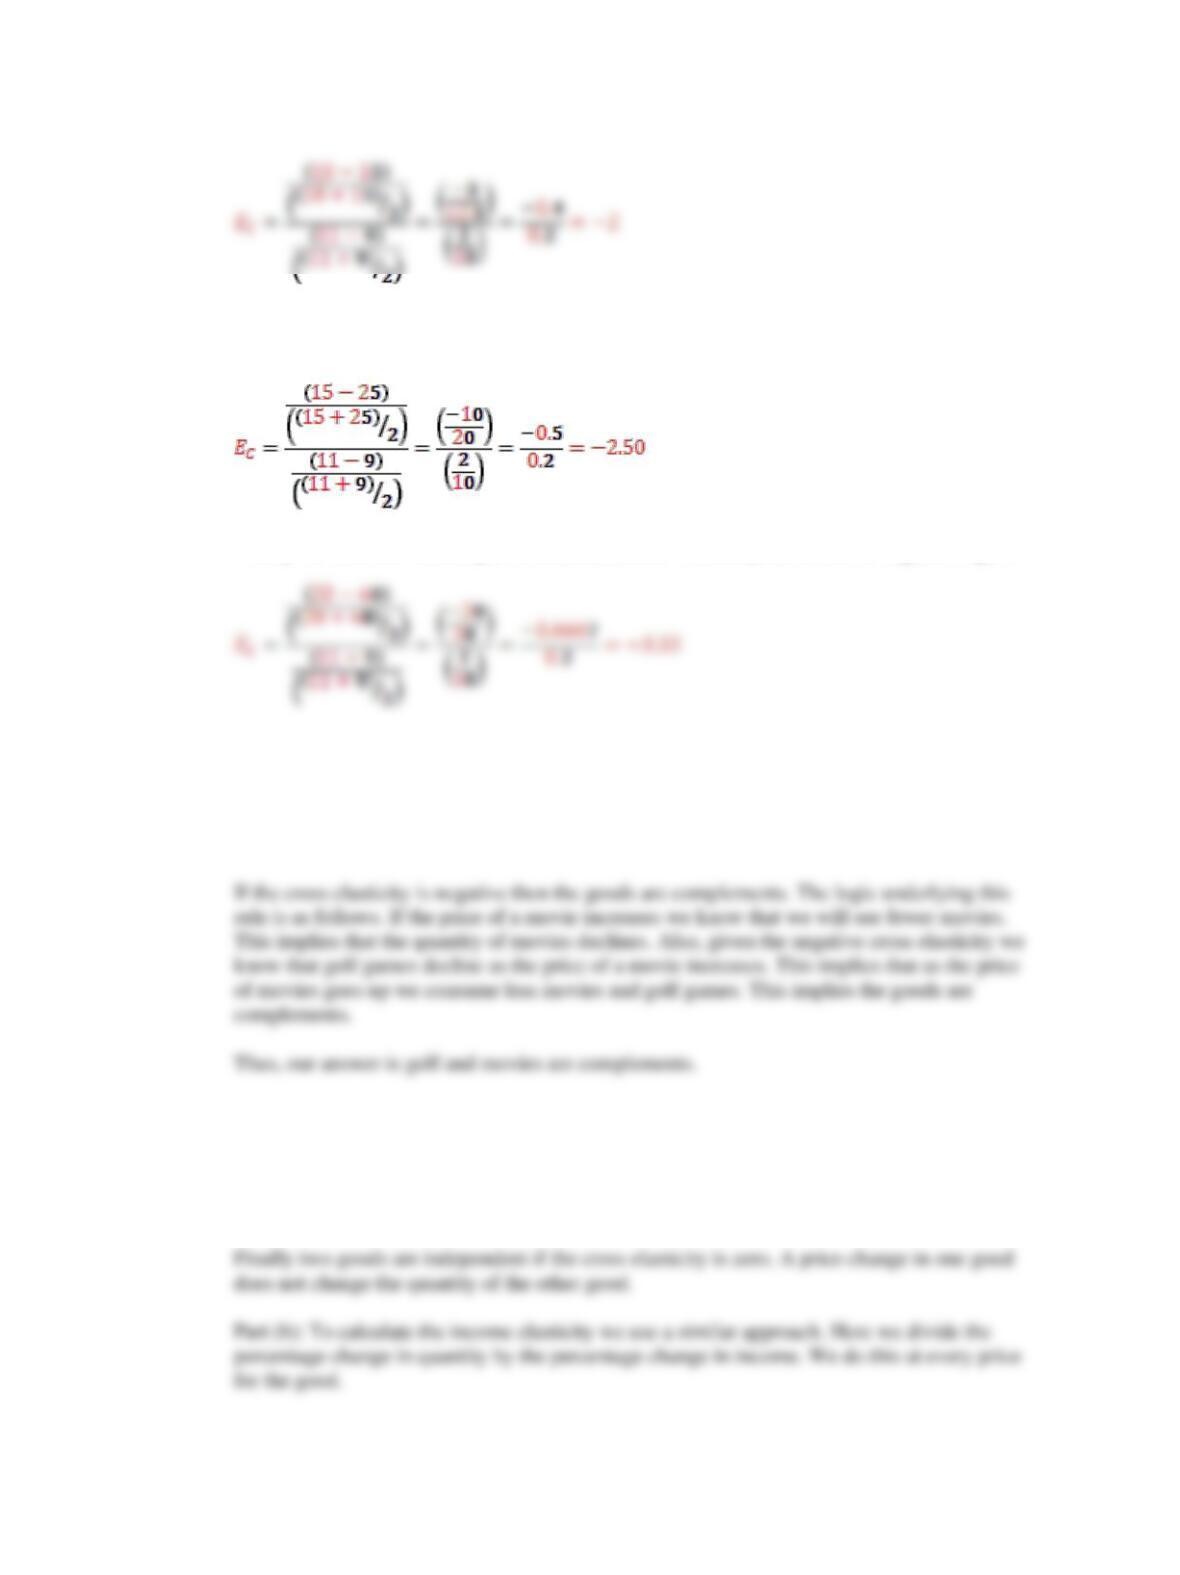
Here we use the same formula:
We do the same exercise for $35. Here we have the ordered pairs (25,9) and (15,11).
Finally we have the ordered pair of (40,9) and (20,11) at the price of $20 for a game of golf.
The cross elasticities are not the same at all three golf game prices. The percentage
change in quantity is larger the lower the price.
To determine if movies and golf are substitute goods, complementary goods, or independent
goods we have the following rule.
A similar logic applies to substitute goods. If the price of good A increases then the quantity
demanded of good A goes down. If the cross elasticity is positive then this implies the
demand for the good B increases as a result of the price increase for good A. Thus, the
quantity of good A decreases and the quantity of good B increases. This implies good A and
good B are substitutes.
Chapter 04 – Elasticity
4-15
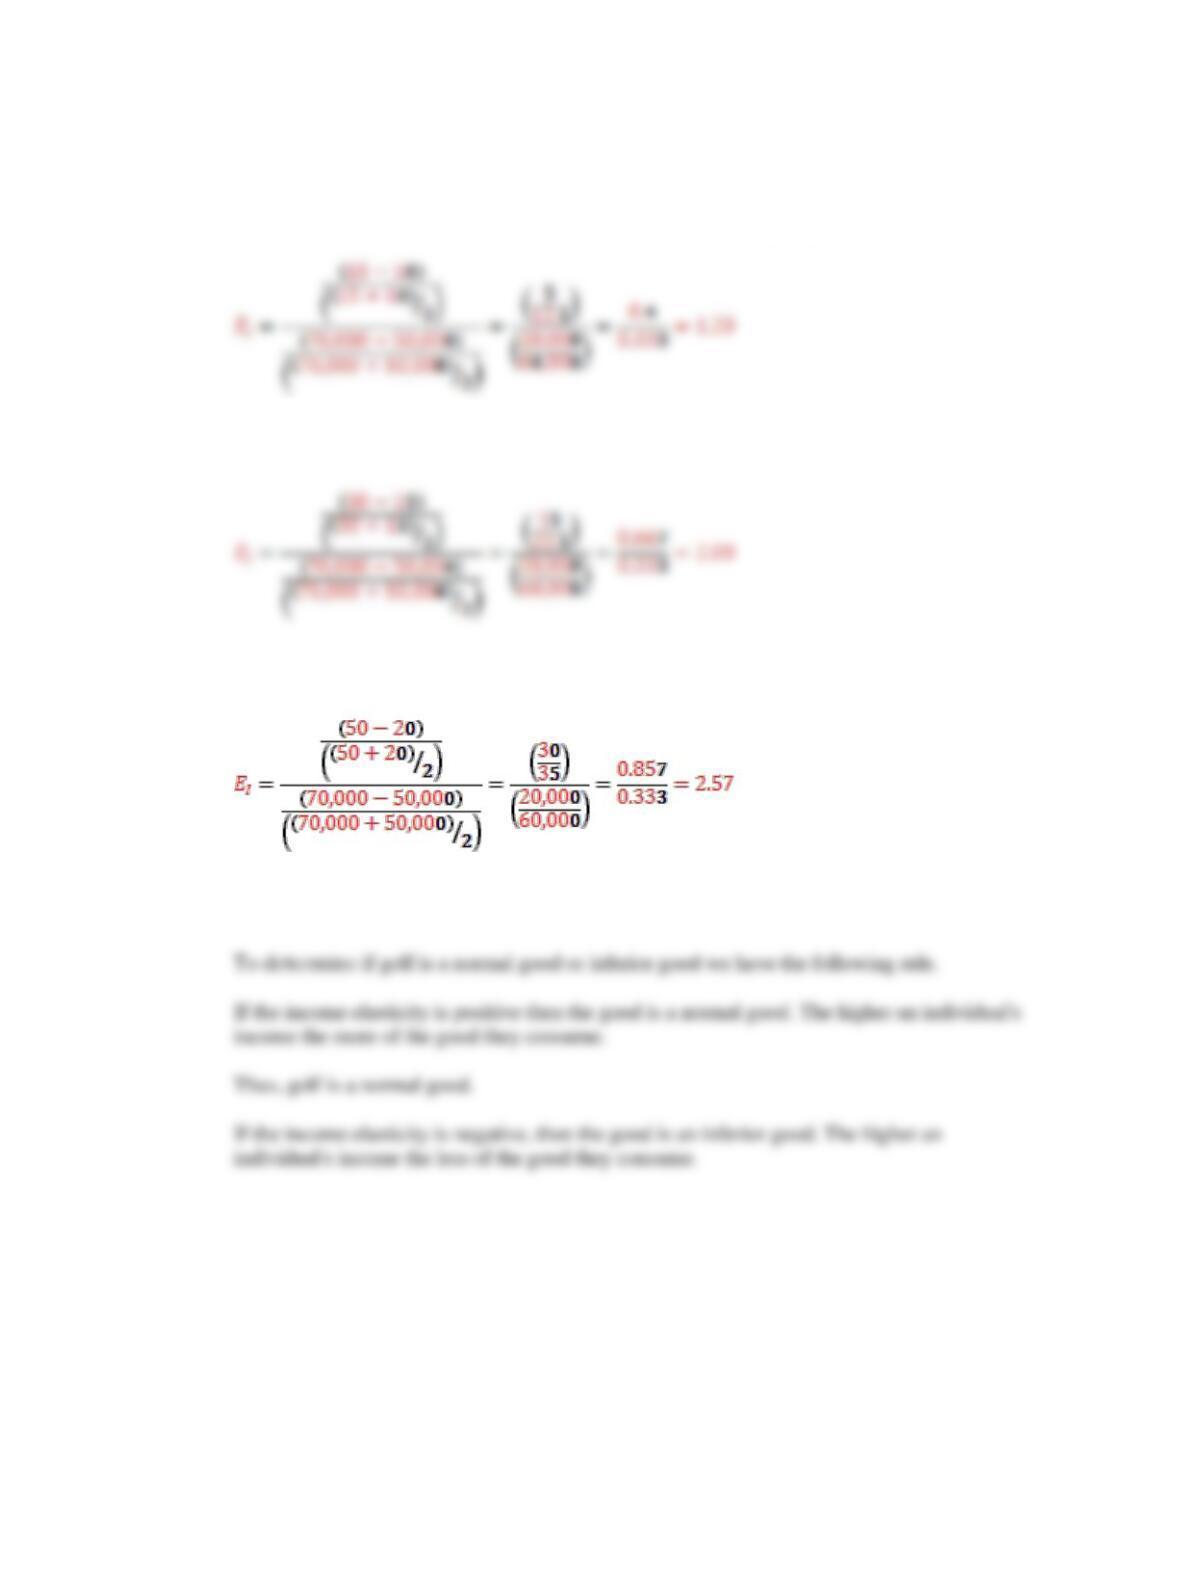
For our golf example we have the following income elasticities.
At the price of $50 for a golf game (hold constant for this calculation because we are
looking at how golf games respond to a change in income) we have the following ordered
pairs (10,50000) and (15,70000). Note that the ordered pair is (golf games, income).
We do the same exercise for $35. Here we have the ordered pairs (15,50000) and
(30,70000).
Finally we have the ordered pair of (20,50000) and (50,70000) at the price of $20 for a game
of golf.
The income elasticity is not the same at each price of a game of golf. Golf games are
more responsive to changes in income the lower the price of golf.