1
2
3
4
5
6
7
8
9
10
11
12
13
16
17
18
19
20
28
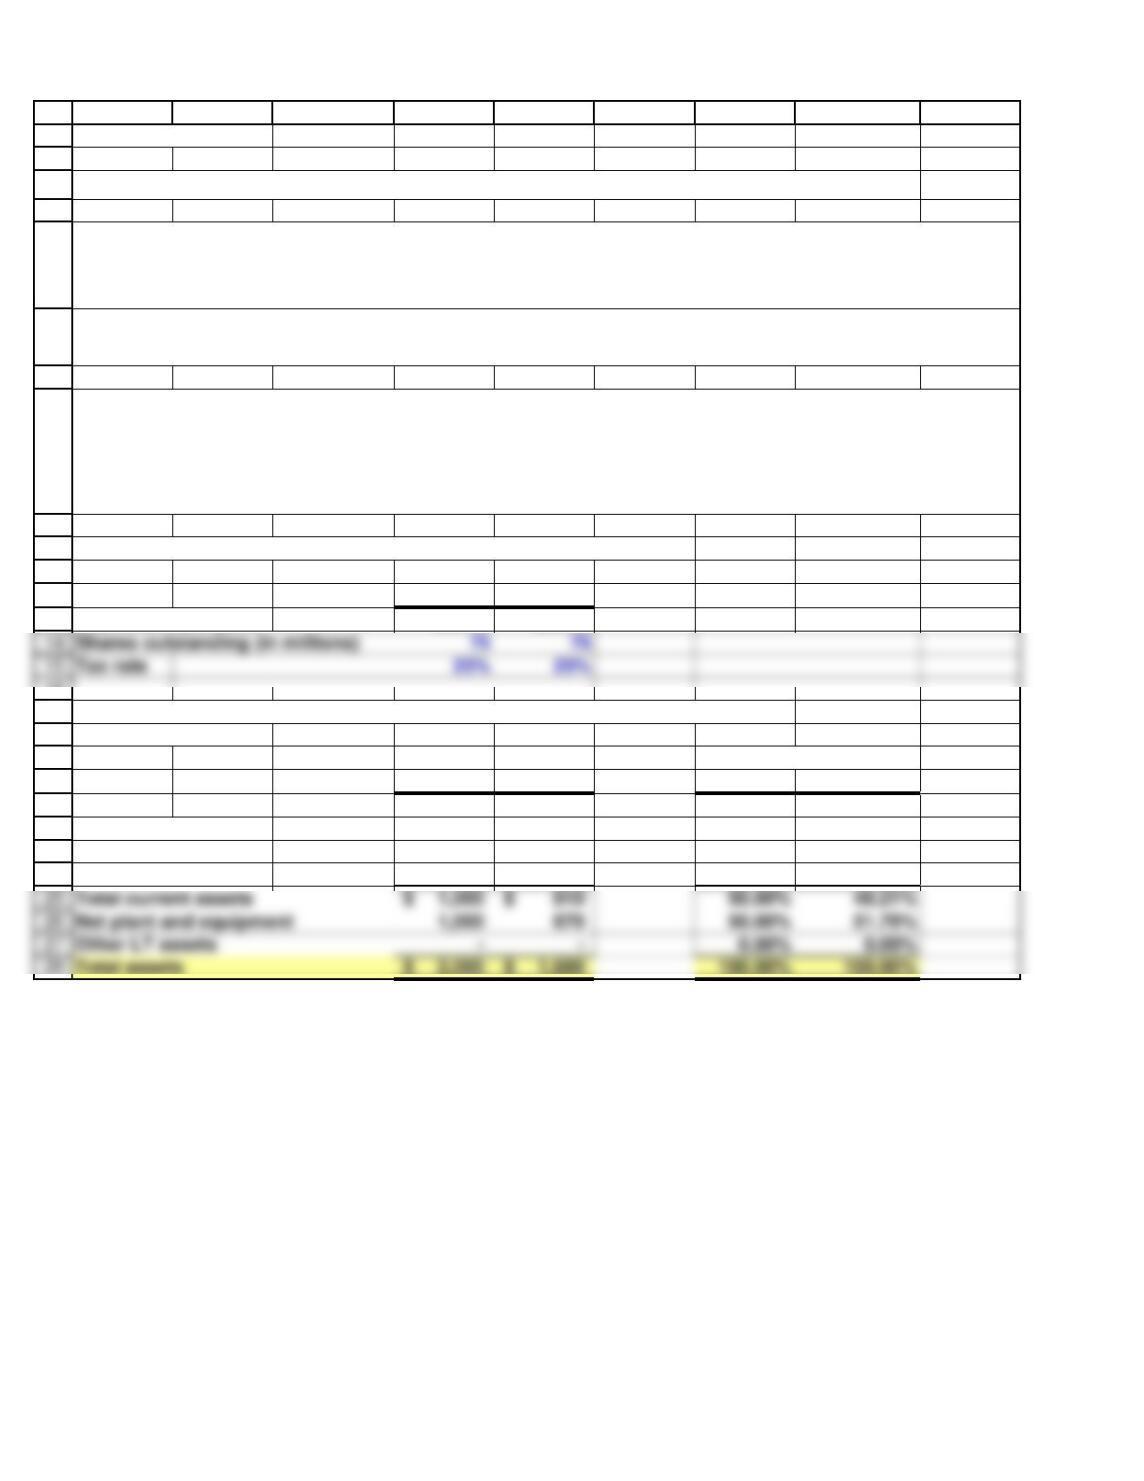
Total current assets 1,000$ 810$ 50.00% 48.21%
Net plant and equipment 1,000 870 50.00% 51.79%
Other LT assets – – 0.00% 0.00%
21
22
23
24
A B C D E F G H I
04 Chapter model 12/12/2018
INPUT DATA SECTION: Historical Data Used in the Analysis
2019 2018
Year-end stock price $23.06 $26.00
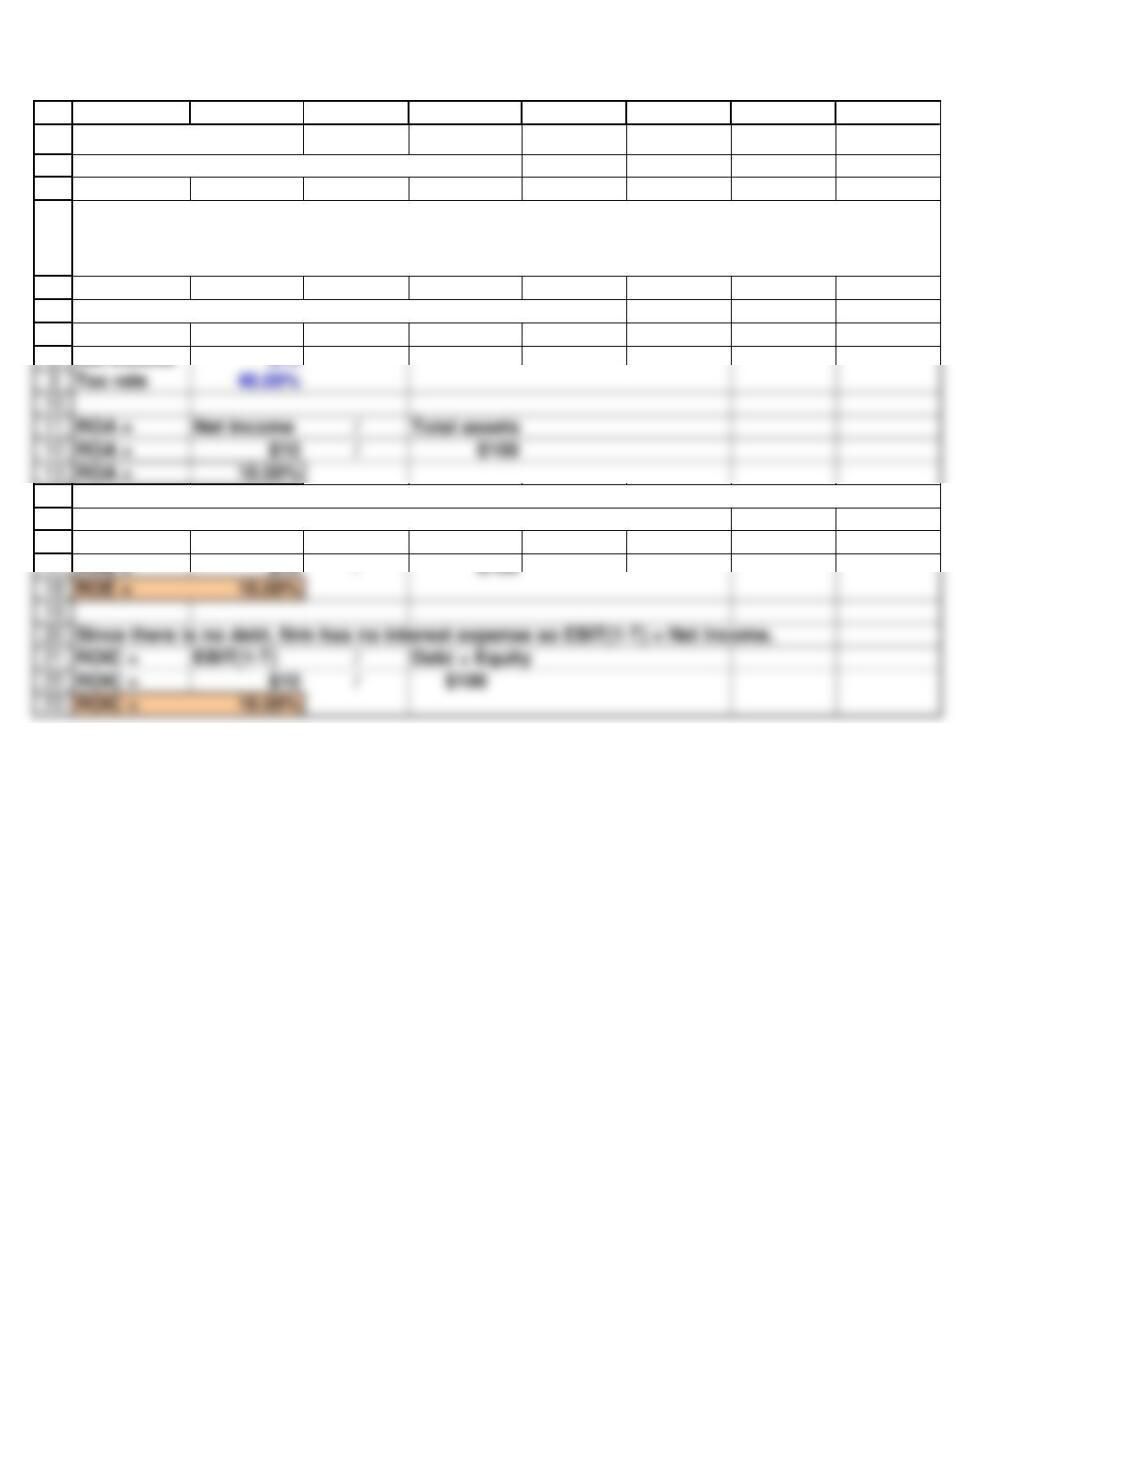
COMMON SIZE BALANCE SHEETS – Allied Food Products – December 31
(in millions of dollars)
2019 2018 2019 2018
Assets
Cash and equivalents 10$ 80$ 0.50% 4.76%
Accounts receivable 375 315 18.75% 18.75%
Inventories 615 415 30.75% 24.70%
Chapter 4. Analysis of Financial Statements
This spreadsheet model sets up common size balance sheets and income statements for Allied (2018 and
2019 statements) and conducts a full ratio analysis of Allied’s financial statements.
Common Size Analysis is not illustrated in the text, but we show it because it is so easy to do with Excel.
The common size balance sheet shows each asset and liability item as a percentage of total assets, and
the common size income statement shows the other items as a percentage of sales. Common size
statements are useful for getting an idea of how the various statement items match up, and they are
especially good for comparing companies that differ in size.
This model is STRICTLY OPTIONAL. Neither students nor instructors need to go through it. However, if
someone wants to practice with Excel, then the model can be useful. Also, on the tabs we show solutions
for the within-chapter self-test questions, if applicable.
COMMON SIZE
Shares outstanding (in millions) 75 75
Tax rate 25% 25%
Accounts payable 60$ 30$ 3.00% 1.79%
Notes payable 110 60 5.50% 3.57%
34
35
36
37
38
53
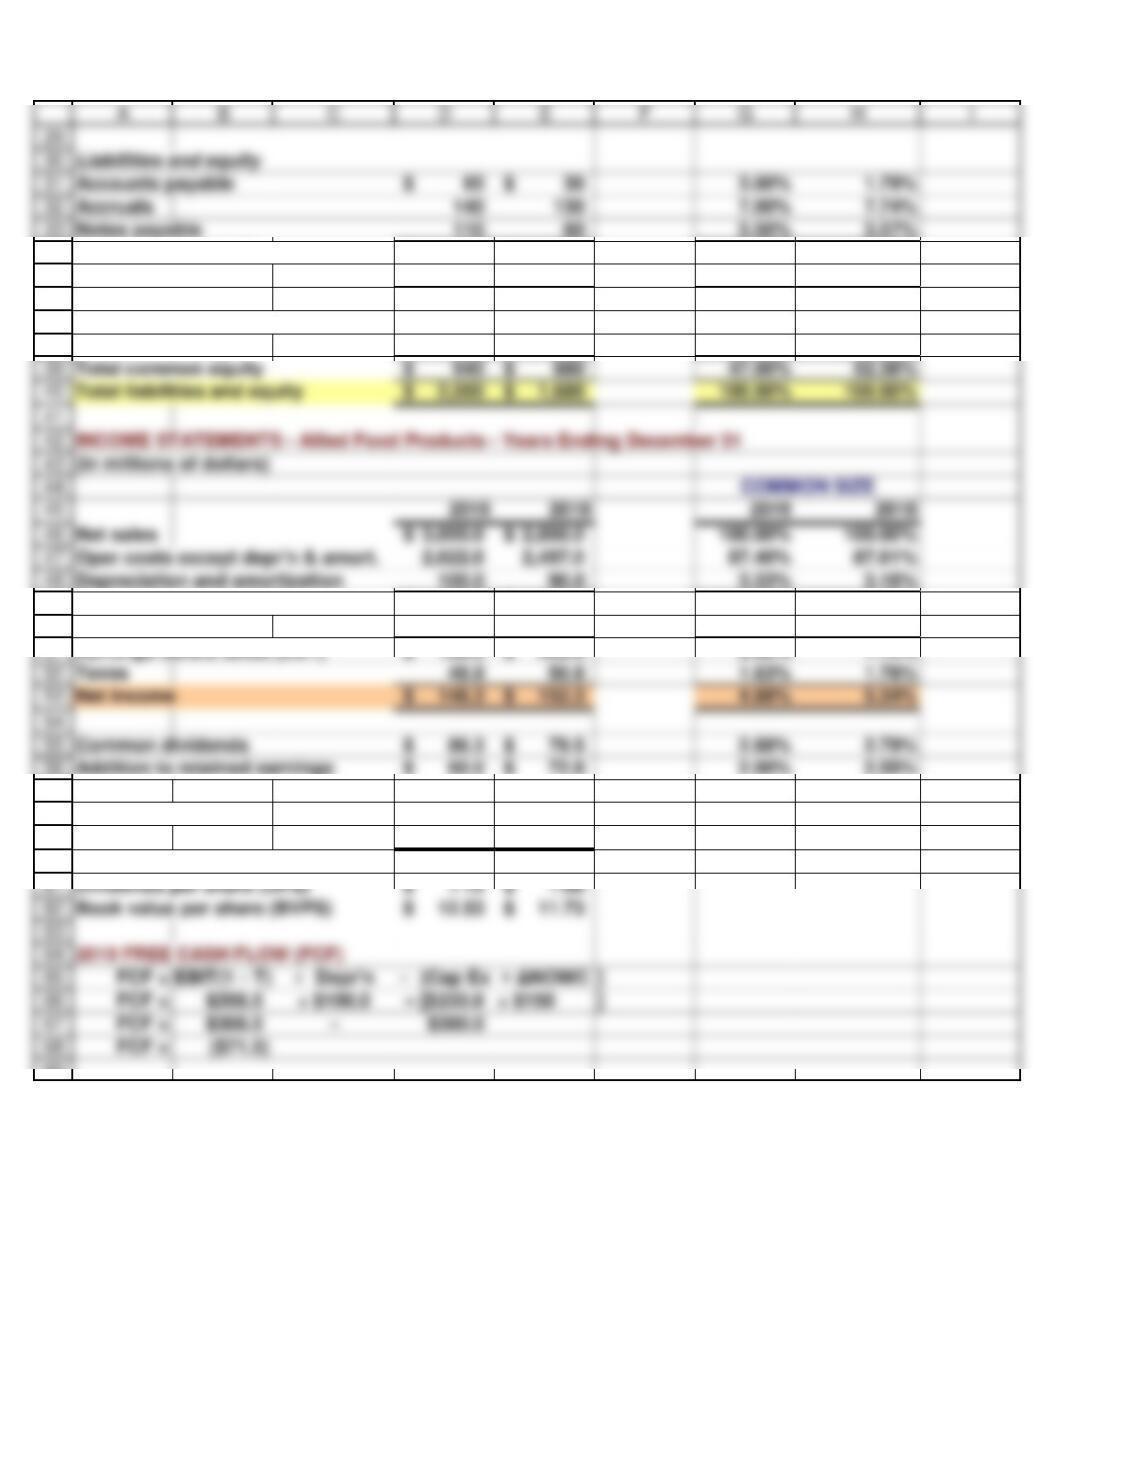
Common dividends 86.3$ 79.5$ 2.88% 2.79%
49
50
51
56
57
58
59
Dividends per share (DPS) 1.15$ 1.06$
Book value per share (BVPS) 12.53$ 11.73$
2019 FREE CASH FLOW (FCF)
EBIT(1 – T)
60
69
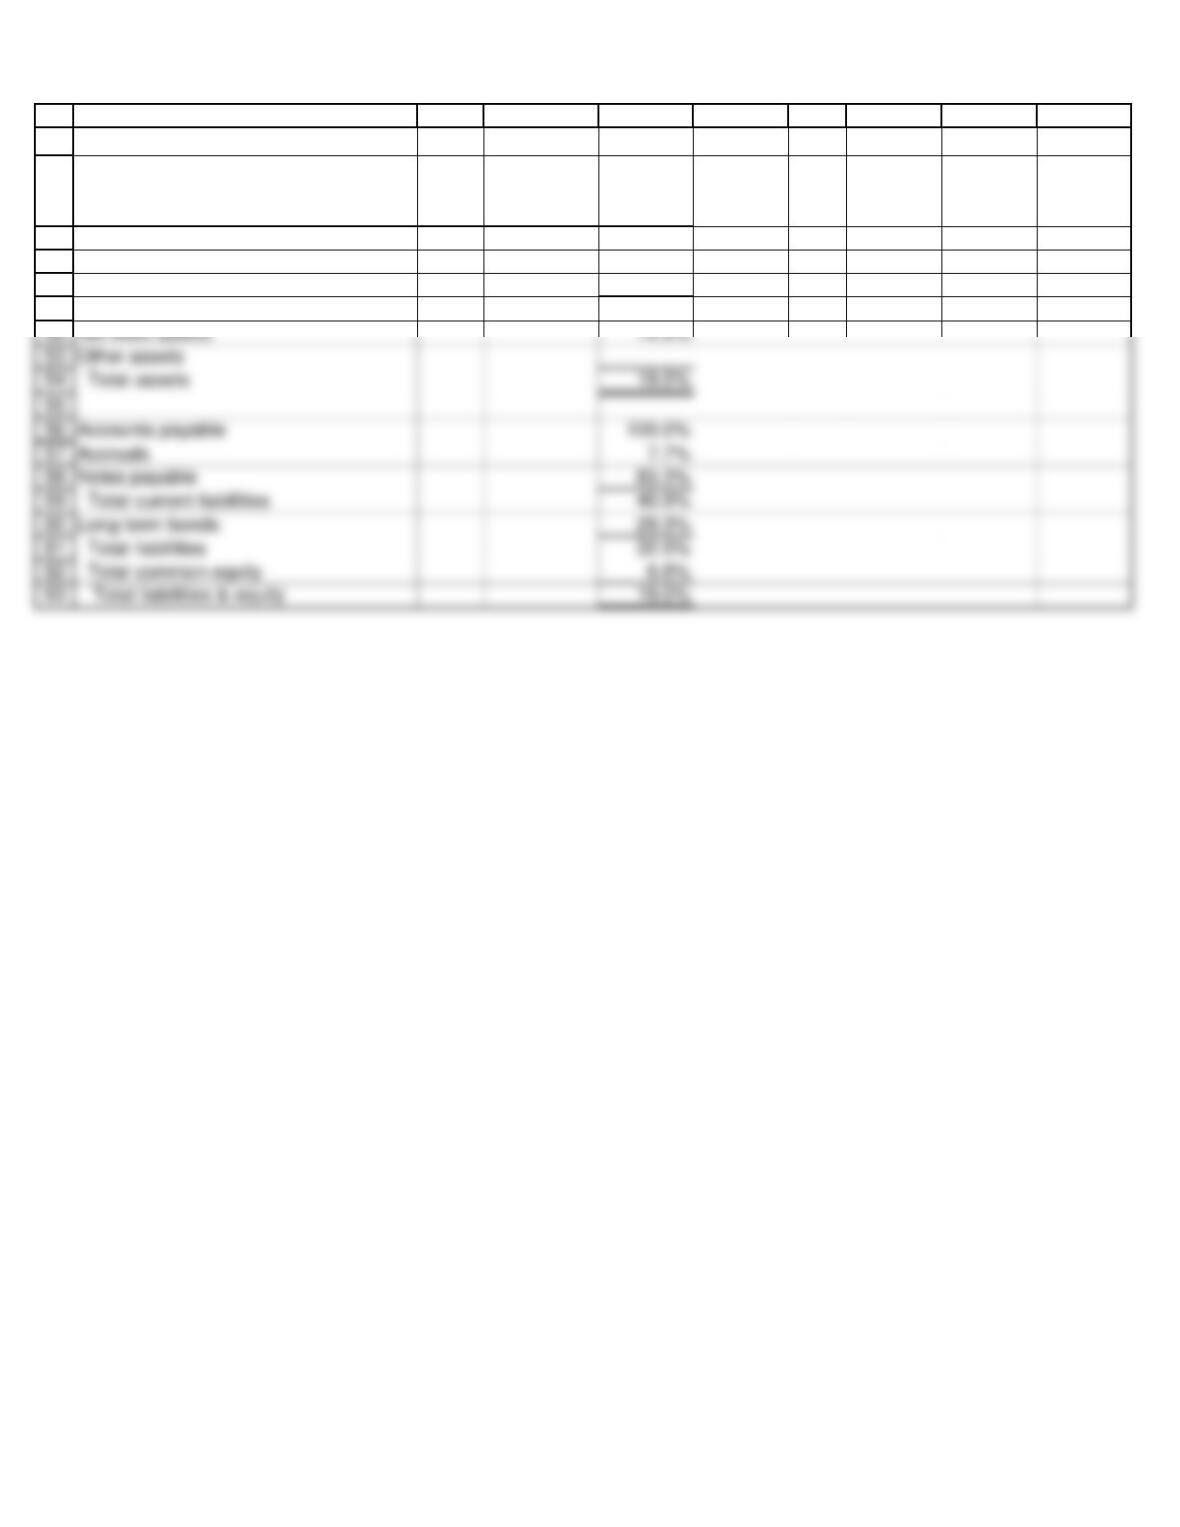
Total current liabilities 310$ 220$ 15.50% 13.10%
Long-term bonds 750 580 37.50% 34.52%
Total liabilities 1,060$ 800$ 53.00% 47.62%
Common stock (75M shares) 130 130 6.50% 7.74%
Retained earnings 810 750 40.50% 44.64%
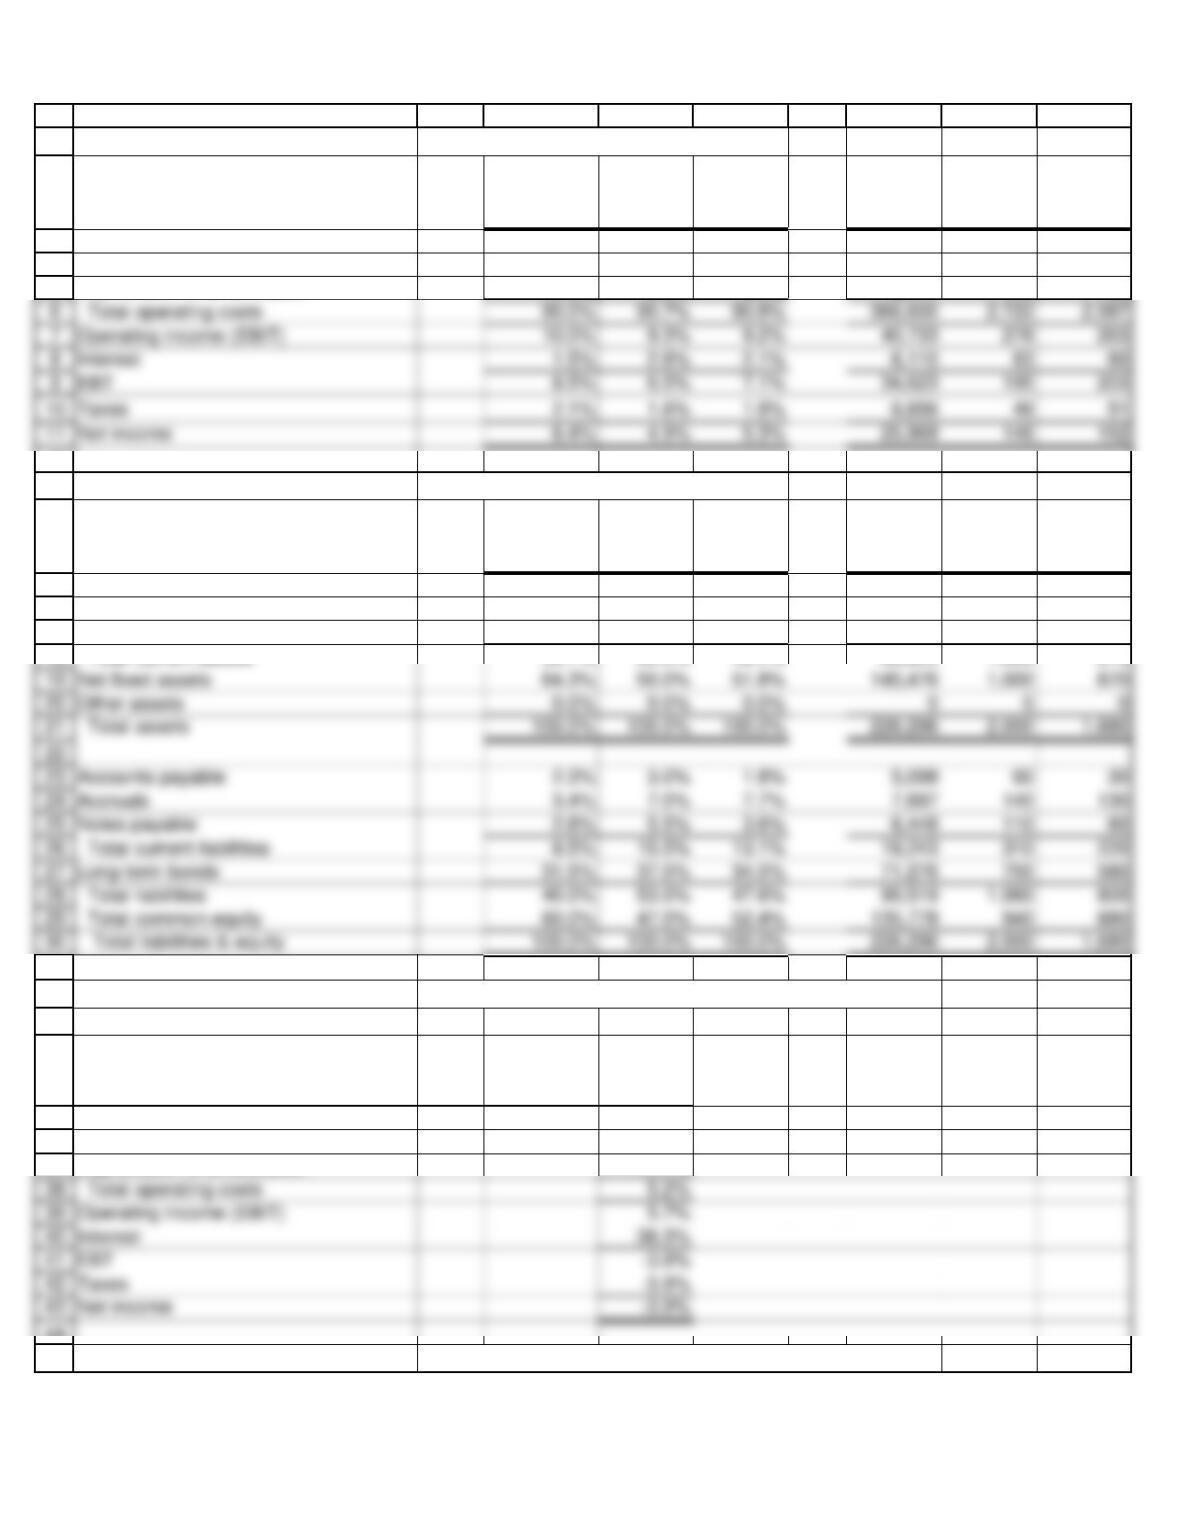
Operating income (EBIT) 278.0$ 263.0$ 9.27% 9.23%
Less interest 83.0 60.0 2.77% 2.11%
Earnings before taxes (EBT) 195.0$ 203.0$ 6.50% 7.12%
Addition to retained earnings 60.0$ 72.8$ 2.00% 2.55%
PER-SHARE DATA
2019 2018
Earnings per share (EPS) 1.95$ 2.03$
40
45
Total common equity 940$ 880$ 47.00% 52.38%
INCOME STATEMENTS – Allied Food Products – Years Ending December 31
(in millions of dollars)
2019 2018 2019 2018
Net sales 3,000.0$ 2,850.0$ 100.00% 100.00%
Oper costs except depr’n & amort. 2,622.0 2,497.0 87.40% 87.61%
Depreciation and amortization 100.0 90.0 3.33% 3.16%
70
71
72
73
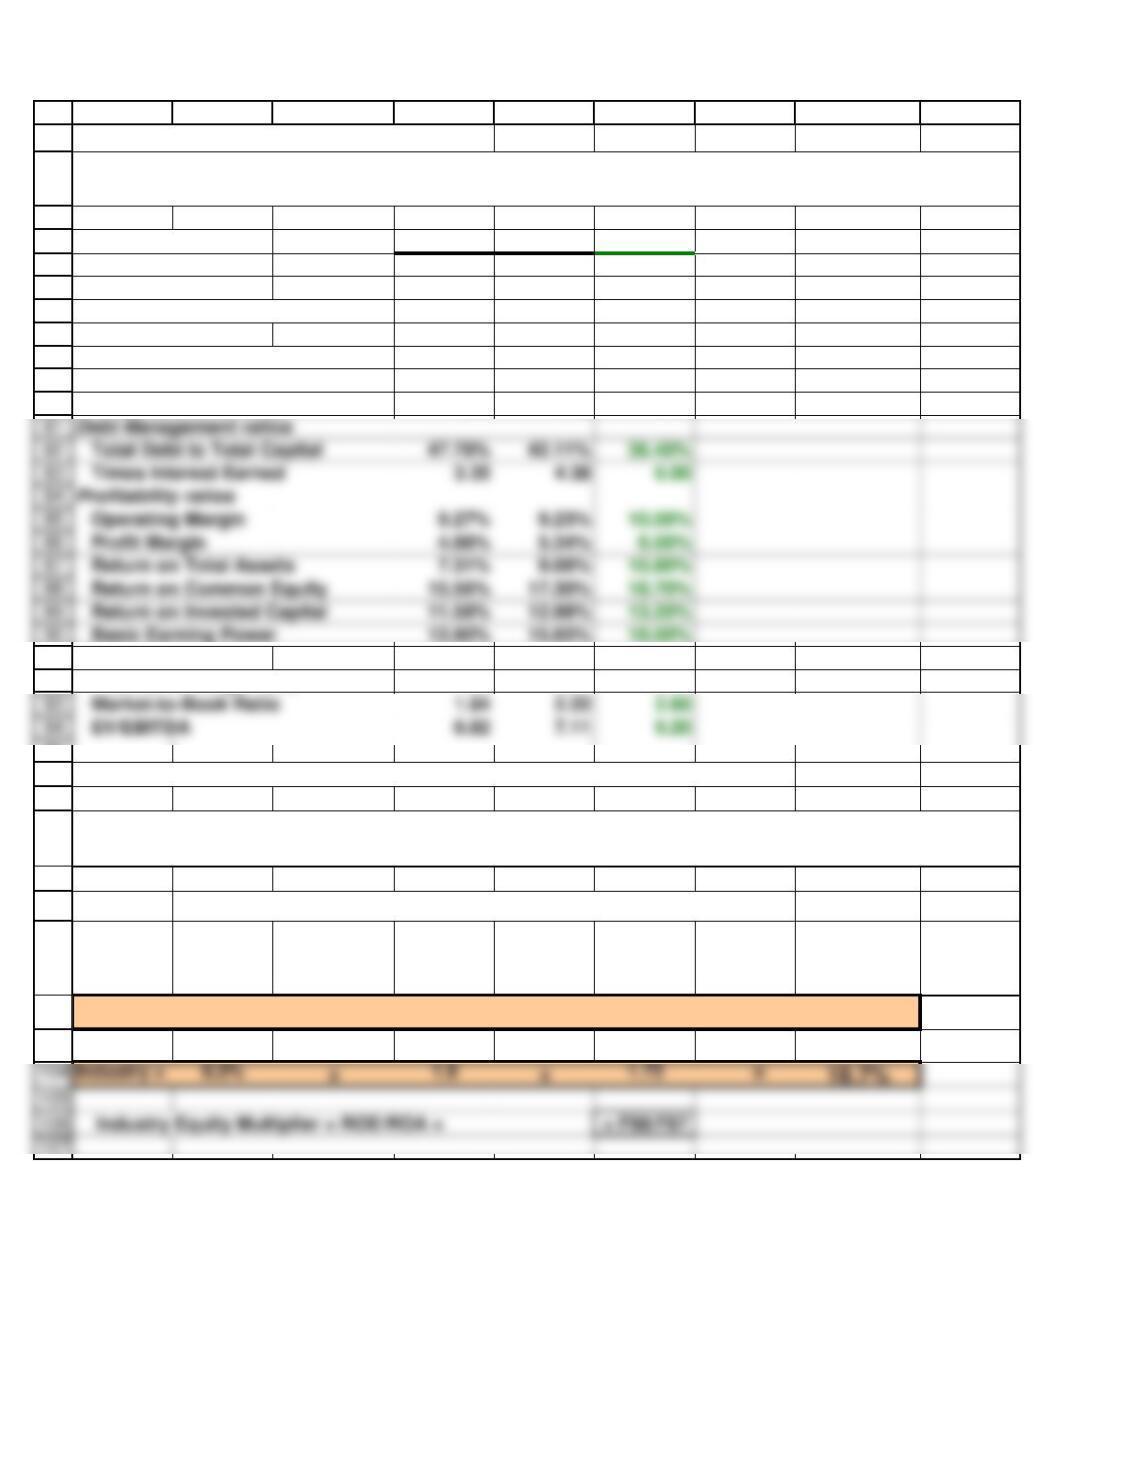
Market-to-Book Ratio 1.84 2.22 2.60
74
75
76
77
78
79
80
91
92
95
96
97
98
99
100
101
102
103
A B C D E F G H I
SECTIONS 4-1 TO 4-6, RATIO ANALYSIS
Liquidity ratios 2019 2018 Ind Avg
Current Ratio 3.23 3.68 4.20
Quick Ratio 1.24 1.80 2.20
Asset Management ratios
Inventory Turnover
4.88 6.87 10.90
Days Sales Outstanding 45.63 40.34 36.00
Fixed Assets Turnover 3.00 3.28 2.80
Total Assets Turnover 1.50 1.70 1.80
Market Value ratios
Price-to-Earnings Ratio 11.83 12.81 13.60
SECTION 4-7. TYING THE RATIOS TOGETHER: THE DuPONT EQUATION
ROE = Profit Margin x TA Turnover x Equity Multiplier
ROE =
Net
income /
Sales
x
Sales /
Total
assets
x
Total
assets /
Equity
ROE =
4.9% x1.5 x2.13 = 15.6%
Here we calculate Allied’s ratios for 2018 and 2019. These results are compared across time and to the
industry averages.
The DuPont equation shows that a firm’s ROE depends on three essential components: (1) the profit
margin, (2) the total assets turnover, and (3) the equity multiplier.
Debt Management ratios
Total Debt to Total Capital 47.78% 42.11% 36.40%
Times Interest Earned 3.35 4.38 6.00
Profitability ratios
Profit Margin 4.88% 5.34% 6.00%
Return on Total Assets 7.31% 9.06% 10.80%
Return on Common Equity 15.56% 17.30% 18.70%
Basic Earning Power 13.90% 15.65% 18.00%
108
109
110
111
112
113
114
118
119
120
121
122
124
127
128
131
132
133
A B C D E F G H I
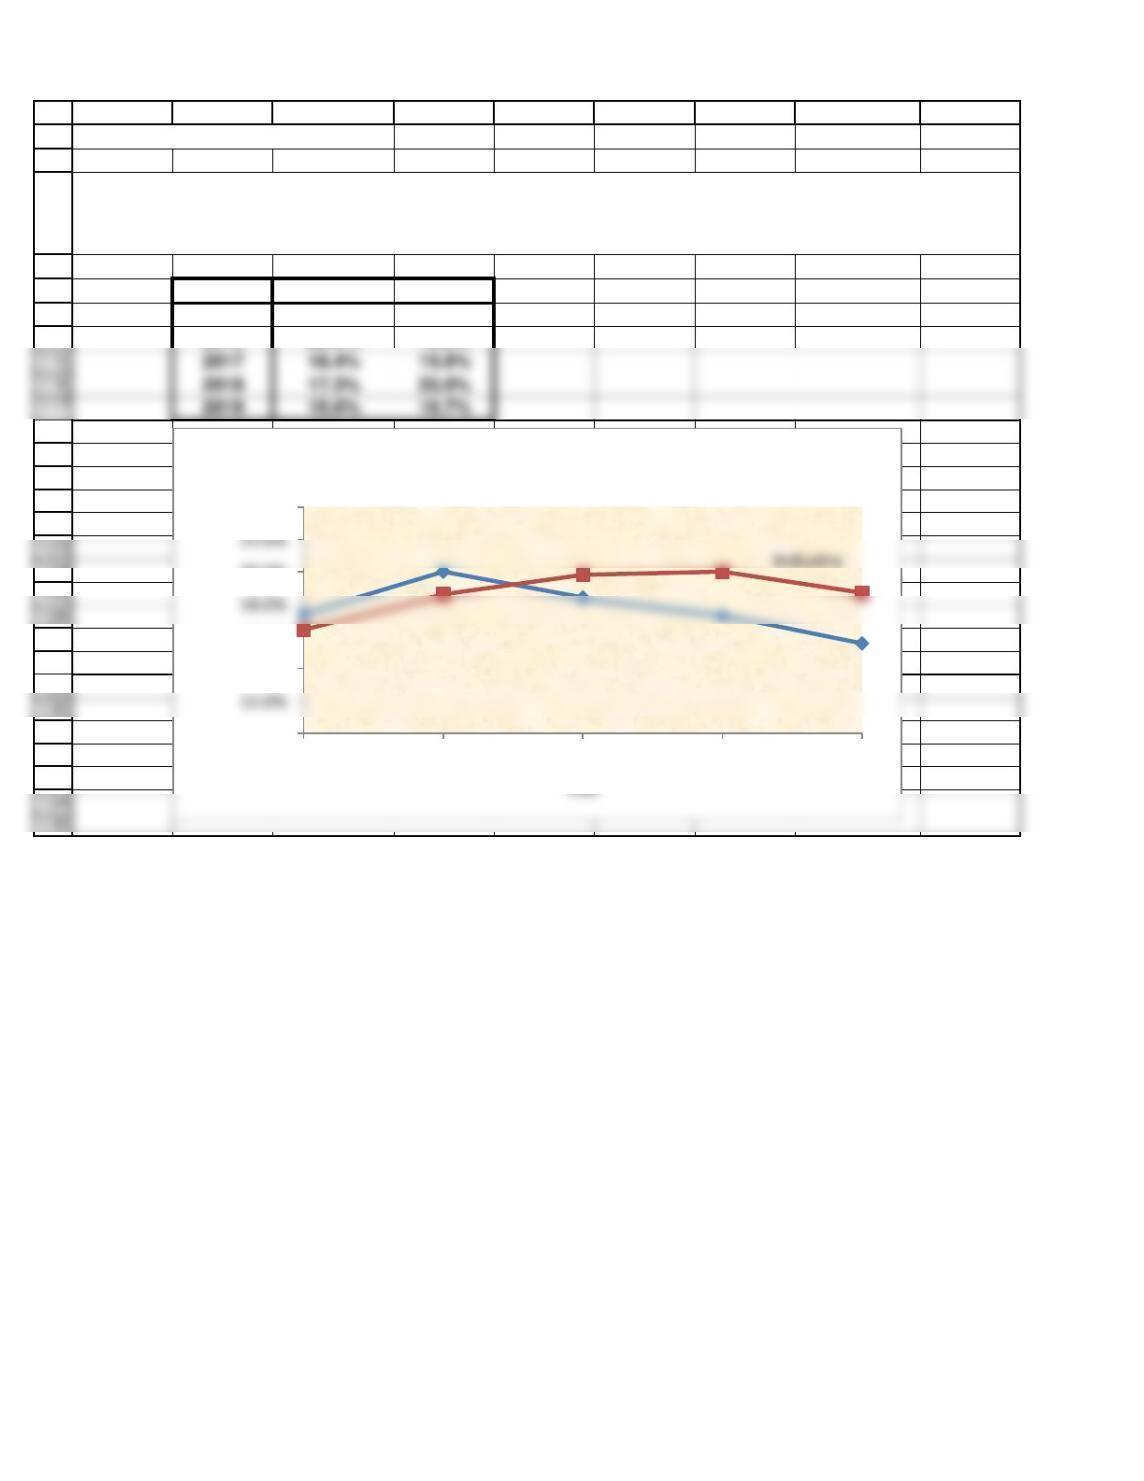
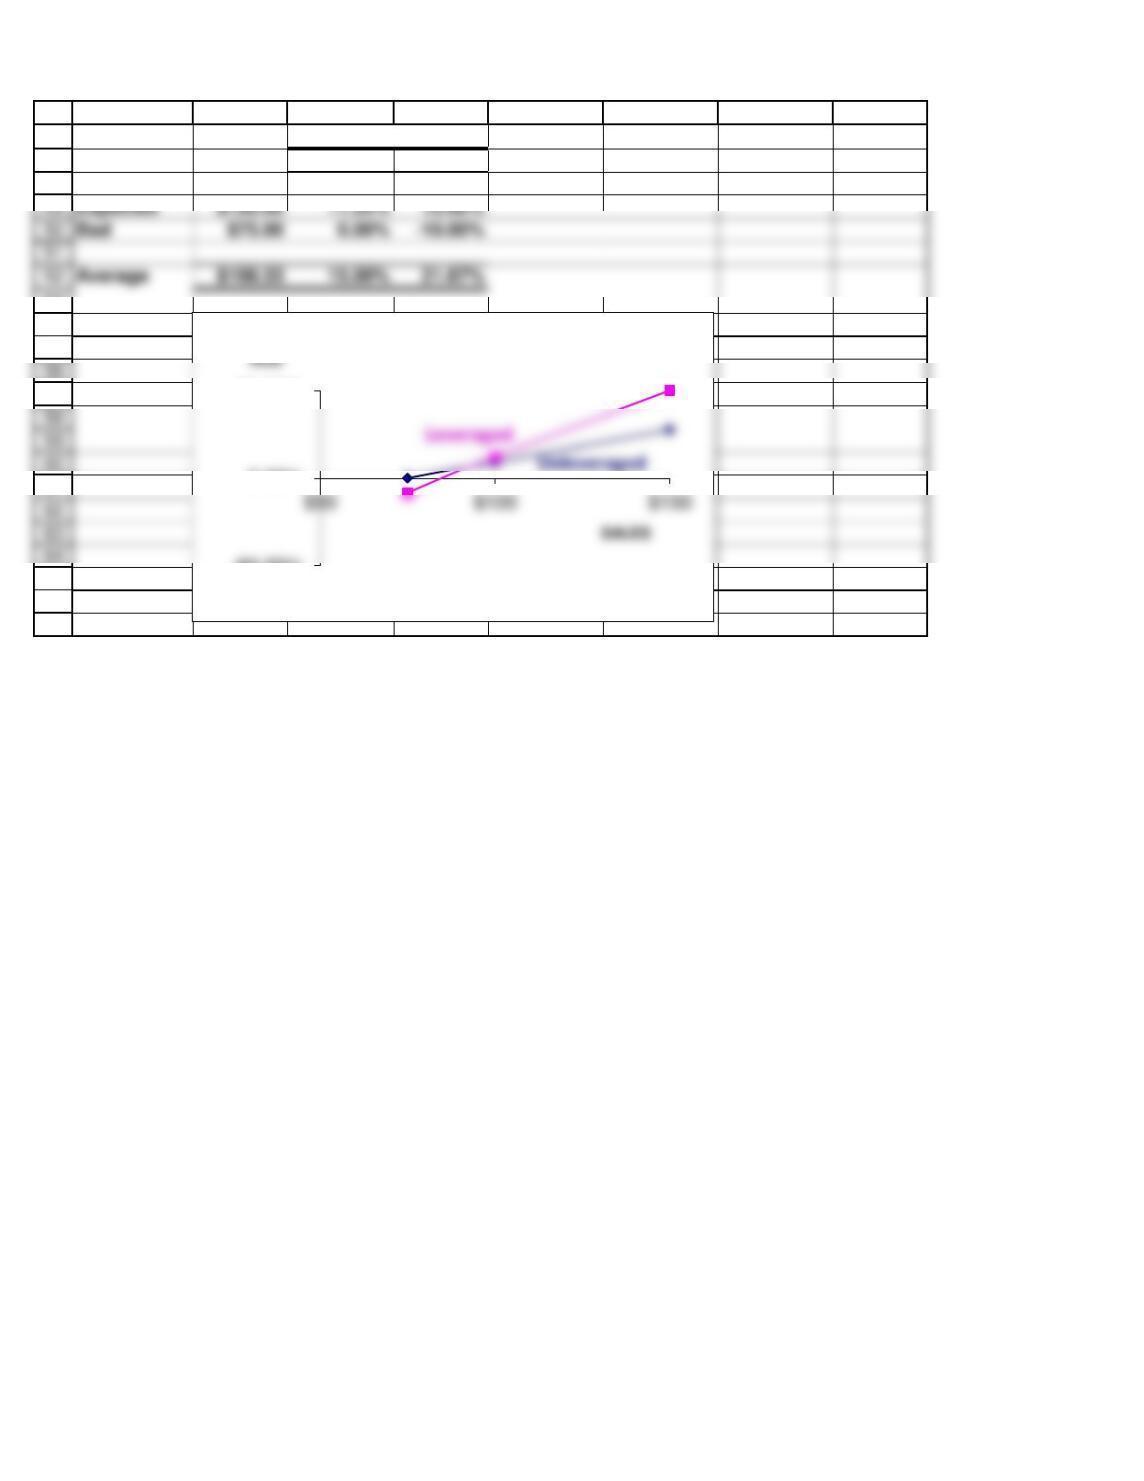
SECTION 4-9c, TREND ANALYSIS
Allied Ind Avg
2015 17.4% 16.4%
2016 20.0% 18.6%
Trend analysis allows you to see how a firm’s results are changing over time. For example, Allied’s ROE
has been declining for the past 3 years, and it is now below the industry average. Not a good sign.
10.0%
14.0%
16.0%
20.0%
24.0%
2015 2016 2017 2018 2019
ROE
Year
Trend Analysis: Allied’s ROE
Allied
117
2017 18.4% 19.8%
2018 17.3% 20.0%
1
2
3
4
5
8
9
10
11
12
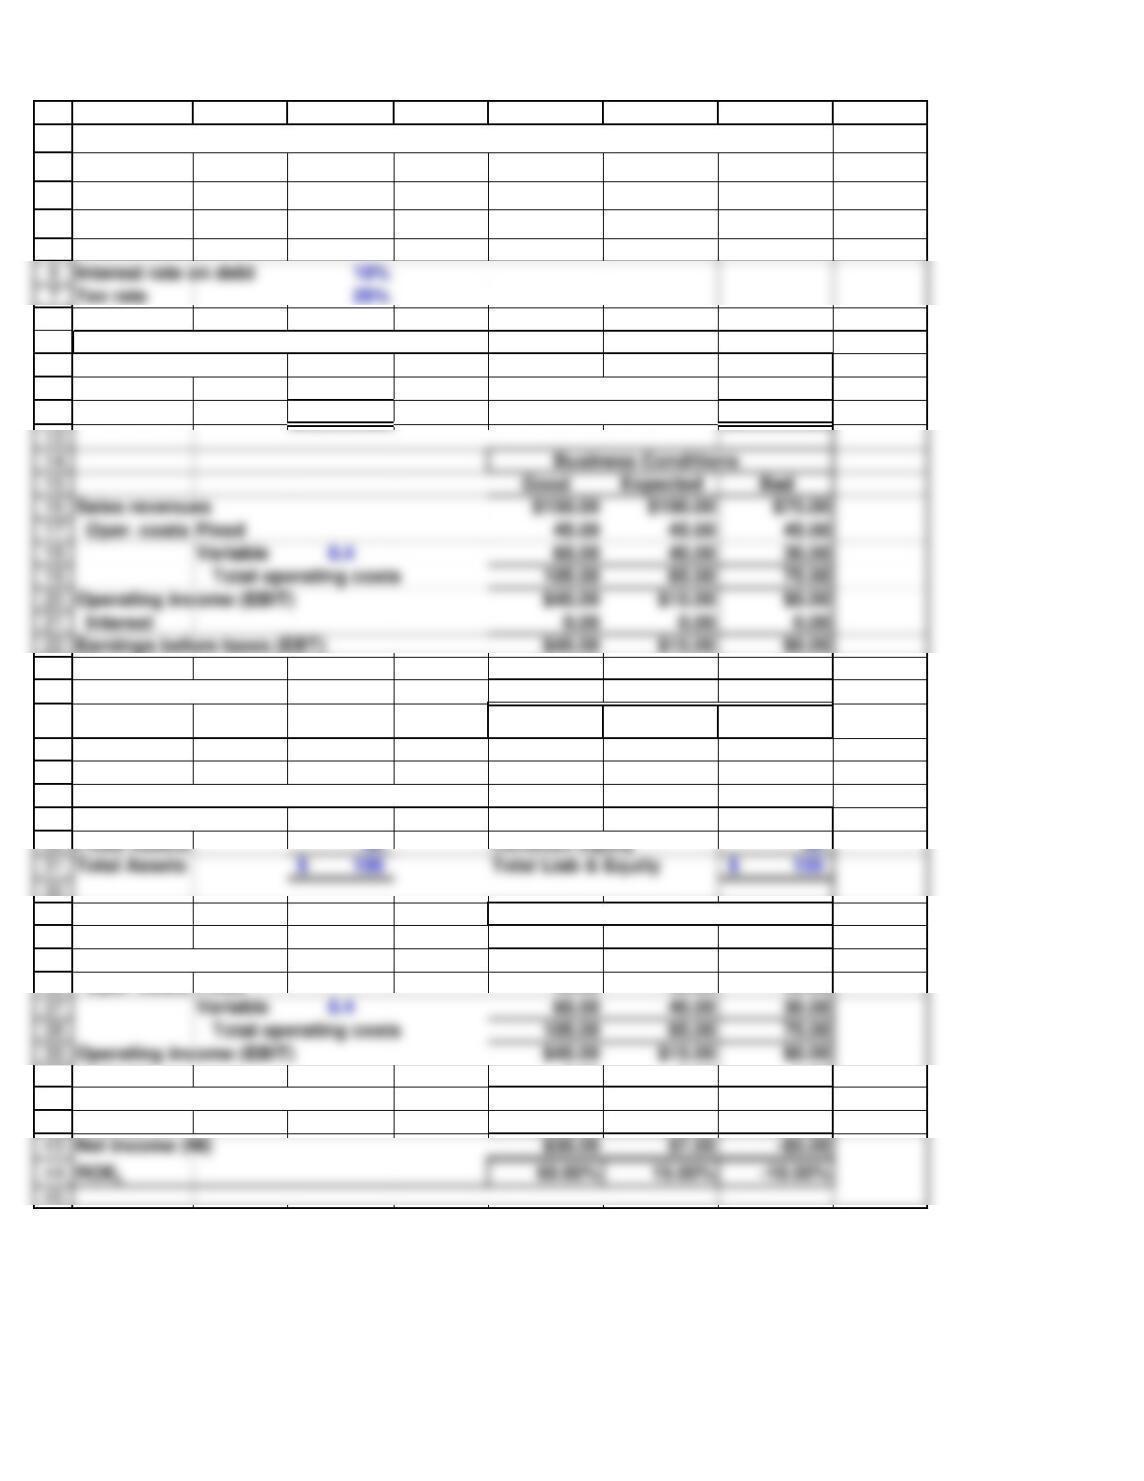
Good Expected Bad
Sales revenues $150.00 $100.00 $75.00
Oper. costs Fixed 45.00 45.00 45.00
Operating income (EBIT) $45.00 $15.00 $0.00
Interest 0.00 0.00 0.00
Earnings before taxes (EBT) $45.00 $15.00 $0.00
23
24
31
Fixed Assets 50 Common Equity 50
Total Assets 100$ Total Liab & Equity 100$
25
26
27
28
29
Operating income (EBIT) $45.00 $15.00 $0.00
32
33
34
35
36
40
41
42
43
Net income (NI) $30.00 $7.50 -$5.00
ROEL 60.00% 15.00% -10.00%
A B C D E F G H
Table 4.1. Effects of Financial Leverage on Stockholder Returns 12/12/2018
FIRM U (UNLEVERAGED, i.e., NO DEBT)
Current Assets 50$ Debt –$
Fixed Assets 50 Common Equity 100
Total Assets 100$ Total Liab & Equity 100$
Taxes 11.25 3.75 0.00
Net income (NI) $33.75 $11.25 $0.00
ROEU 33.75% 11.25% 0.00%
FIRM L (LEVERAGED, i.e., SOME DEBT)
Current Assets 50$ Debt 50$
Business Conditions
Good Expected Bad
Sales revenues $150.00 $100.00 $75.00
Oper. costs Fixed 45.00 45.00 45.00
Interest 5.00 5.00 5.00
Earnings before taxes (EBT) $40.00 $10.00 -$5.00
Taxes 10.00 2.50 0.00
Interest rate on debt 10%
Tax rate 25%
46
47
48
53
54
55
57
61
65
66
67
A B C D E F G H
Firm U Firm L
Good $150.00 33.75% 60.00%
ROE
-60.00%
0.00%
60.00%
Effect of Leverage
52
1
2
3
4
5
6
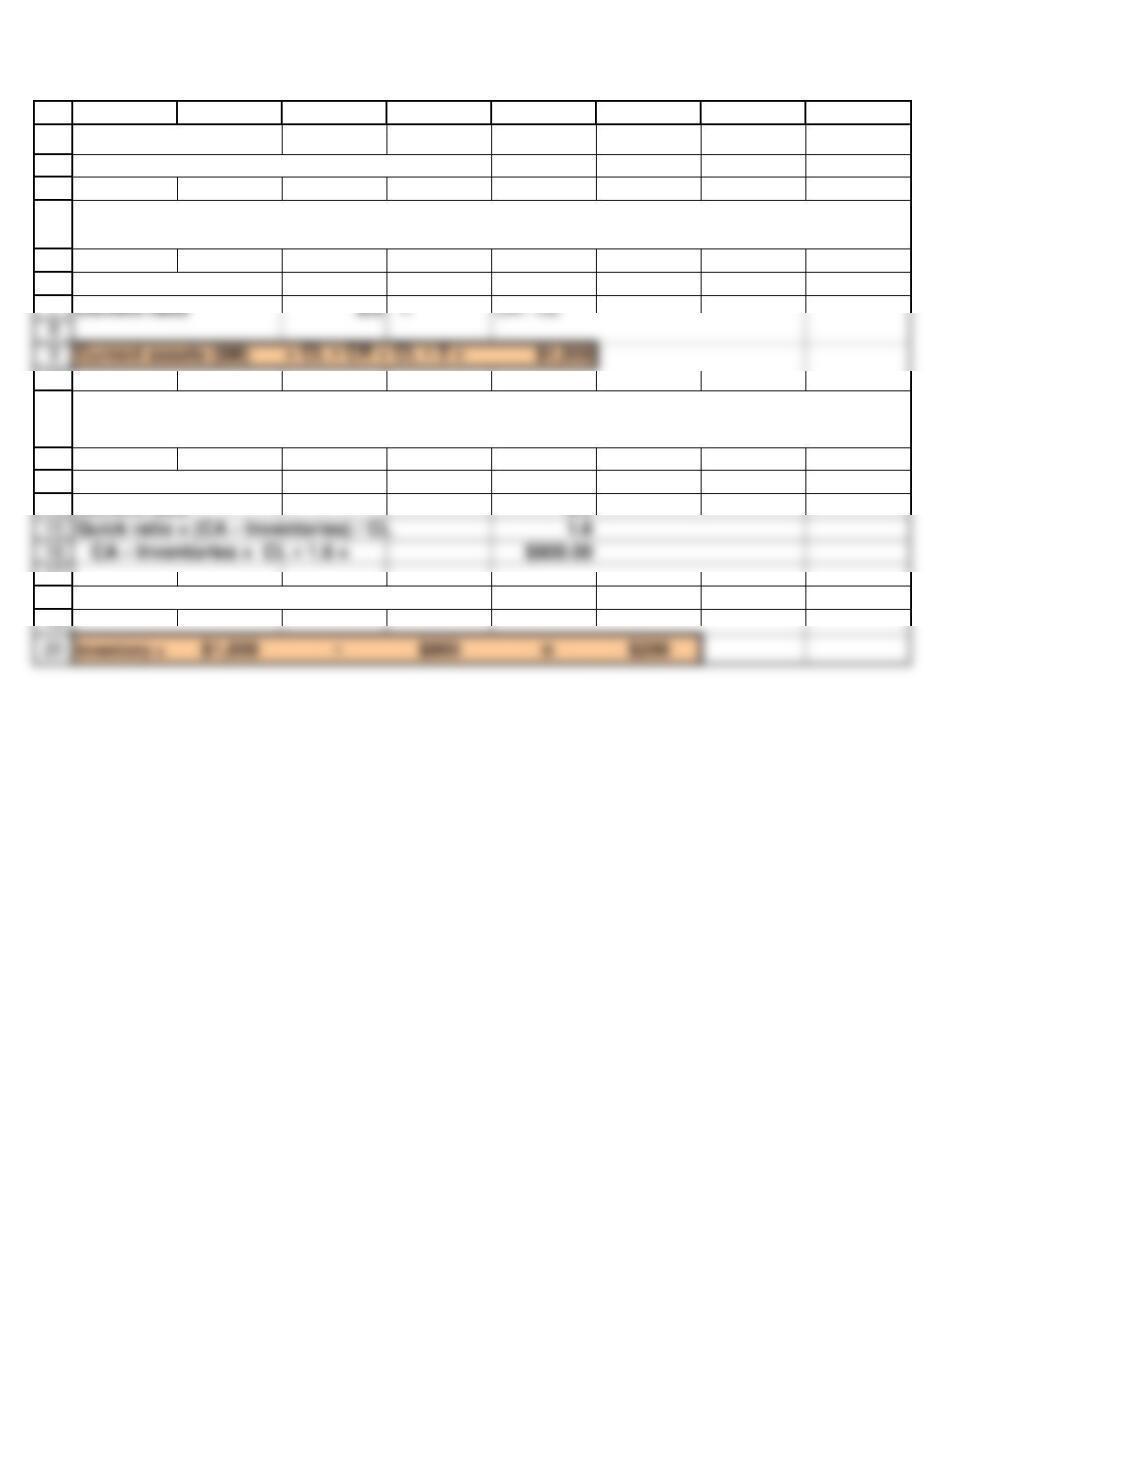
Quick ratio = (CA – Inventories) / CL 1.6
CA – Inventories = CL × 1.6 = $800.00
10
11
12
13
14
17
18
A B C D E F G H
SECTION 4-2 12/12/2018
SOLUTIONS TO SELF-TEST QUESTIONS
Current liabilities ($M) $500
Current liabilities ($M) $500
Current ratio 2.0
Current assets as found in previous question $1,000
4a. A company has current liabilities of $500 million, and its current ratio is 2.0. What is its
level of current assets?
4b. A company has current liabilities of $500 million, and its current ratio is 2.0. If this firm’s
quick ratio is 1.6, how much inventory does it have?
Current ratio 2.0 = CA / CL
1
2
3
4
5
6
Inventory ($M) $20 Not relevant to this question.
Accounts receivable ($M) $30
11
12
13
14
A B C D E F G H
SECTION 4-3 12/12/2018
SOLUTIONS TO SELF-TEST QUESTIONS
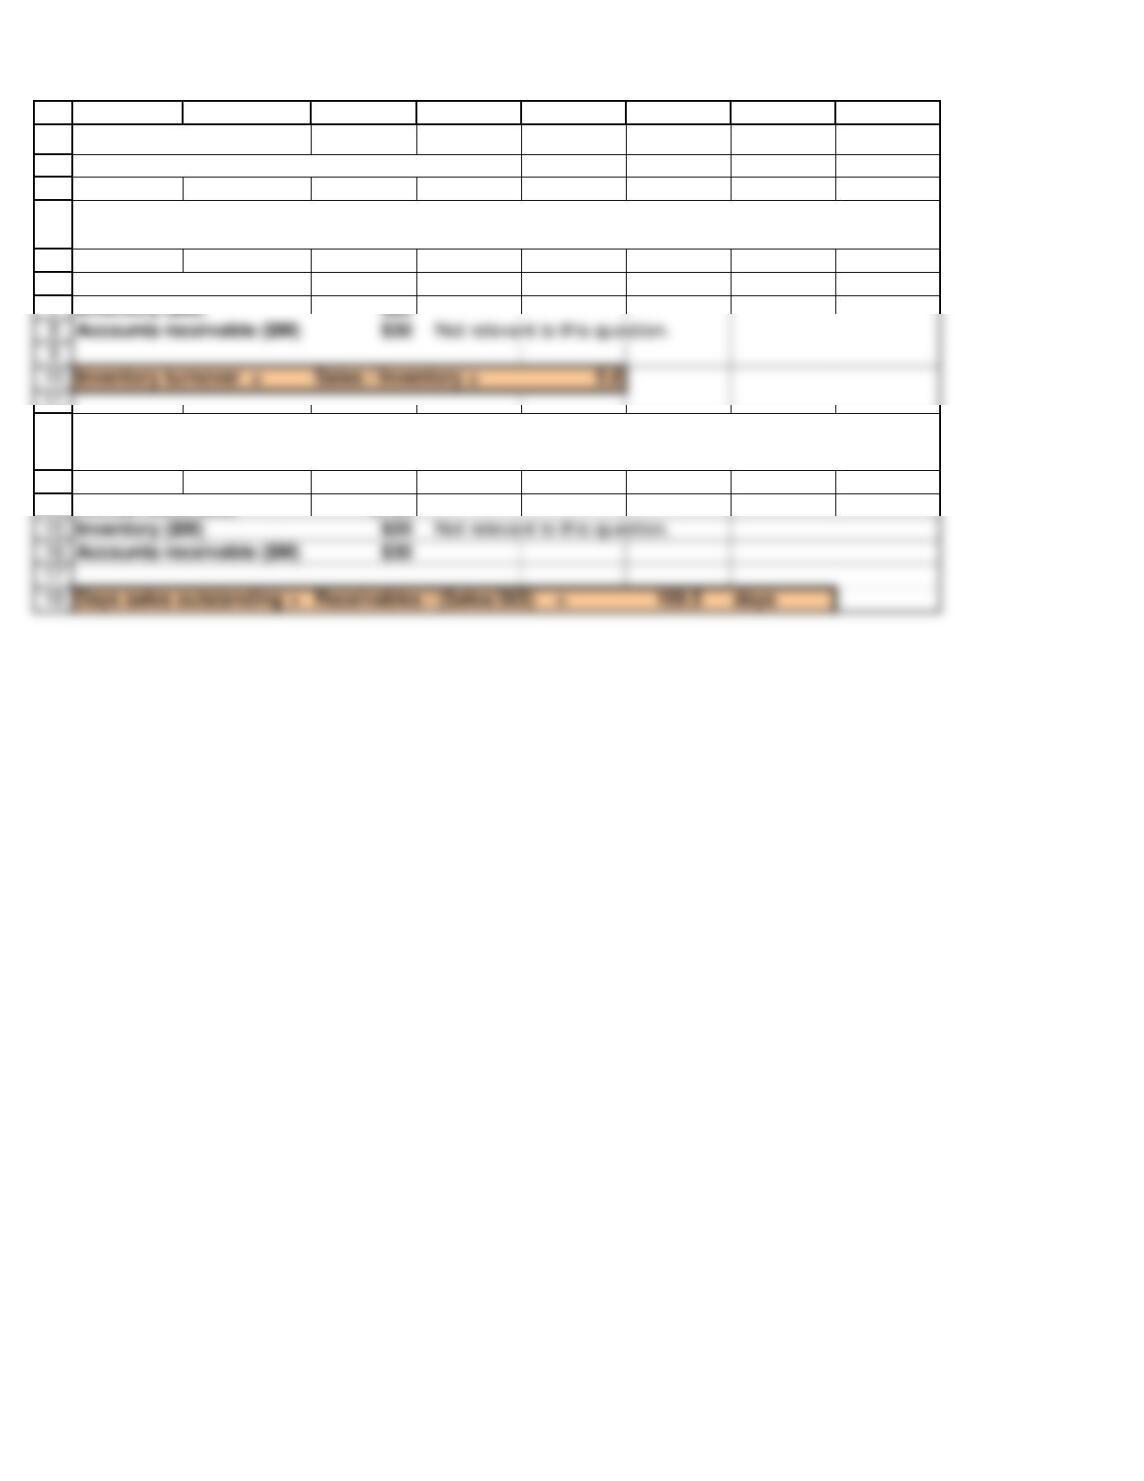
Annual Sales ($M) $100
Annual Sales ($M) $100
5a. A firm has annual sales of $100 million, $20 million of inventory, and $30 million of accounts
receivable. What is its inventory turnover ratio?
5b. A firm has annual sales of $100 million, $20 million of inventory, and $30 million of accounts
receivable. What is its DSO?
Inventory ($M) $20
Accounts receivable ($M) $30 Not relevant to this question.
ROE = $10 /$100
ROE = 10.00%
Since there is no debt, firm has no interest expense so EBIT(1-T) = Net income.
ROIC = EBIT(1-T) / Debt + Equity
ROIC = $10 /$100
ROIC = 10.00%
1
2
3
4
5
6
7
8
14
15
16
A B C D E F G H
SECTION 4-5 12/12/2018
SOLUTIONS TO SELF-TEST QUESTIONS
Assumptions: Insert numbers to arrive at answers
Total assets $100
Net income $10
Since there is no debt, firm is 100% equity financed so Equity = Assets.
ROE = Net income / Equity
4. A company has 10% ROA. Assume that a company’s total assets equal total invested capital,
and that the company has no debt, so its total invested capital equals total equity. What is the
company’s ROE and ROIC?
Tax rate 40.00%
ROA = Net income / Total assets
ROA = $10 /$100
ROA = 10.00%
1
2
3
4
5
12
13
14
15
16
17
18
31
32
33
34
35
36
37
44
45
A B C D E F G H I
Table 4A.1 Allied: Common Size Income Statements 12/12/2018
Income Statement:
2019
Industry
Composite
2019 2018 Industry 2019 2018
Net sales 100.0% 100.0% 100.0% 407,333 3,000 2,850
Operating costs excl. deprec. & amort. 88.0% 87.4% 87.6% 358,453 2,622 2,497
Depreciation & amortization 2.0% 3.3% 3.2% 8,147 100 90
Table 4A.2 Allied: Common Size Balance Sheets
Balance Sheet:
2019
Industry
Composite
2019 2018 Industry 2019 2018
Cash & equivalents 1.4% 0.5% 4.8% 3,275 10 80
Accounts receivable 17.8% 18.8% 18.8% 40,175 375 315
Inventories 16.5% 30.8% 24.7% 37,370 615 415
Total current assets 35.7% 50.0% 48.2% 80,820 1,000 810
Table 4A.3 Allied: Income Statement Percentage Change Analysis
Income Statement:
Base year = 2018
Percent
Change in
2019
Net sales 5.3%
Operating costs excl. deprec. & amort. 5.0%
Depreciation & amortization 11.1%
Allied: Balance Sheet Percentage Change Analysis
46
47
48
49
50
51
A B C D E F G H I
Balance Sheet:
Base year = 2018
Percent
Change in
2019
Cash & equivalents -87.5%
Accounts receivable 19.0%
Inventories 48.2%
Total current assets 23.5%