90 Chapter 4
P4.3 Indifference Curves. Suggest briefly whether each of the following statements about
indifference curves that show preferences between goods and services is true or false
and defend your answer.
A. Consumers prefer higher indifference curves that represent greater combinations
of goods and services to lower indifference curves that represent smaller
combinations of goods and services.
B. Indifference curves slope downward because if the quantity of one consumer
product is reduced, the quantity of the other must also decrease to maintain the
same degree of utility.
C. The slope of an indifference curve shows the rate at which consumers are willing
to tradeoff goods and services.
D. The fact that indifference curves do not intersect stems from the “more is better”
principle.
E. Indifference curves bend inward (are convex to the origin) because if goods are
relatively abundant, the added value of another unit of goods will be small in
relation to the added value of another unit of services.
P4.3 SOLUTION
Demand Analysis 91
curve involving a greater amount of services must give greater satisfaction. Similarly,
holding services constant, an indifference curve involving a greater amount of goods
must give greater satisfaction. This stems from the fact that goods and services both
provide consumer benefits, and reflects the “more is better” principle.
P4.4 Budget Constraints. Holding all else equal, indicate how each of the following changes
would affect a budget constraint that limits consumption of goods (Y) and services (X).
Explain your answer.
A. Deflation that uniformly drops the price of all goods and services.
P4.4 SOLUTION
92 Chapter 4
A. Deflation that drops the price of all goods and services results in a parallel rightward
(outward) shift in the budget constraint. Holding income constant, lower prices make it
income.
C. Technical change that reduces the price of goods, but leaves the price of services
D. Economic growth that boosts the level of disposable income results in a parallel
P4.5 Elasticity. The demand for personal computers can be characterized by the following
point elasticities: price elasticity = -5, cross-price elasticity with software = -4, and
income elasticity = 2.5. Indicate whether each of the following statements is true or
false, and explain your answer.
Demand Analysis 93
A. A price reduction for personal computers will increase both the number of units
demanded and the total revenue of sellers.
B. The cross-price elasticity indicates that a 5% reduction in the price of personal
computers will cause a 20% increase in software demand.
C. Demand for personal computers is price elastic and computers are cyclical
normal goods.
D. Falling software prices will increase revenues received by sellers of both
computers and software.
E. A 2% price reduction would be necessary to overcome the effects of a 1% decline
in income.
P4.5 SOLUTION
A. True. A price reduction always increases units sold, given a downward sloping demand
curve. The negative sign on the price elasticity indicates that this is indeed the case here.
P4.6 Optimal Pricing. In an effort to reduce excess end-of-the-model-year inventory,
Harrison Ford offered a 1% discount off the average price of 4WD Escape Gas-Electric
Hybrid SUVs sold during the month of August. Customer response was wildly
enthusiastic, with unit sales rising by 10% over the previous month’s level.
94 Chapter 4
A. Calculate the point price elasticity of demand for Harrison Ford 4WD Escape
Gas-Electric Hybrid SUVs sold during the month of August.
B. Calculate the profit-maximizing price per unit if Harrison Ford has an average
wholesale (invoice) cost of $23,500 and incurs marginal selling costs of $350 per
unit.
P4.6 SOLUTION
B. The profit-maximizing price can be found using the optimal price formula:
P4.7 Cross-Price Elasticity. The South Beach Cafe recently reduced appetizer prices from
$12 to $10 for afternoon “early bird” customers and enjoyed a resulting increase in
sales from 90 to 150 orders per day. Beverage sales also increased from 300 to 600
units per day.
A. Calculate the arc price elasticity of demand for appetizers.
B. Calculate the arc cross-price elasticity of demand between beverage sales and
appetizer prices.
C. Holding all else equal, would you expect an additional appetizer price decrease to
$8 to cause both appetizer and beverage revenues to rise? Explain.
P4.7 SOLUTION
Demand Analysis 95
P4.8 Income Elasticity. Ironside Industries, Inc., is a leading manufacturer of tufted
carpeting under the Ironside brand. Demand for Ironside’s products is closely tied to
the overall pace of building and remodeling activity and, therefore, is highly sensitive to
changes in national income. The carpet manufacturing industry is highly competitive,
so Ironside’s demand is also very price-sensitive.
During the past year, Ironside sold 30 million square yards (units) of carpeting at
an average wholesale price of $15.50 per unit. This year, household income is expected
to ssurge from $55,500 to $58,500 per year in a booming economic recovery.
A. Without any price change, Ironside’s marketing director expects current-year
sales to soar to 50 million units because of rising income. Calculate the implied
income arc elasticity of demand.
B. Given the projected rise in income, the marketing director believes that a volume
of 30 million units could be maintained despite an increase in price of $1 per unit.
On this basis, calculate the implied arc price elasticity of demand.
C. Holding all else equal, would a further increase in price result in higher or lower
total revenue?
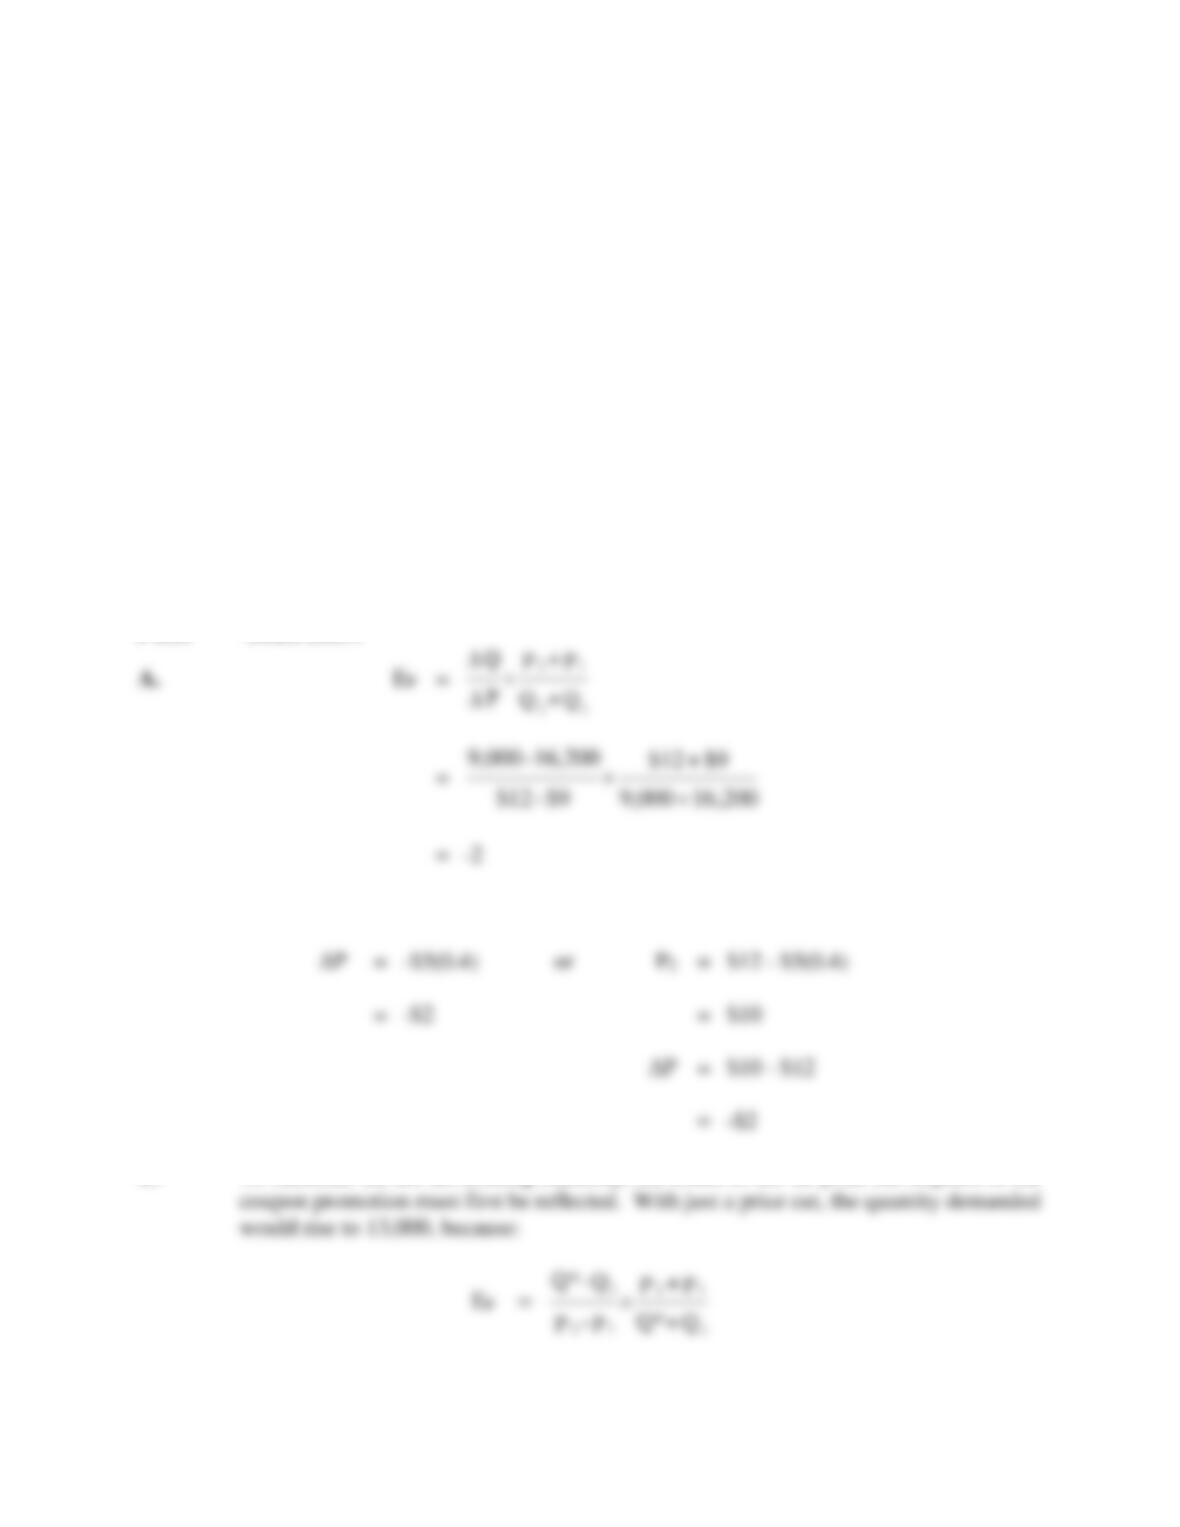
P4.8 SOLUTION
A.
96 Chapter 4
B. Without a price increase, sales this year would total 50 million units. Therefore, it is
P4.9 Cross-Price Elasticity. B. B. Lean is a catalog retailer of a wide variety of sporting
goods and recreational products. Although the market response to the company‘s spring
catalog was generally good, sales of B. B. Lean’s $140 deluxe garment bag declined
from 10,000 to 4,800 units. During this period, a competitor offered a whopping $52 off
their regular $137 price on deluxe garment bags.
A. Calculate the arc cross-price elasticity of demand for B. B. Lean’s deluxe garment
bag.
B. B. B. Lean’s deluxe garment bag sales recovered from 4,800 units to 6,000 units
following a price reduction to $130 per unit. Calculate B. B. Lean’s arc price
elasticity of demand for this product.
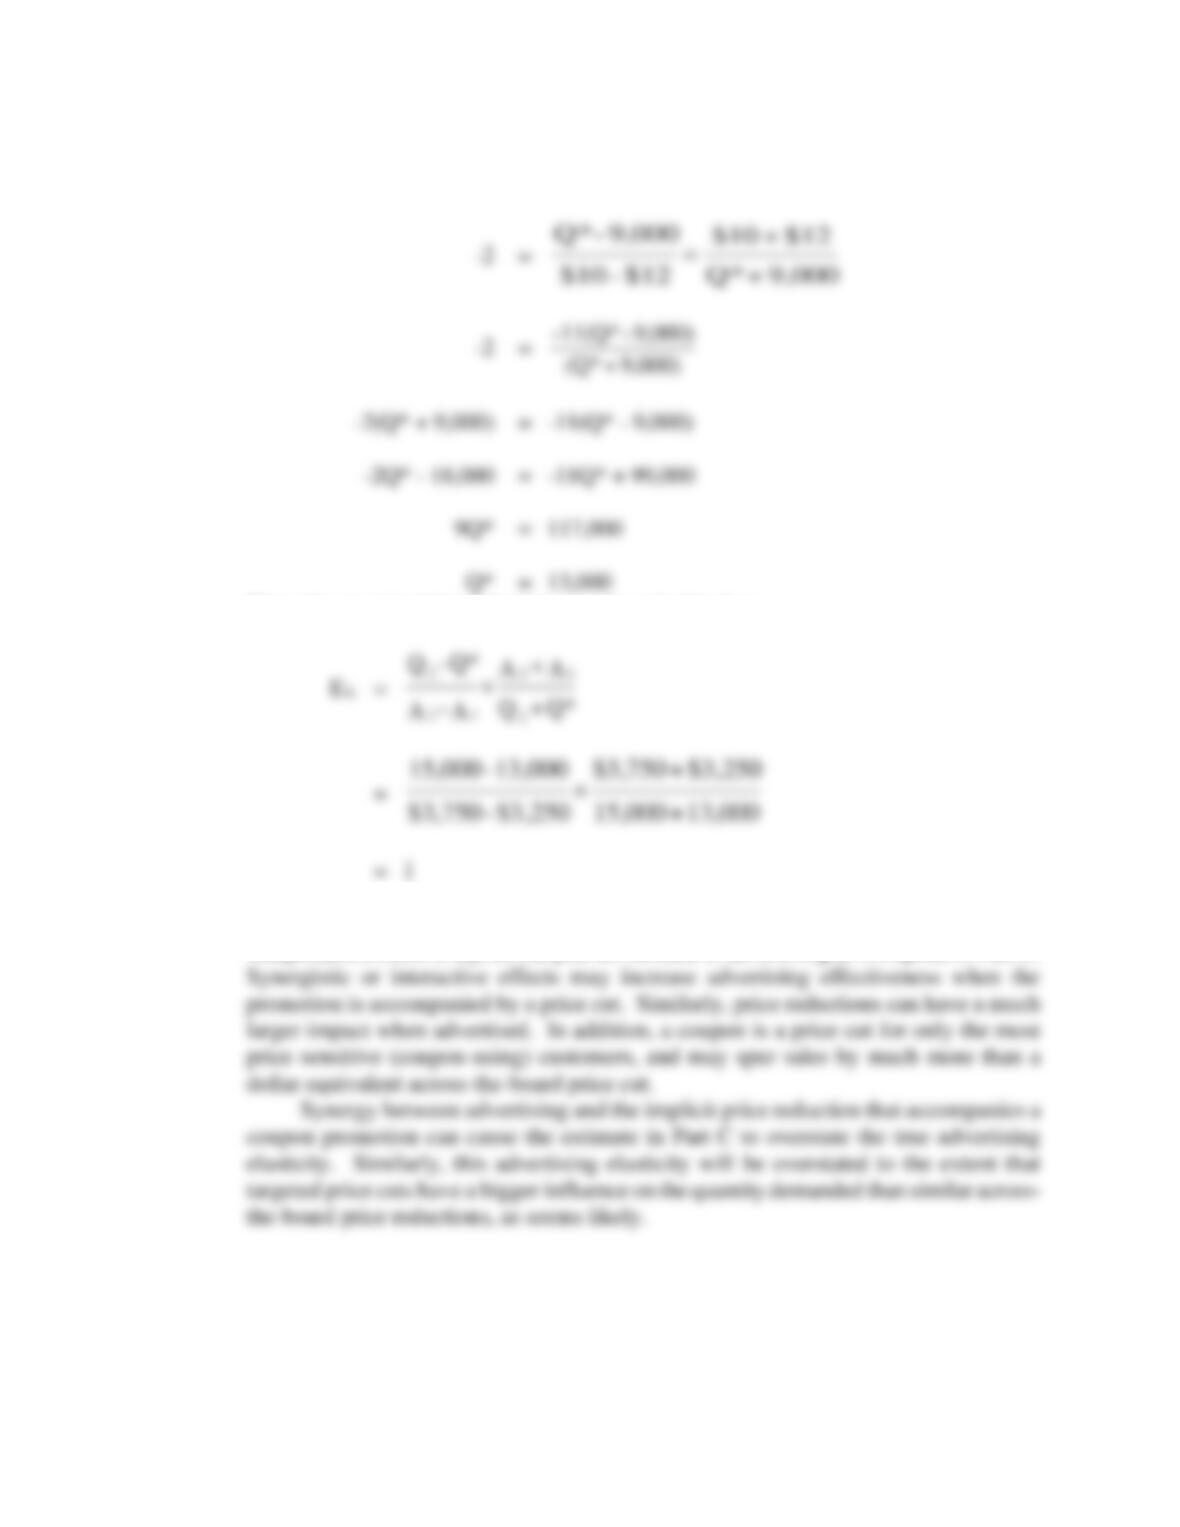
C. Assuming the same arc price elasticity of demand calculated in Part B, determine
the further price reduction necessary for B. B. Lean to fully recover lost sales (i.e.,
regain a volume of 10,000 units).
P4.9 SOLUTION
Demand Analysis 97
This implies a further price reduction of $20 because:
P4.10 Advertising Elasticity. Enchantment Cosmetics, Inc., offers a line of cosmetic and
perfume products marketed through leading department stores. Product Manager Erica
Kane recently raised the suggested retail price on a popular line of mascara products
from $9 to $12 following increases in the costs of labor and materials. Unfortunately,
sales dropped sharply from 16,200 to 9,000 units per month. In an effort to regain lost
sales, Enchantment ran a coupon promotion featuring $5 off the new regular price.
Coupon printing and distribution costs totaled $500 per month and represented a
substantial increase over the typical advertising budget of $3,250 per month. Despite
98 Chapter 4
these added costs, the promotion was judged to be a success, as it proved to be highly
popular with consumers. In the period prior to expiration, coupons were used on 40%
of all purchases and monthly sales rose to 15,000 units.
A. Calculate the arc price elasticity implied by the initial response to the
Enchantment price increase.
B. Calculate the effective price reduction resulting from the coupon promotion.
C. In light of the price reduction associated with the coupon promotion and assuming
no change in the price elasticity of demand, calculate Enchantment’s arc
advertising elasticity.
D. Why might the true arc advertising elasticity differ from that calculated in part C?
P4.10 SOLUTION
B. The effective price reduction is $2 since 40% of sales are accompanied by a coupon:
C. To calculate the arc advertising elasticity, the effect of the $2 price cut implicit in the
Demand Analysis 99
Then, the arc advertising elasticity can be calculated as:
D. It is important to recognize that a coupon promotion can involve more than just the
independent effects of a price cut plus an increase in advertising as is implied in Part C.
100 Chapter 4
CASE STUDY FOR CHAPTER 4
Optimal Level of Advertising
The concept of multivariate optimization is important in managerial economics because many
demand and supply relations involve more than two variables. In demand analysis, it is typical to
consider the quantity sold as a function of the price of the product itself, the price of other goods,
advertising, income, and other factors. In cost analysis, cost is determined by output, input prices,
the nature of technology, and so on..
When analyzing multivariate relations such as these, one is interested in the marginal effect of each
independent variable on the quantity sold, the dependent variable. Optimization requires an
analysis of how a change in each independent variable affects the dependent variable, holding
constant the effect of all other independent variables. The partial derivative concept is used in this
type of marginal analysis.
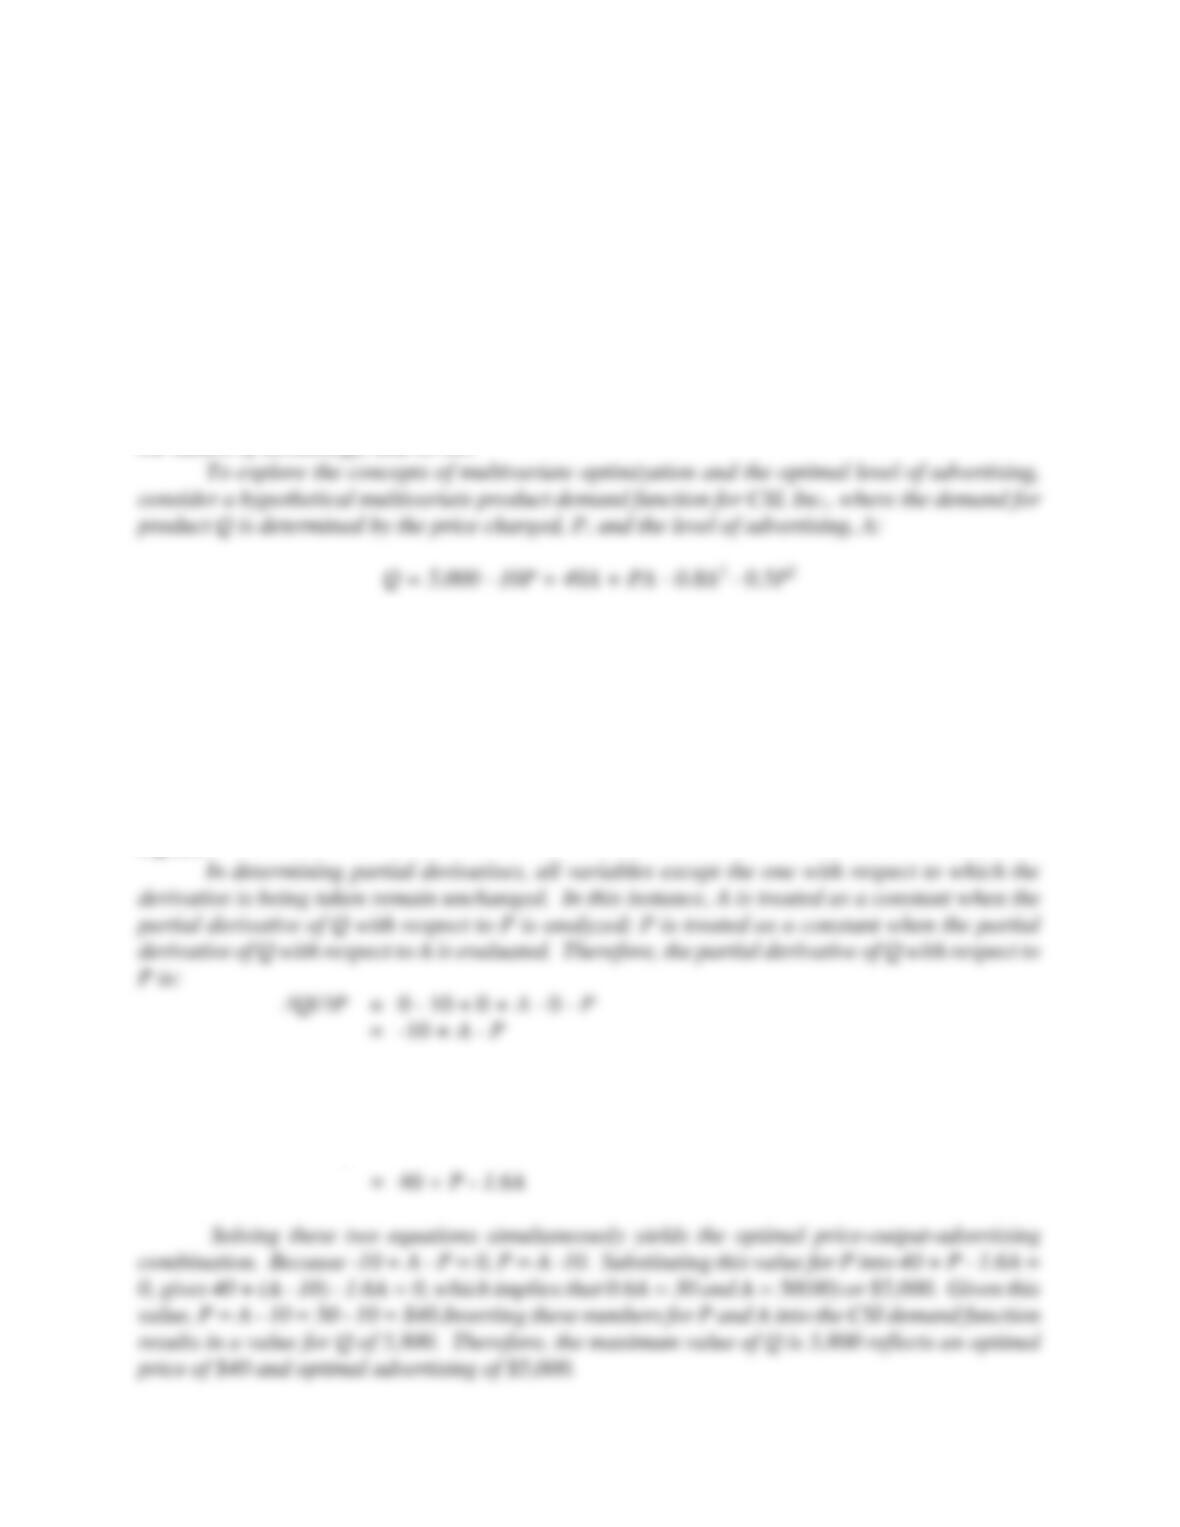
In light of the fact that the CSI demand function includes two independent variables, the price
of the product itself and advertising, it is possible to examine two partial derivatives: the partial of Q
with respect to price, or ΔQ/ΔP, and the partial of Q with respect to advertising expenditures, or
ΔQ/ΔA.
The partial with respect to A is:
ΔQ/ΔA
= 0 – 0 + 40 + P – 1.6A – 0
Demand Analysis 101
One attractive use of computer spreadsheets is to create simple numerical examples that can
be used to conclusively show the change in sales, profits and other variables that occur as one
approaches and moves beyond the profit-maximizing activity level.
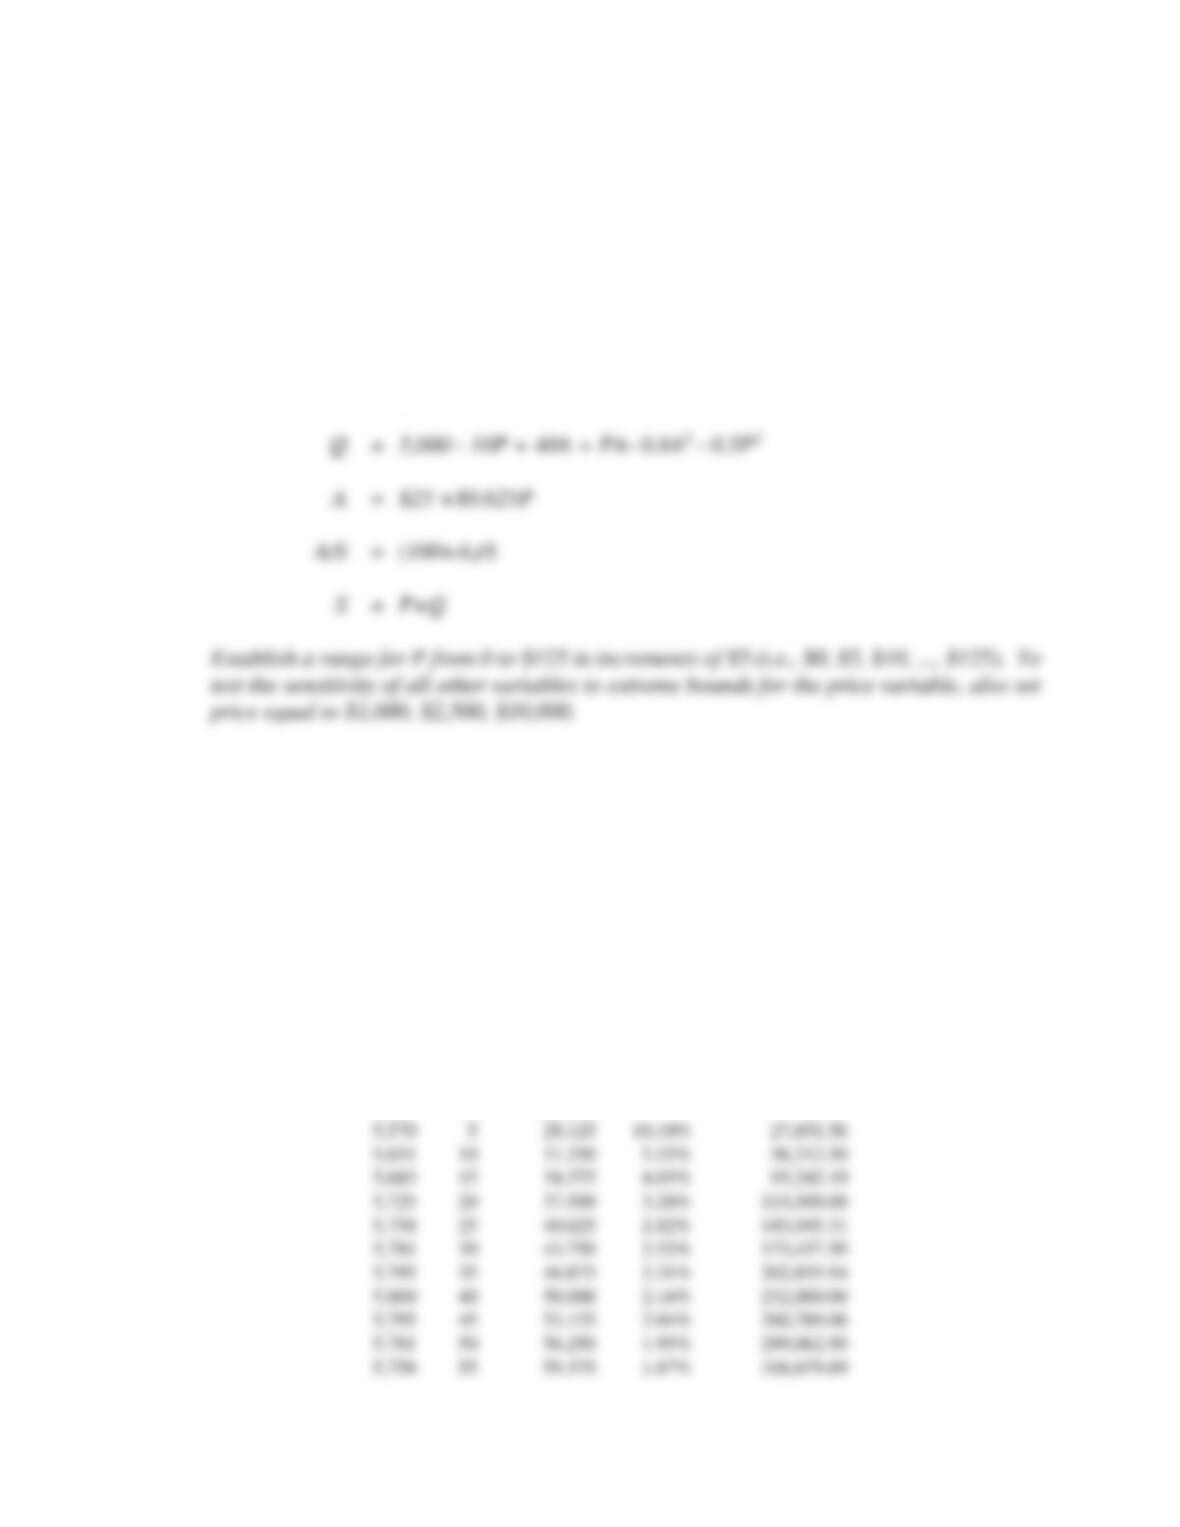
A. Set up a table or spreadsheet for CSI, that illustrates the relationships among quantity (Q),
price (P), the optimal level of advertising (A), the advertising-sales ratio (A/S), and sales
revenue (S). In this spreadsheet, use formula functions to set
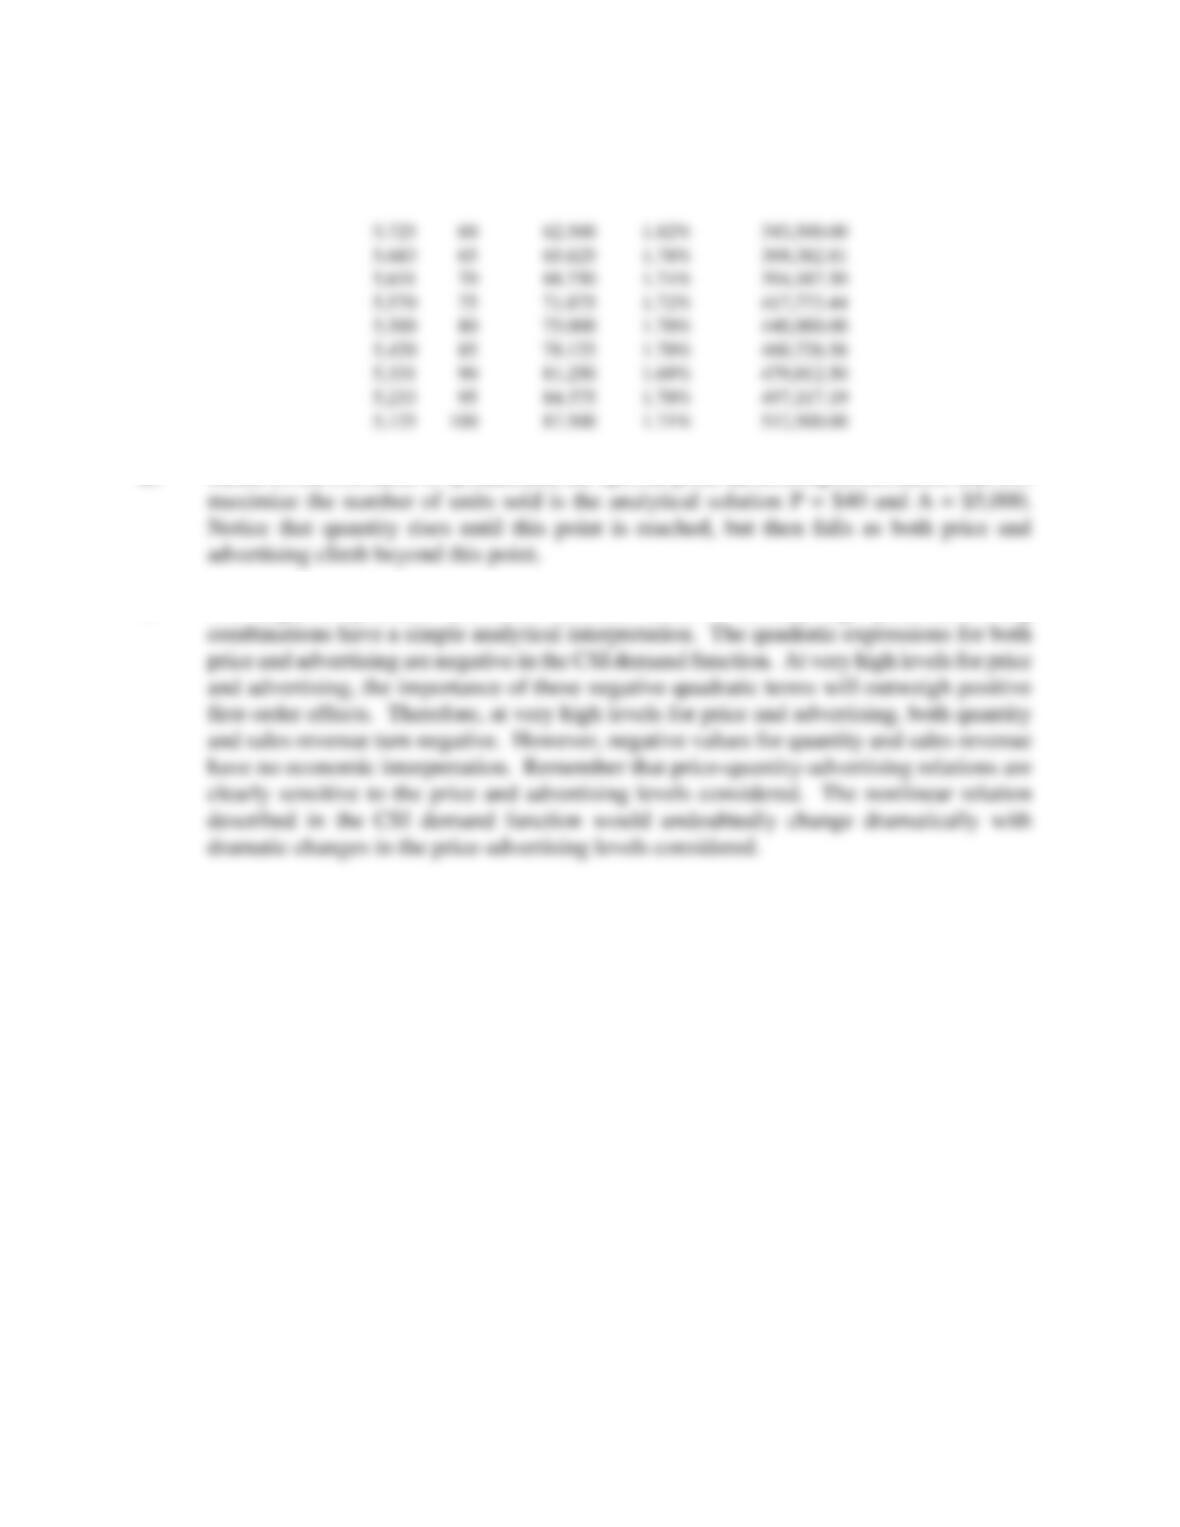
B. Based on the CSI table or spreadsheet, determine the price-advertising combination that will
maximize the number of units sold.
C. Give an analytical explanation of the negative quantity and sales revenue levels observed at
very high price-advertising combinations. Do these negative values have an economic
interpretation as well?
CASE STUDY SOLUTION
A. The table or spreadsheet for CSI’s unit sales quantity (Q), price (P), optimal advertising level
(A), advertising intensity (A/S), and sales revenue (S) is:
Quantity
Price
Advertising
Ad/Sales
Sales Revenue
5,500
$0
$25.000
—–
$0.00
5,631
10
5.55%
5,725
20
3.28%
5,781
30
2.52%
5,800
40
2.16%
102 Chapter 4
B. Based on the CSI table or spreadsheet, the optimal price-advertising combination that will
C. The negative quantities and sales revenues observed at very high price-advertising