
Chapter 30
Income, Poverty, and Health Care
◼ Overview
This chapter addresses the concepts of income and wealth distribution and the difference between them.
In an attempt to measure inequality, the chapter develops the Lorenz curve and explains how it is
interpreted. The question of why different people earn different incomes is analyzed; age-income
profiles and the marginal productivity theory are discussed. The conditions necessary for exploitation and
◼ Learning Objectives
After studying this chapter, students should be able to:
• 30.1 Describe how to use a Lorenz curve to represent a nation’s income distribution
◼ Outline
I. The Distribution of Income: Income is a payment for labor services or a payment for ownership of
one of the other factors of production. (See Figures 30-1 and 30-2.)
A. Measuring Income Distribution: The Lorenz Curve: A geometric representation of the
distribution of income. A Lorenz curve that is perfectly straight represents perfect income
equality. The more bowed a Lorenz curve, the more unequally income is distributed.
1. A Numerical Income-Distribution Measure: The Gini Coefficient: The ratio of the area
between the line of perfect equality and the Lorenz curve.
2. Criticisms of the Lorenz Curve
a. The Lorenz curve is typically presented in terms of the distribution of money income only.
b. It does not account for differences in family size and effort.

454 Miller • Economics Today, Nineteenth Edition
e. It does not measure unreported income from the underground economy.
B. Income Distribution in the United States: There have been only slight changes in the distribution
C. The Distribution of Wealth: The distribution of income (a flow) is different from the
II. Determinants of Income Differences
A. Age: With age comes more education, training, and experience, which affects earnings.
1. The Age-Earnings Cycle: The regular earnings profile of an individual throughout his or
B. Marginal Productivity: Workers can expect to be paid their marginal revenue product (assuming
that there are low–cost information flows and the labor and product markets are competitive).
1. Determinants of Marginal Productivity
a. Talent: This is a factor that cannot be acquired if one does not have it.
2. Investment in Human Capital: An important reason for forgoing income from working in
C. Inheritance: An inheritance can consist of cash, jewelry, stocks, bonds, houses, and other real
estate. Only about 10 percent of inequality of income can be traced to differences in inherited
wealth.
D. Discrimination: Economic discrimination occurs whenever workers with the same marginal
revenue product get unequal pay due to some noneconomic factor, such as race, gender, or age.
E. Theories of Desired Income Distribution: Two normative standards for the distribution of
income have been popular with economists.
1. Productivity: “To each according to what he or she produces” is a contributive standard. It
2. Equality: “To each exactly the same” is the egalitarian principle, which means that
everyone would get the same amount. The problem with this concept is that the incentive
of higher rewards would be eliminated.
a. Differences in Job Characteristics: Some jobs are more unpleasant or require more

Chapter 30 Income, Poverty, and Health Care 455
III. Poverty and Attempts to Eliminate It: The poverty rate, which is the percentage of the U.S.
population determined to be in a state of poverty by the government, has varied between roughly
11 percent and 16 percent since 1965. A number of welfare programs are set up for the purpose of
redistributing income from the better off to the poor and for that purpose alone, but these programs
have not been entirely successful. (See Figure 30-6.)
B. Absolute Poverty: Because the low–income threshold as an absolute measure never changes in
C. Relative Poverty: Poverty has generally been defined in relative terms; that is, it is defined in
terms of the income levels of individuals or relative to the rest of the population.
D. Attacks on Poverty: Major Income Maintenance Programs
1. Social Security: For the retired, unemployed, and disabled, certain insurance programs
2. Supplemental Security Income and Temporary Assistance to Needy Families: Many poor
people do not qualify for Social Security benefits. They are assisted through Supplemental
3. Supplemental Nutrition Assistance Program: Food stamps are government-issued
4. The Earned Income Tax Credit Program: In 1975, the EITC was created to provide
E. No Apparent Reduction in Poverty Rates: The official poverty rate in the United States has
IV. Health Care: Sometimes people become poor because of inadequate (or no) health insurance. They
deplete their wealth paying for the expenses of an illness. Some workers may remain in a job because
of the health insurance benefits.
A. The U.S. Health Care Situation: Spending for health care in the United States accounts for
about 16 percent of U.S. real GDP. The U.S. per-person cost of health care is greater than
anywhere else in the world. (See Figure 30-7.)
1. Why Have Health Care Costs Risen So Much?
a. The Age–Health Care Expenditure Equation: The top 5 percent of health care users
456 Miller • Economics Today, Nineteenth Edition
b. New Technologies: High technology is another reason health care costs have risen
c. Third-Party Financing: Medicare, Medicaid, and private insurance companies are third
parties. When they pay for medical costs, the demand for services increases. Medicare
2. Price, Quantity Demanded, and the Question of Moral Hazard: Because of third-party
payment, the effective price facing each consumer of medical services is often zero, or
3. Moral Hazard As It Affects Physicians and Hospitals: Because patients do not pay
B. The Nationalization of U.S. Health Care Spending: In 2010, a law that will govern the future
operation of U.S. health care markets was signed.
1. Government Health Insurance Mandates: Table 30-2 provides a summary of the
components of the new health care law. The first two are restraints on choices by firms and
2. Government Health Care Subsidies: Persons with incomes as much as 33 percent above
the poverty income level will qualify for Medicaid. Other individuals and families with
3. Government Health Insurance Exchanges: These are government agencies that the
4. Regulations and Taxes: Special tax rates on high-income individuals and families help
5. Economic Effects of the National Health Care Program: The program will affect health
care markets, labor markets, product markets, and government budgets.
a. An enlarged scope of third-party payments for health care services: Millions of
individuals will face lower out-of-pocket health care costs for medical treatments, and
Chapter 30 Income, Poverty, and Health Care 457
b. Labor market impacts: The requirement for many firms to pay for health insurance
◼ Points to Emphasize
Does Equitable Mean Equal?
Many people believe that a more equitable distribution of income requires more income equality. Is this
notion reasonable? First, equitable means fair, not equal. Whether one thinks it is fair to take from the rich
and give to the poor is a value judgment. There is no scientific way to demonstrate that a more equal
Wage As a Marginal Revenue Product
People tend to get paid their marginal revenue product as long as markets are reasonably competitive. If a
given person is being paid less than his MRP, she can simply change jobs. Another employer will be glad
The Issue of Talent and Innate Abilities: Are African Americans
Really Better Athletes Than Whites?
Bill Russell (the former Boston Celtics basketball great) answered “no” to this question posed during one
of his lectures. According to Russell, African Americans have fewer job opportunities in the marketplace
458 Miller • Economics Today, Nineteenth Edition
Relative Poverty
Almost every poverty study done in the past half century has concluded that the lowest 20 percent of the
population studied was living in poverty. This has interesting implications. If incomes continue to rise in
◼ For Those Who Wish to Stress Theory
The Lorenz Curve and Overstatement of Income Inequality
The Lorenz curve overstates the degree of income inequality in the United States and in other modern
economic societies. The Lorenz curve typically does not measure income–in-kind transfers. Milton
Friedman’s Permanent Income Hypothesis also predicts that measured income differences overstate the
The College Investment
Returns on a college investment have been falling in recent years, but it may be that even these lower
rates overestimate the return on a college investment. Many college students might have high paying jobs
Nonequalizing Wage Differences
Nonequalizing wage differences implies that income differences are more apparent than real. Consider
Chapter 30 Income, Poverty, and Health Care 459
Are Star Athletes Overpaid?
Are star athletes really worth the millions they are paid? Although much is made of the innate abilities of
these persons, it is also true that most of them have made very large investments of time into developing
◼ Further Questions for Class Discussion
1. Should society strive for equality of opportunity to the degree that society can provide it, rather than
equality of outcome? This dichotomy is at the heart of liberal and conservative views of what a just
2. To what degree is income inequality a result of choices made by individuals? Students can have
3. How does the existence of third-party payers affect the purchase of health care services? The
idea presented in the text that the net price of medical services affects the quantity demanded is
almost an alien one to most young people. They will often argue that if they are “really sick” they

4. According to Chapter 6, 85 percent of all taxpaying U.S. residents pay roughly the same proportion
of their total income in federal taxes. What effect, if any, would the federal tax system have on the
5. There are many types of medications and technologies that are very costly compared to older ones.
MRIs, for example, are much more costly than traditional X-ray technologies but provide
significantly more detailed pictures of the interior of the body. New types of pharmaceuticals as
well as new ways to deliver existing pharmaceuticals—e.g., time-release forms to reduce the
number of times per day a pill must be taken—are generally more expensive that existing
pharmaceuticals. Are high-priced health care technologies necessarily inefficient simply because
6. What do you predict will happen to the prices of health care services when 30 million currently
uninsured Americans have health care insurance under the new federal health care program? Why?
◼ Answers to Questions for Class Critical Analysis
Pitfalls in Contemplating the Distribution of Households across Income Ranges
(p. 672)
Why do you suppose that choosing other income increments besides $15,000 or $30,000 can yield
even more distributional variations of households within these seven income groupings? (Hint:
What do you think could happen if one were to broaden the income increments to $100,000 or
narrow them to $5,000 while holding the number of income groups equal to seven?)
Trying to Close the Parental “World Gap” between Rich and Poor with “Nudges”
(p. 676)
What do you think motivates proposals to require sellers of disposable diapers to print messages on
diapers encouraging parents to tell stories to or read to their babies or young children?

Chapter 30 Income, Poverty, and Health Care 461
A Few Medications Account for a Large Share of Medicare Drug Spending (p. 684)
Who provides the more than $100 billion that Medicare spends on prescription drugs each year?
◼ You Are There
Choosing Not to Purchase Health Insurance (p. 686)
1. Who do you think provides funds to cover emergency room expenses for an uninsured
patient who pays the annual $250 health-law penalty but fails to pay the emergency room’s
charges?
2. Could it be rational for someone to choose to be uninsured and pay the annual $250
penalty? Explain your reasoning.
◼ Issues and Applications
Do Antipoverty Programs Contribute to Poverty by Penalizing Marriage?
(pp. 687–688)
1. How might a state such as Arkansas adjust its administration of income maintenance
programs to reduce or eliminate the marriage penalty? (Hint: What if the state were to base
program’ benefits on total dollars of income received by both adults combined whether or
not they were married?)
2. Why do you suppose that observers have proposed redesigning income maintenance
programs to provide a “marriage premium” via extra benefits if adults with children
marry?
462 Miller • Economics Today, Nineteenth Edition
◼ Research Project
1. To see recent estimates of marriage penalties in antipoverty programs, see the Web Links in
◼ Answers to Problems
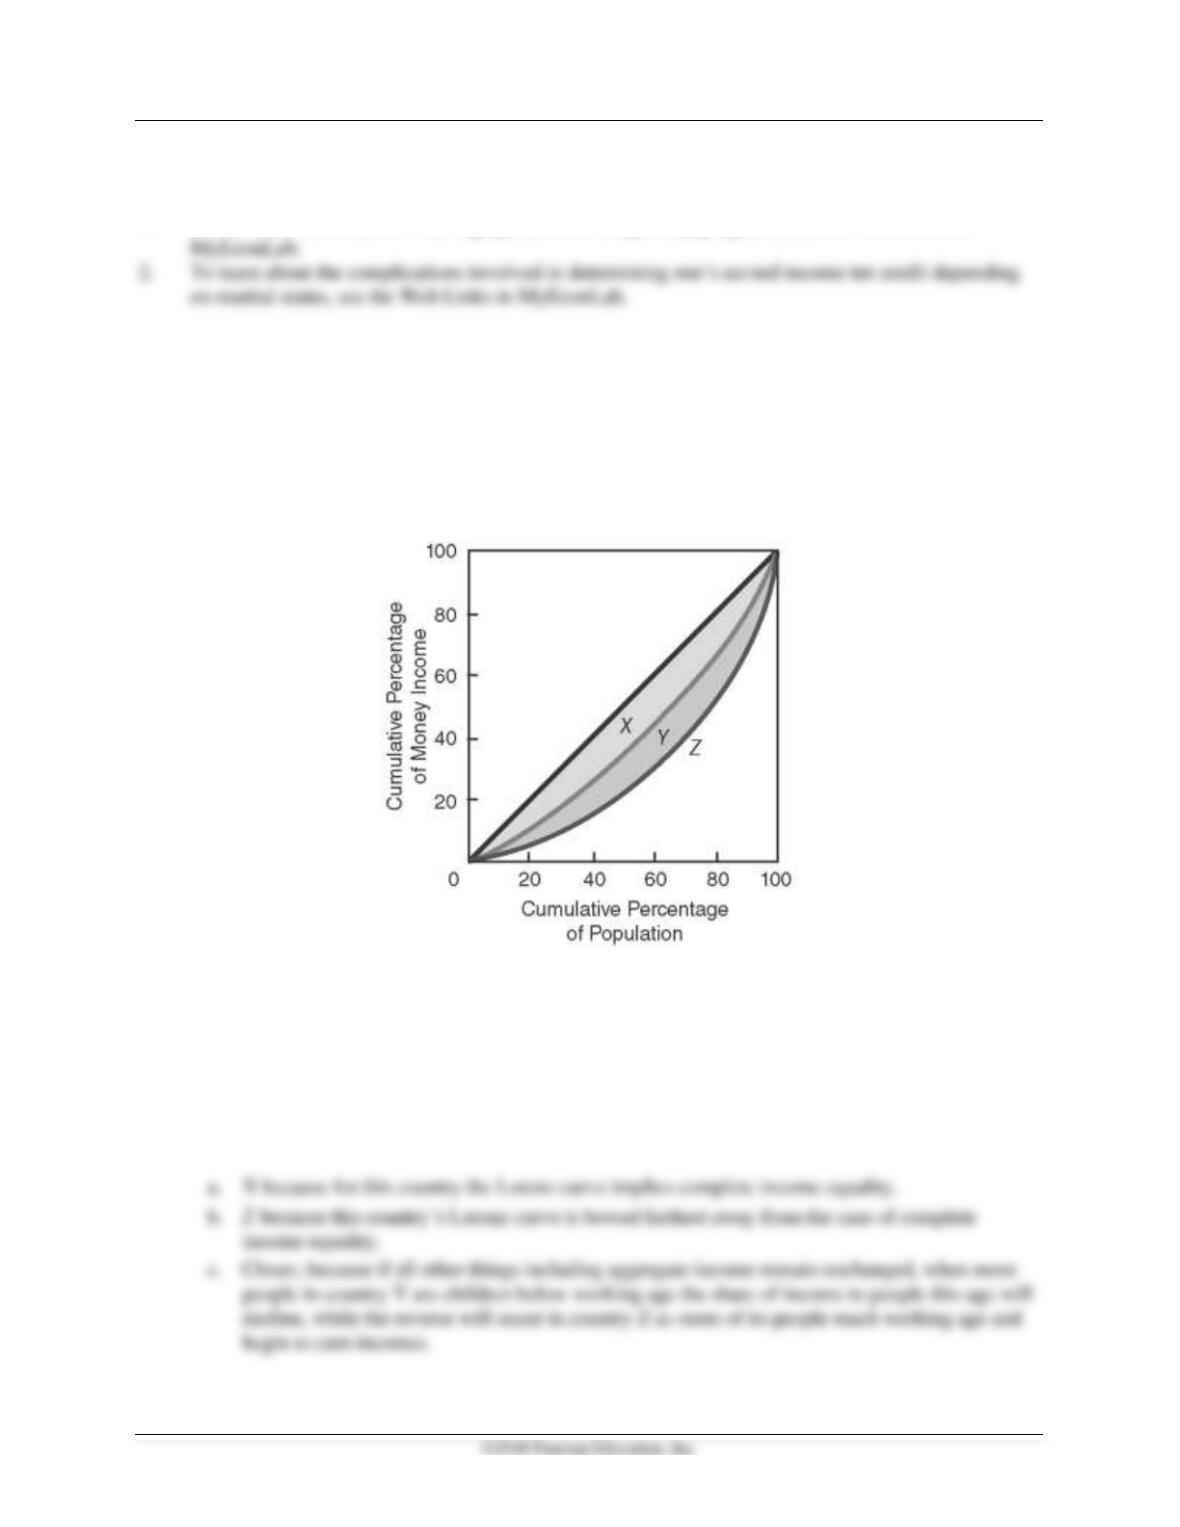
30-1. Consider the graph at the right, which depicts Lorenz curves for countries X, Y, and Z.
a. Which country has the least income inequality?
b. Which country has the most income inequality?
c. Countries Y and Z are identical in all but one respect: population distribution. The
share of the population made up of children below working age is much higher in
country Z. Recently, however, birthrates have declined in country Z and risen in
country Y. Assuming that the countries remain identical in all other respects, would you
expect that in 20 years the Lorenz curves for the two countries will be closer together or
farther apart? (Hint: According to the age-earnings cycle, what typically happens to
income as an individual begins working and ages?)

30-2. Consider the following estimates from the early 2010s of shares of income to each group.
Use graph paper or a hand-drawn diagram to draw rough Lorenz curves for each country.
Which has the most nearly equal distribution, based on your diagram?
Country
Poorest 40%
Next 30%
Next 20%
Richest 10%
Bolivia
13
21
26
40
Chile
13
20
26
41
Uruguay
22
26
26
26
30-3. Consider Figure 30-1 to answer the questions that follow.
a. What is the value of the Gini coefficient if area B is twice as large as area A?
b. Suppose that the Lorenz curve becomes more bowed, with the result that area B
becomes exactly the same size as area A. What will be the new value of the Gini
coefficient?
30-4. Suppose that a nation has implemented a system for applying a tax rate of 2 percent to the
incomes earned by the 10 percent of its residents with the highest incomes. All funds
collected are then transferred directly to the 10 percent of the nation’s residents with the
lowest incomes. What is the general effect on the shape of a Lorenz curve based on incomes
after collection and redistribution of the tax?
30-5. Estimates indicate that in recent years, the poorest 40 percent of the population earned
about 15 percent of total income in Argentina. In Brazil, the poorest 40 percent earned
about 10 percent of total income. The next-highest 30 percent of income earners in
Argentina received roughly 25 percent of total income. In Brazil, the next-highest 30
percent of income earners received approximately 20 percent of total income. Can you
determine, without drawing a diagram (though you can if you wish), which country’s
Lorenz curve was bowed out farther to the right?
30-6. Explain why the productivity standard for the distribution of income entails rewarding
people based on their contribution to society’s total output. Why does the productivity
standard typically fail to yield an equal distribution of income?
30-7. Identify whether each of the following proposed poverty measures is an absolute or relative
measure of poverty, and discuss whether poverty could ever be eliminated if that measure
were utilized.
a. An inflation-adjusted annual income of $25,000 for an urban family of four
b. Individuals with annual incomes among the lowest 15 percent
c. An inflation-adjusted annual income of $10,000 per person
30-8. Some economists have argued that if the government wishes to subsidize health care, it
should instead provide predetermined amounts of payments (based on the type of health
care problems experienced) directly to patients, who then would be free to choose their
health care providers. Whether or not you agree, can you give an economic rationale for
this approach to governmental health care funding?
30-9. Suppose that a government agency guarantees to pay all of an individual’s future health
care expenses after the end of this year, so that the effective price of health care for the
individual will be zero from that date onward. In what ways might this well-intended policy
induce the individual to consume “excessive” health care services in future years?
30-10. Suppose that a group of physicians establishes a joint practice in a remote area. This group
provides the only health care available to people in the local community, and its objective is
to maximize total economic profits for the group’s members. Draw a diagram illustrating
how the price and quantity of health care will be determined in this community. (Hint: How
does a single producer of any service determine its output and price?)
30-11. A government agency determines that the entire community discussed in Problem 30-10
qualifies for a special program in which the government will pay for a number of health
care services that most residents previously had not consumed. Many residents immediately
make appointments with the community physicians’ group. Given the information in
Problem 30-12, what is the likely effect on the profit-maximizing price and the equilibrium
quantity of health care services provided by the physicians’ group in this community?
30-12. A government agency notifies the physicians’ group in Problem 30-10 that to continue
providing services in the community, the group must document its activities. The resulting
paperwork expenses raise the cost of each unit of health care services that the group
provides. What is the likely effect on the profit-maximizing price and the equilibrium
quantity of health care services provided by the physicians’ group in this community?
30-13. Suppose that in Figure 30-1 the area labeled A is one-fourth of the area denoted B. What is
the value of the Gini coefficient?
30-14. Now suppose that in the situation described in Problem 30-13, the distribution of income
changes in such a way that A increases to one-third of the area denoted B. What is the new
value of the Gini coefficient?
30-15. Based on your answers to Problems 30-13 and 30-14, when A increased, did the degree of
income inequality increase or decrease? Explain why your answer makes sense by referring
to the implied change in the shape of the Lorenz curve.
30-16. Takes a look at Figure 30-4. During the past decade, many members of the baby boom
generation have passed through ages ranging from the middle 40s to the late 50s. Do you
suppose that the fact that there have been more members of this generation than other
generations in the population during this past decade tends to imply that there was higher
or lower measured inequality over the period? Why?
30-17. Consider Figure 30-5, in which the poverty rate has risen in some years and fallen in others
but since 1985 has tended to lie in a range between 10 percent and just over 15 percent. If
the government’s official poverty rate has been based on an absolute measure of poverty
instead of a relative measure, would the data plot have tended generally to have sloped
upward over time or to have sloped downward? Explain.
30-18. Take a look at both Figure 30-7 and Figure 30-8. When health care programs such as
Medicare, Medicaid, and the Affordable Care Act’s health exchange system were created,
Congress based projected costs on quantities of health care consumed at the time the
programs were implemented. Was this a reasonable assumption given that the programs all
cut out-of-pocket payments for beneficiaries? Explain.
◼ Selected References
Bethel, Tom, “The Transfer Society,” The Cato Journal, Vol. 6, No. 1, Spring/Summer 1986.
Bethel, Tom, “The Political Economy of Poverty,” The Cato Journal, Vol. 5, No. 1, Spring/Summer
1985.
Folland, Sherman, Allen Googman, and Miron Stano, The Economics of Health and Health Care,
New York: Macmillan, 1993.