CHAPTER 3 | Where Prices Come From:
The Interaction of Demand
and Supply
Brief Chapter Summary and Learning Objectives
3.1 The Demand Side of the Market (pages 74–82)
List and describe the variables that influence demand.
3.2 The Supply Side of the Market (pages 82–86)
List and describe the variables that influence supply.
3.3 Market Equilibrium: Putting Demand and Supply Together (pages 86–89)
Use a graph to illustrate market equilibrium.
3.4 The Effect of Demand and Supply Shifts on Equilibrium (pages 90–97)
Use demand and supply graphs to predict changes in prices and quantities.
▪ An increase in demand increases the equilibrium price and equilibrium quantity.
Key Terms
Ceteris paribus (“all else equal”) condition,
p. 76. The requirement that when analyzing the
relationship between two variables—such as
price and quantity demanded—other variables
must be held constant.
Complements, p. 78. Goods and services that
are used together.
Demand curve, p. 74. A curve that shows the
relationship between the price of a product and
the quantity of the product demanded.
CHAPTER 3 | Where Prices Come From: The Interaction of Demand and Supply 45
Demand schedule, p. 74. A table that shows the
relationship between the price of a product and
the quantity of the product demanded.
Inferior good, p. 77. A good for which the
demand increases as income falls and decreases
as income rises.
Law of demand, p. 75. The rule that states that,
holding everything else constant, when the price
of a product falls, the quantity demanded of
Market demand, p. 74. The demand by all the
consumers of a given good or service.
Market equilibrium, p. 86. A situation in
which quantity demanded equals quantity
supplied.
Quantity demanded, p. 74. The amount of a
good or service that a consumer is willing and
able to purchase at a given price.
Substitutes, p. 77. Goods and services that can
be used for the same purpose.
Substitution effect, p. 75. The change in the
quantity demanded of a good that results from a
change in price, making the good more or less
expensive relative to other goods that are
Surplus, p. 87. A situation in which the quantity
supplied is greater than the quantity demanded.
Technological change, p. 84. A positive or
negative change in the ability of a firm to
produce a given level of output with a given
quantity of inputs.
46 CHAPTER 3 | Where Prices Come From: The Interaction of Demand and Supply
Chapter Outline
How Smart Is Your Watch?
By 2013, several firms began selling “smartwatches” that enabled users to make phone calls, text, take
photos or videos, monitor their heart rates, and calculate calories burned while exercising. In 2015, Apple
3.1
The Demand Side of the Market (pages 74–82)
Learning Objective: List and describe the variables that influence demand.
A perfectly competitive market is a market that meets the conditions of (1) many buyers and sellers,
(2) all firms selling identical products, and (3) no barriers to new firms entering the market.
The main factor in most consumer decisions is the price of the product. When we discuss demand, we are
considering not what a consumer wants to buy, but what a consumer is willing and able to buy.
A. Demand Schedules and Demand Curves
A demand schedule is a table that shows the relationship between the price of a product and the quantity
B. The Law of Demand
The law of demand is a rule that states that, holding everything else constant, when the price of a product
falls, the quantity demanded of the product will increase, and when the price of a product rises, the
quantity demanded of the product will decrease. The law of demand holds for any market demand curve.
C. What Explains the Law of Demand?
The law of demand is explained by the substitution and income effects of a change in price. The
D. Holding Everything Else Constant: The Ceteris Paribus Condition
The ceteris paribus (“all else equal”) condition is the requirement that when analyzing the relationship
CHAPTER 3 | Where Prices Come From: The Interaction of Demand and Supply 47
E. Variables That Shift Market Demand
Other than price, the five most important variables that affect demand are: income, prices of related
goods, tastes, population and demographics, and expected future prices. The income that consumers have
to spend affects consumers’ willingness and ability to buy a good. A normal good is a good for which the
demand increases as income rises and decreases as income falls. An inferior good is a good for which the
Demographics refer to the characteristics of a population with respect to age, race, and gender. As the
demographics of a country or region change, the demand for particular goods will increase or decrease
because different categories of people tend to have different preferences for those goods. Expected future
F. A Change in Demand versus a Change in Quantity Demanded
A change in demand refers to a shift in the demand curve. A shift will occur if there is a change in one of
the variables, other than the price of the product, that affects the willingness of consumers to buy the
product. A change in quantity demanded refers to a movement along the demand curve as a result of a
change in the product’s price.
Teaching Tips
There is no magic formula for making students understand the difference between a change in quantity
48 CHAPTER 3 | Where Prices Come From: The Interaction of Demand and Supply
Extra Solved Problem 3.1
Welcome to the Capital One Buffalo Wild Wings Citrus Bowl
For many years, corporations purchased advertising time during college football bowl games to promote
their products. During the latter part of the twentieth century, a new form of sponsorship emerged, as
corporations purchased naming rights to most of these bowl games. The Sugar Bowl, Orange Bowl, and
Fiesta Bowl are now known as the Allstate Sugar Bowl, the Capital One Orange Bowl (Capital One
Solving the Problem
Step 1: Review the chapter material.
This problem refers to a variable that shifts a market demand curve, so you may want to review
the section “Variables That Shift Market Demand,” which begins on page 76 in the textbook.
Step 2: How does corporate sponsorship affect the demand for the sponsor’s product?
Consumers can be influenced by an advertising campaign to buy a sponsor’s product.
Step 3: Why have so many companies purchased naming rights rather than purchase time
to broadcast commercials during football bowl games?
Cable and satellite television offer consumers many more programming choices than were
available to viewers in the 1950s and 1960s. Remote controls are now included with all new
Extra Making
the
Connection
Are Quiznos Sandwiches Normal Goods and Subway
Sandwiches Inferior Goods?
In recent years, as American families juggle busy schedules, they have increasingly relied on eating out
rather than preparing meals at home. According to a survey by Restaurants and Institutions magazine,
CHAPTER 3 | Where Prices Come From: The Interaction of Demand and Supply 49
Does this behavior change during a recession? We might expect that it would because recessions result in
declining incomes, as some people lose their jobs and others are forced to work fewer hours or have their
wages reduced. Dining out is more expensive than preparing meals at home, so one way to save during a
recession is to cut back on restaurant meals. In fact, during the 2007–2009 recession, many restaurants
had a difficult time. Particularly hard hit were “casual dining” restaurants that provide table service and
serve moderately priced food. Among other restaurants, Ruby Tuesday, Olive Garden, Red Lobster, and
LongHorn Steakhouse all experienced declining demand, while Bennigan’s and Steak and Ale filed for
bankruptcy.
Question
A student makes the following argument:
The chapter says that for consumers as a group, Quiznos sandwiches are normal goods, and
Subway sandwiches are inferior goods. But I like the taste of Subway sandwiches better than I
like the taste of Quiznos sandwiches, so for me Quiznos sandwiches are inferior goods, and
Subway sandwiches are normal goods.
Do you agree with the student’s reasoning? Briefly explain.
Answer
You should disagree with the reasoning. Inferior and normal goods are not about quality or taste, but
3.2
The Supply Side of the Market (pages 82–86)
Learning Objective: List and Describe the variables that influence supply.
The most important of the variables that influence the willingness and ability of firms to sell a good or
service is price. Quantity supplied is the amount of a good or service that a firm is willing and able to
supply at a given price. Holding other variables constant, when the price of a good rises, producing the
50 CHAPTER 3 | Where Prices Come From: The Interaction of Demand and Supply
A. Supply Schedules and Supply Curves
A supply schedule is a table that shows the relationship between the price of a product and the quantity
B. The Law of Supply
The law of supply is the rule that states that, holding everything else constant, increases in price cause
increases in the quantity supplied, and decreases in price cause decreases in the quantity supplied. If only
C. Variables That Shift Market Supply
The most important variables that shift market supply are: prices of inputs, technological change, prices
of related goods in production, the number of firms in the market, and expected future prices. The factor
most likely to cause a supply curve to shift is a change in the price of an input. If the price of an input
rises, the supply curve will shift to the left. If the price of an input declines, the supply curve will shift to
D. A Change in Supply versus a Change in Quantity Supplied
A change in supply refers to a shift in the supply curve. The supply curve will shift when there is a change
in one of the variables, other than the price of the product, that affects the willingness of suppliers to sell
the product. A change in quantity supplied refers to a movement along the supply curve as a result of a
change in the product’s price.
Teaching Tips
Be careful not to refer to an increase in supply as “a downward shift” or a decrease in supply as “an
upward shift.” An increase in supply should be referred to as a “shift to the right.” Because demand
CHAPTER 3 | Where Prices Come From: The Interaction of Demand and Supply 51
3.3
Market Equilibrium: Putting Demand and Supply Together (pages 86–89)
Learning Objective: Use a graph to illustrate market equilibrium.
The purpose of markets is to bring buyers and sellers together. The interaction of buyers and sellers in
markets results in firms producing goods and services most desired by consumers. Market equilibrium
is a situation in which quantity demanded equals quantity supplied. A competitive market equilibrium
is a market equilibrium with many buyers and sellers.
A. How Markets Eliminate Surpluses and Shortages
A surplus is a situation in which the quantity supplied is greater than the quantity demanded. When there
is a surplus, firms have unsold goods piling up, which gives them an incentive to increase their sales by
cutting the price. Cutting the price simultaneously increases the quantity demanded and decreases the
B. Demand and Supply Both Count
Neither consumers nor firms can dictate what the equilibrium price will be. No firm can sell anything at
any price unless it can find a willing buyer, and no consumer can buy anything at any price without
finding a willing seller.
3.4
The Effect of Demand and Supply Shifts on Equilibrium (pages 90–97)
Learning Objective: Use demand and supply graphs to predict changes in prices and
quantities.
A. The Effect of Shifts in Supply on Equilibrium
When the market supply curve shifts to the right, there will be a surplus at the original equilibrium price.
B. The Effect of Shifts in Demand on Equilibrium
For a normal good, an increase in income will shift the market demand curve to the right, causing a shortage
C. The Effect of Shifts in Demand and Supply over Time
If both the demand and supply curves increase, whether the equilibrium price in a market rises or falls
52 CHAPTER 3 | Where Prices Come From: The Interaction of Demand and Supply
D. Shifts in a Curve versus Movements along a Curve
When a shift in a demand curve or a supply curve causes a change in equilibrium price, the change in
price does not cause a further change in demand or supply.
Teaching Tips
Extra Solved Problem 3.4
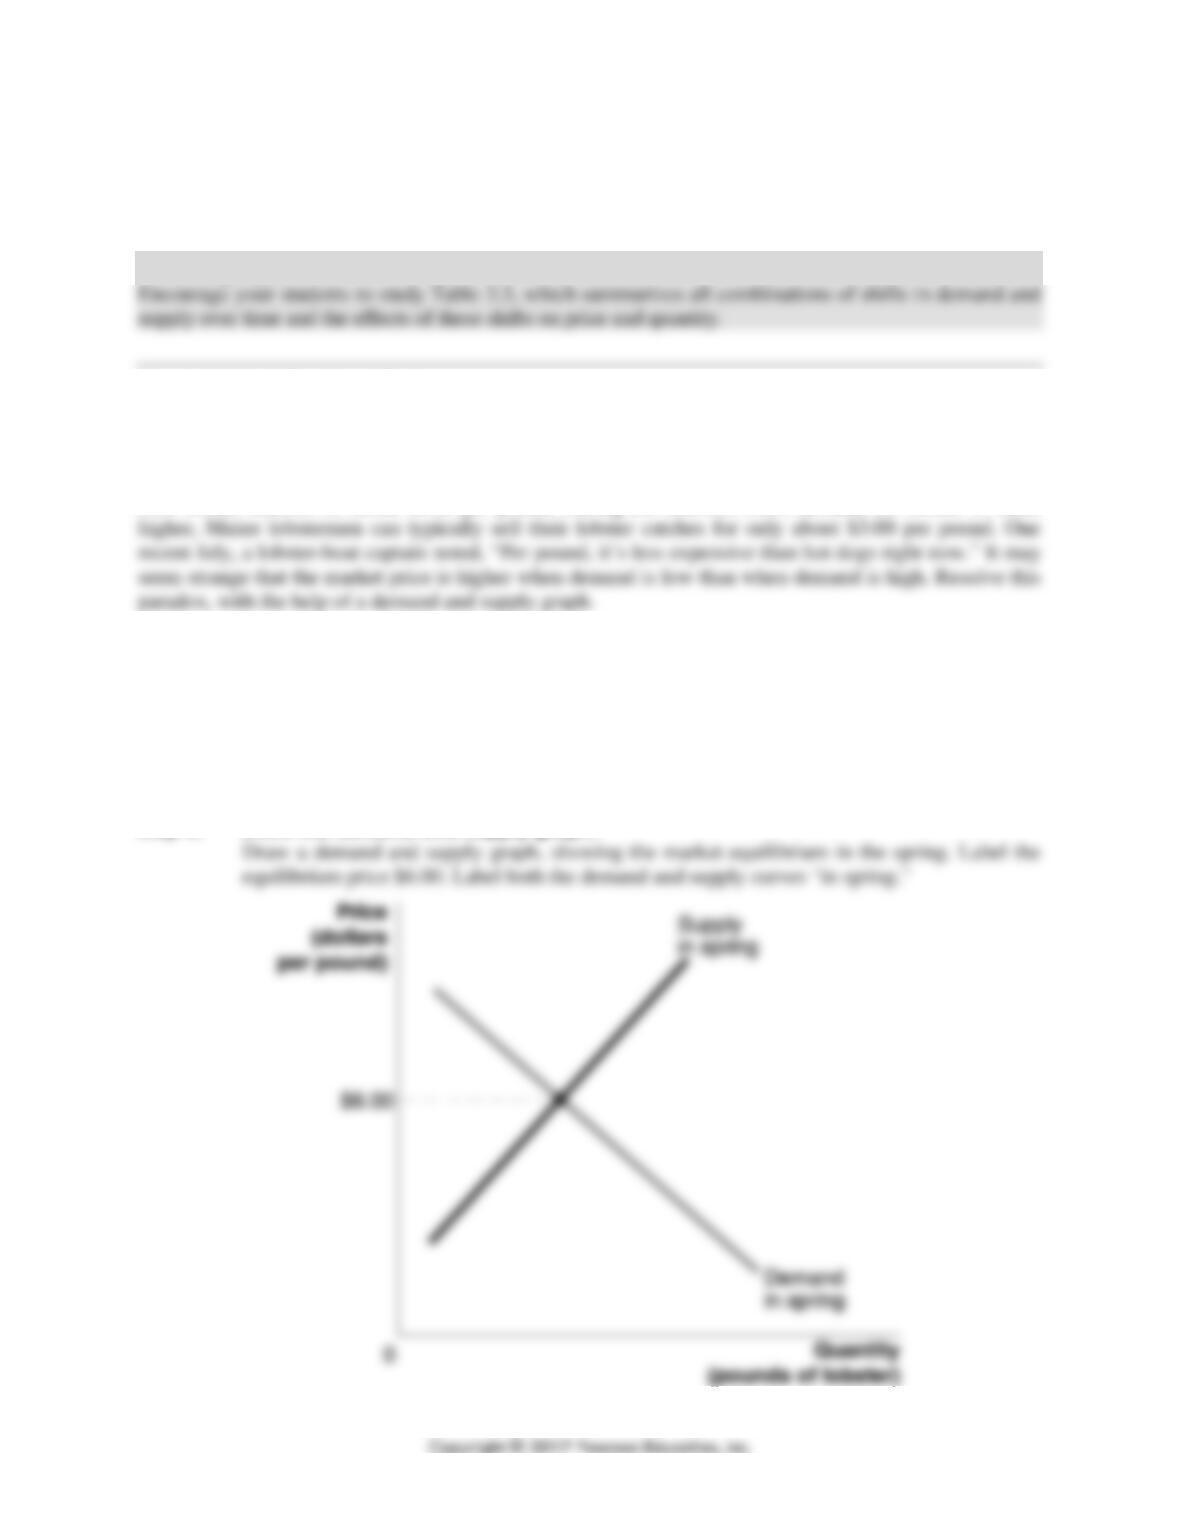
High Demand and Low Prices in the Lobster Market?
During a typical spring, when demand for lobster is relatively low, Maine lobstermen can typically sell
their lobster catches for about $6.00 per pound. During the summer, when demand for lobster is much
Solving the Problem
Step 1: Review the chapter material.
This problem is about how shifts in demand and supply curves affect the equilibrium price, so
you may want to review the section “The Effect of Shifts in Demand and Supply over Time,”
which begins on page 90.
Step 2: Draw the demand and supply graph.
CHAPTER 3 | Where Prices Come From: The Interaction of Demand and Supply 53
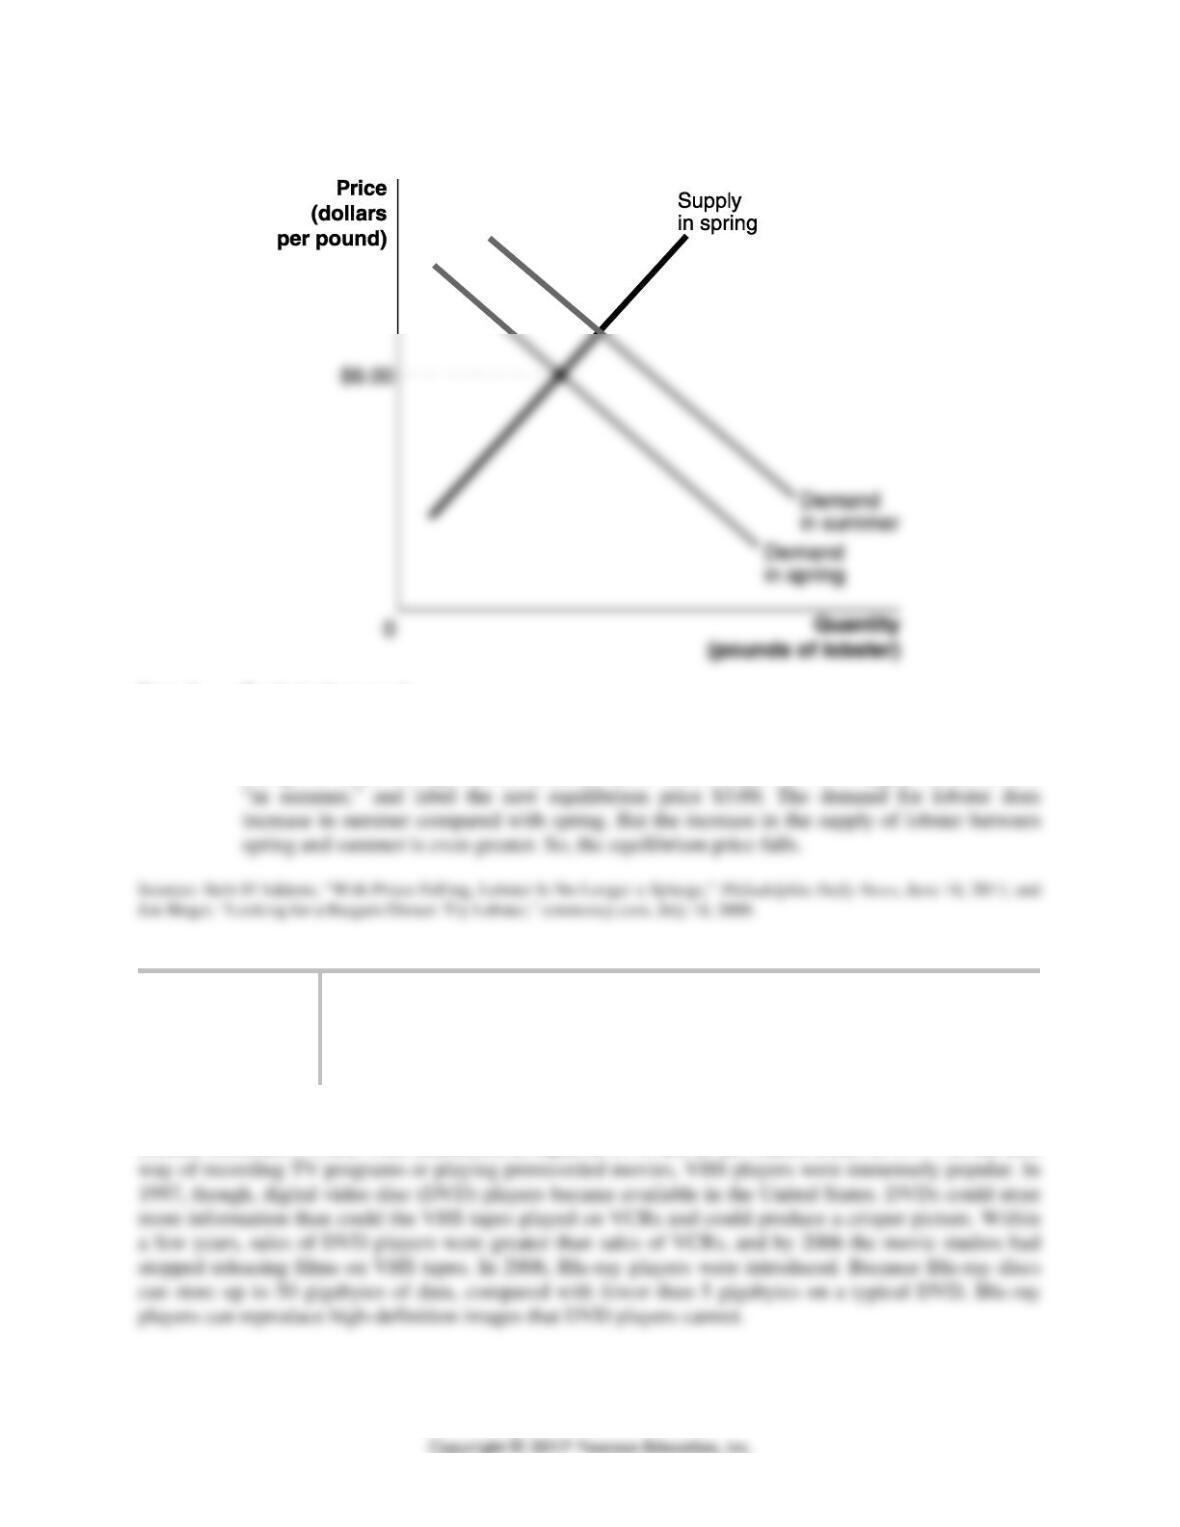
Step 3: Add to your graph a demand curve for summer.
Step 4: Explain the graph.
After studying the graph, it is possible to see how the equilibrium price can fall from $6.00 to
$3.00, despite the increase in demand: The supply curve must have shifted to the right by
enough to cause the equilibrium price to fall to $3.00. Draw the new supply curve, label it
Extra Making
the
Connection
The Falling Price of Blu-ray Players
The technology for playing prerecorded movies has progressed rapidly during the past 30 years. Video
cassette recorders (VCRs) were introduced in Japan in 1976 and in the United States in 1977. As the first
54 CHAPTER 3 | Where Prices Come From: The Interaction of Demand and Supply
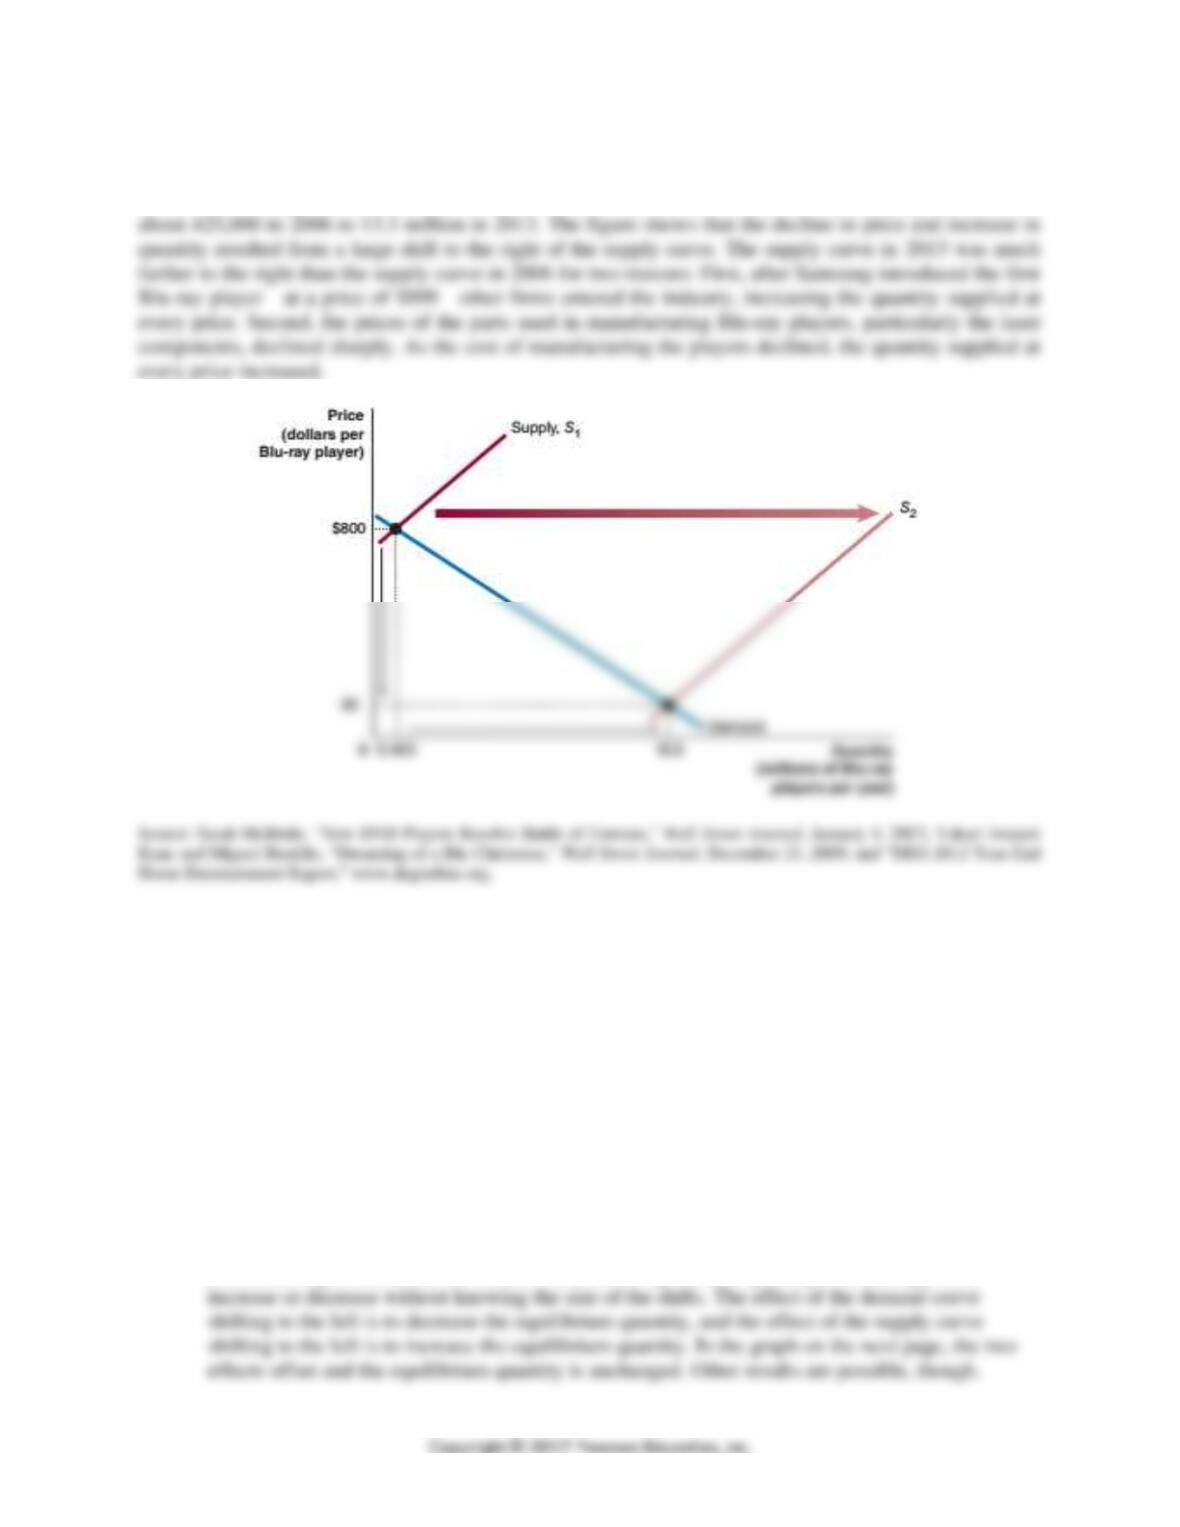
When firms began selling VCRs, DVD players, and Blu-ray players, they initially charged high prices
that declined rapidly within a few years. As this figure shows, the average price of a Blu-ray player was
about $800 in May 2006, but it had declined to about $95 in 2013. Sales of Blu-ray players rose from
Questions
More than half of homes in the United States are heated by burning natural gas. According to an article in
the Wall Street Journal, demand for natural gas decreased during the winter of 2012 because of unusually
warm weather. At the same time, “robust production [of natural gas] from U.S. shale fields has created
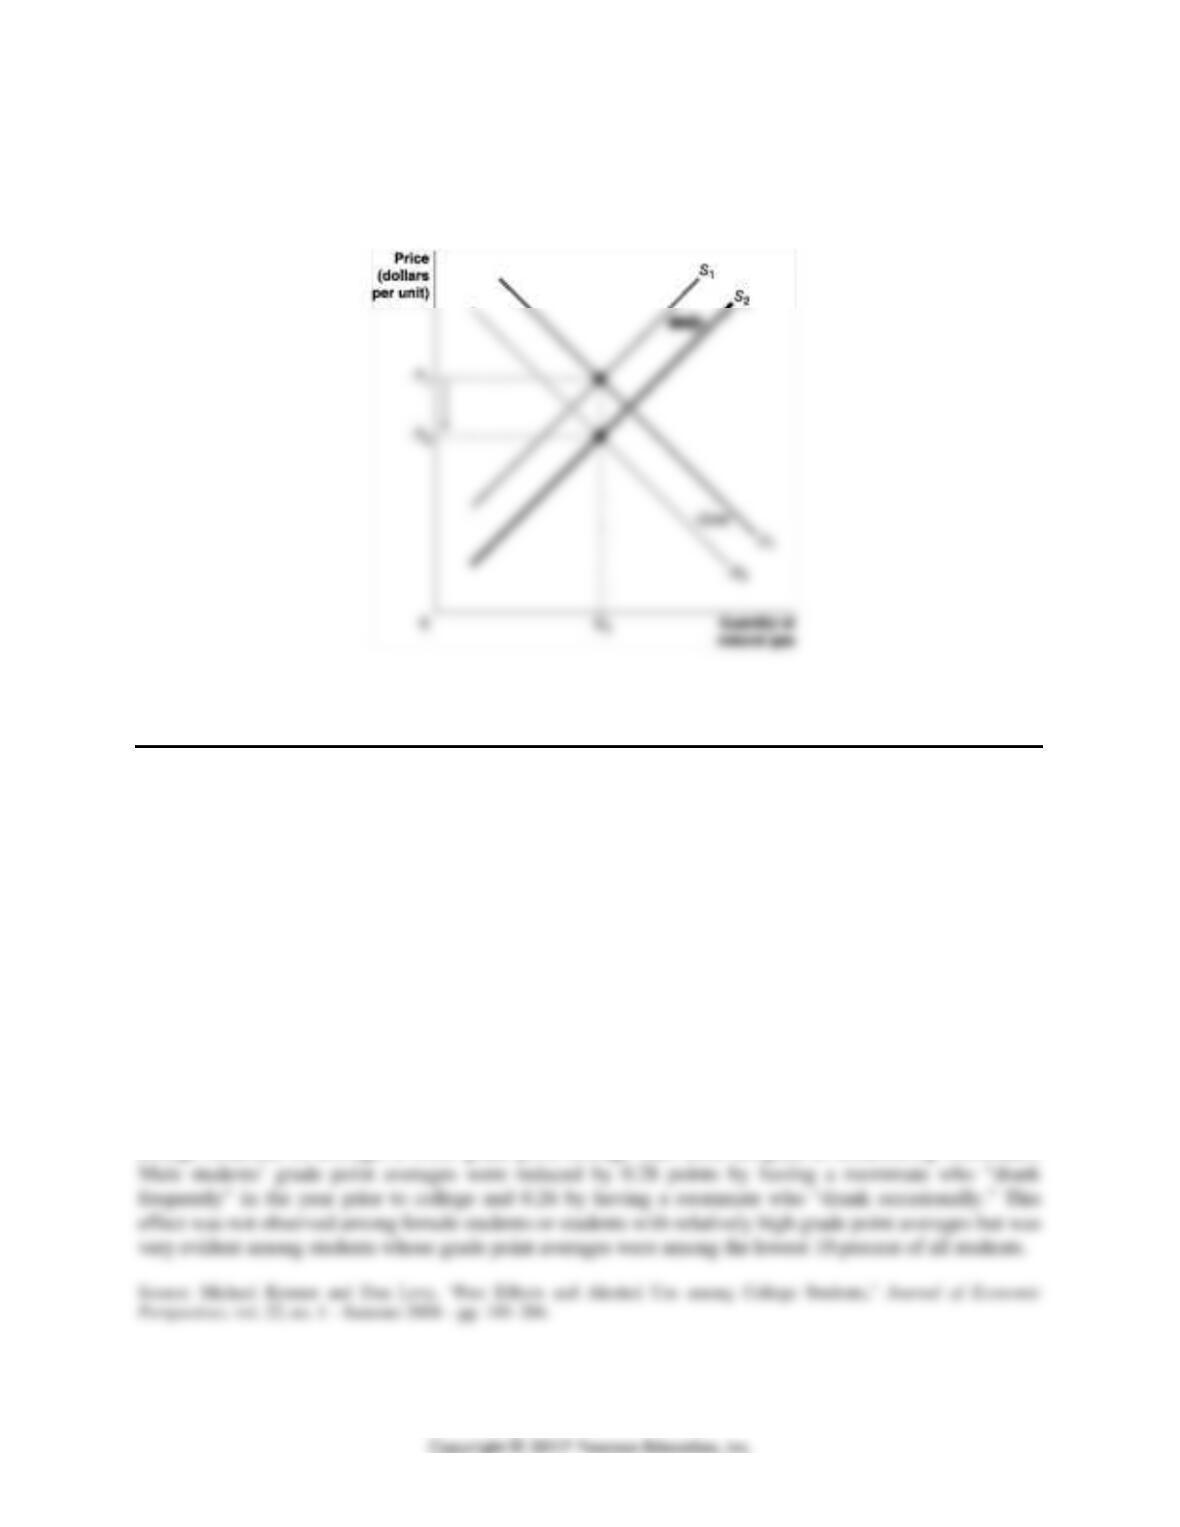
record supplies.” Use demand and supply graphs to illustrate your answers to the following questions:
a. Can we use this information to be certain whether the equilibrium quantity of natural gas
increased or decreased?
b. Can we use this information to be certain whether the equilibrium price of natural gas increased
or decreased?
Source: Christian Berthelsen, “Natural-Gas Futures Slide,” Wall Street Journal, January 11, 2012.
Answers
a. The demand curve for natural gas will shift to the left and the supply curve for natural gas will
shift to the right. We cannot be certain whether the equilibrium quantity of natural gas will
CHAPTER 3 | Where Prices Come From: The Interaction of Demand and Supply 55
b. Yes, we know with certainty that the equilibrium price of natural gas will decrease. Both the
demand curve shifting to the left and the supply curve shifting to the right will contribute to
causing a decrease in the equilibrium price of natural gas.
Extra Economics in Your Life
In addition to advertising campaigns, consumer tastes can be affected in other ways, including through the
behavior of peers. Several economists have studied how the behavior of college students affects a special
group of peers: their roommates. One study examined data from a large state university that uses a lottery
system to assign dormitory roommates for some of its incoming freshman. The 1,357 students who used
the lottery system did not request a specific roommate nor did they request special housing. The study
found no evidence that one roommate’s family background (measured by parental income and education)
or academic background (measured by high school grade point average and admission test scores)
affected his or her roommate’s grade point average at the end of the freshman or sophomore years. But
there was evidence that another measure of student behavior had a negative effect on the grade point
average of roommates.
Question: What type of behavior by students would have a negative impact on the grade point average of
their roommates?
Answer: The study found that males who were assigned roommates who drank alcohol prior to attending
college obtained, on average, a lower grade point average than those assigned to nondrinking roommates.
56 CHAPTER 3 | Where Prices Come From: The Interaction of Demand and Supply
Solutions to End-of-Chapter Exercises
Answers to Thinking Critically Questions
1. A technological change that results in a lower cost of producing smart shirts will shift the supply
curve for smart shirts, but not the demand curve. The supply curve for smart shirts will shift to the
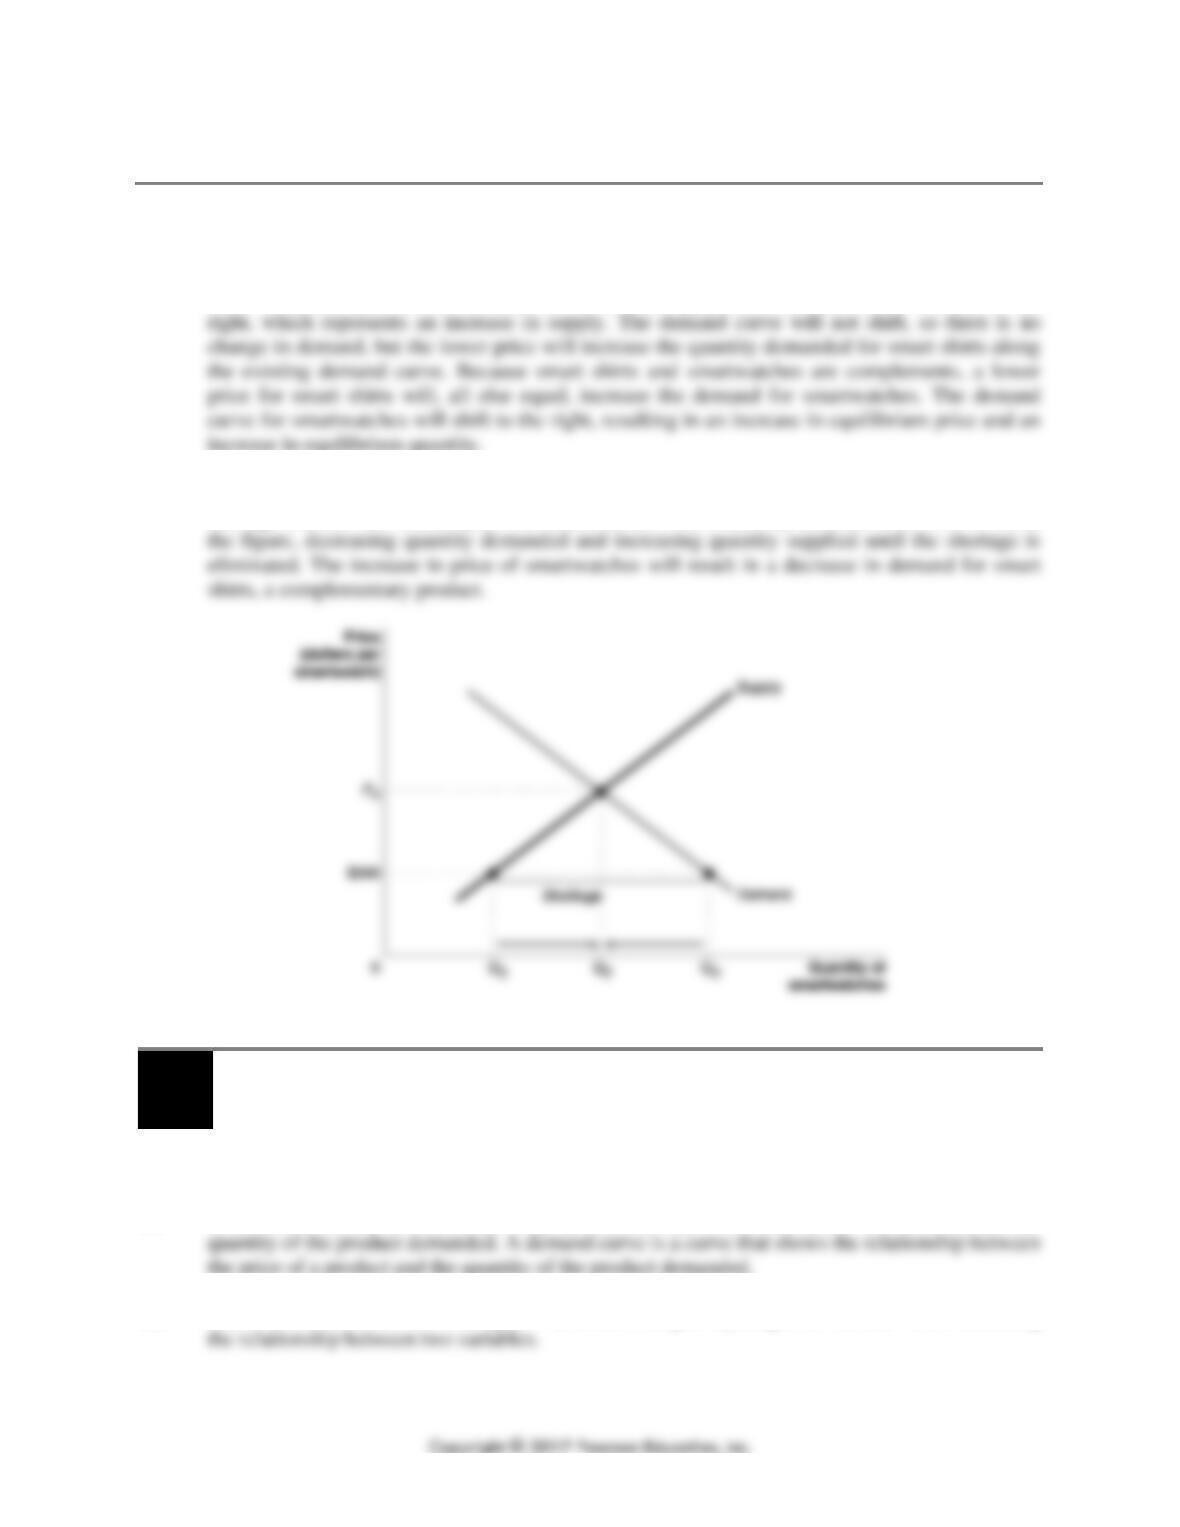
2. In April 2015, the quantity demanded of smartwatches exceeded the quantity supplied, so a
shortage existed. The market price for smartwatches will eventually increase from $349 to PE in
3.1
The Demand Side of the Market
Learning Objective: Discuss the variables that influence demand.
Review Questions
1.1 A demand schedule is a table showing the relationship between the price of a product and the
1.2 Ceteris paribus means “all else equal”—that is, holding everything else constant when examining
CHAPTER 3 | Where Prices Come From: The Interaction of Demand and Supply 57
1.3 A “change in demand” refers to a shift of the demand curve, while a “change in quantity
1.4 The law of demand states that, holding all else constant, when the price of a product falls, the
quantity demanded of the product will increase (and when the price of a product rises, the quantity
1.5 The main variables that will cause a demand curve to shift include: (1) changes in the prices of a
related good—substitutes or complements; (2) changes in income; (3) changes in tastes; (4)
changes in population or demographics; and (5) changes in expected future prices. An example of
substitute goods is Coke and Pepsi, and an example of complementary goods is hot dogs and hot
Problems and Applications
1.6 a. Substitutes
1.7 Because the graphic in the article showed increases in car and truck sales at the same time as
1.8 Assuming that smartphones and smartwatches are substitutes, a decline in smartphone prices,
holding other factors constant, will decrease the demand for smartwatches. Therefore, the demand
curve for smartwatches will shift to the left.
1.9 a. Because the price of a substitute good has declined, the demand curve for Big Macs will shift
to the left from D1 to D2.