Chapter 3
1. What are the three basic economic questions? How are decisions made differently in a market
economy than in planned economies?
Answer: The three basic economic questions are: What is to be produced? How are these
2. Recently the American Film Institute selected Citizen Kane as the best movie of all time. Citizen Kane
is a fictional psychological biography of one of the most powerful newspaper publishers in history, William
Randolph Hearst. Titanic, an epic romance about the sinking of the Titanic, has made the most money of
any film in history. Unlike Titanic, Citizen Kane was not a box office success. Do you think Hollywood will
make more movies like Titanic or like Citizen Kane? Why?
Answer: Hollywood will probably make more movies like Titanic because of consumer
have purchased more and more labor-saving home appliances like automatic washers and dryers,
dishwashers, and microwave ovens. Do you think these phenomena are related? Could higher wages
and better job opportunities lead to a more capital-intensive way of performing household chores?
Explain.
Answer: The relevant question here is how to produce household goods and services,
4. Identify where the appropriate entries go in the circular flow diagram.

5. Identify whether each of the following transactions takes place in the factor market or the product
market.
a. Billy buys a sofa from Home Time Furniture for his new home.
b. Home Time Furniture pays its manager her weekly salary.
d. After he pays all of his employees their wag
his profit.
Answer: a. Product market; b. factor market; c. product market; d. factor market.
6. Given the following production possibilities curve:
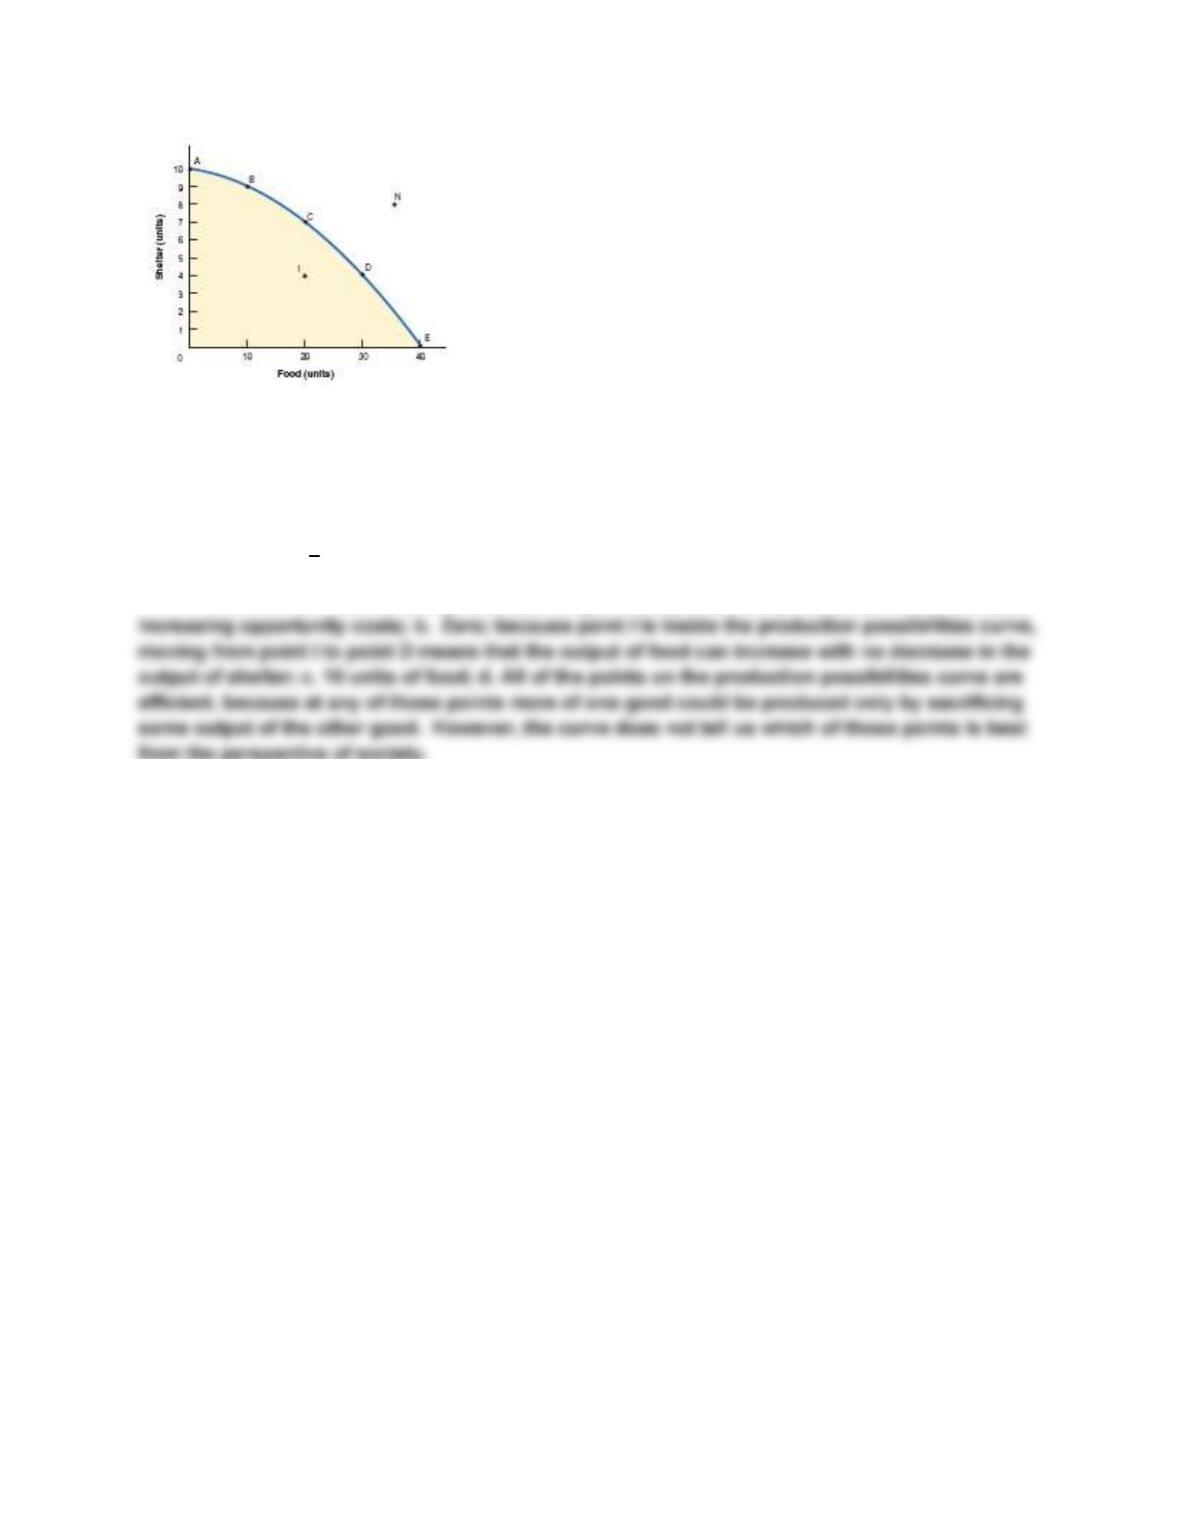
a. Does this production possibilities curve show increasing opportunity costs? Explain.
b. What is the opportunity cost of moving from point I to point D? Explain.
c. What is the opportunity cost of moving from point C to point B?
d. Which of points A E is the most efficient? Explain.
Answers: a. Yes; the bowed-outward shape of the production possibilities curve indicates
from the perspective of society.
7. During wartime, countries shift production from civilian goods, like automobiles and clothing, to military
goods, like tanks and military uniforms. When the United States entered World War I in April 1917, for
example, the federal government created the War Industries Board and charged it with determining
production priorities and converting plants to meet war needs. In the following year, automobile
production fell 43 percent as output of military vehicles soared. When the war ended, 19 months later, in
November 1918, the government cancelled $2.5 billion in military contracts and the nation resumed
normal production. Assuming that in 1917 the United States was at point A on the production possibilities
curves shown, show what happened between April 1917 and November 1918. Show what happened
once the war ended.
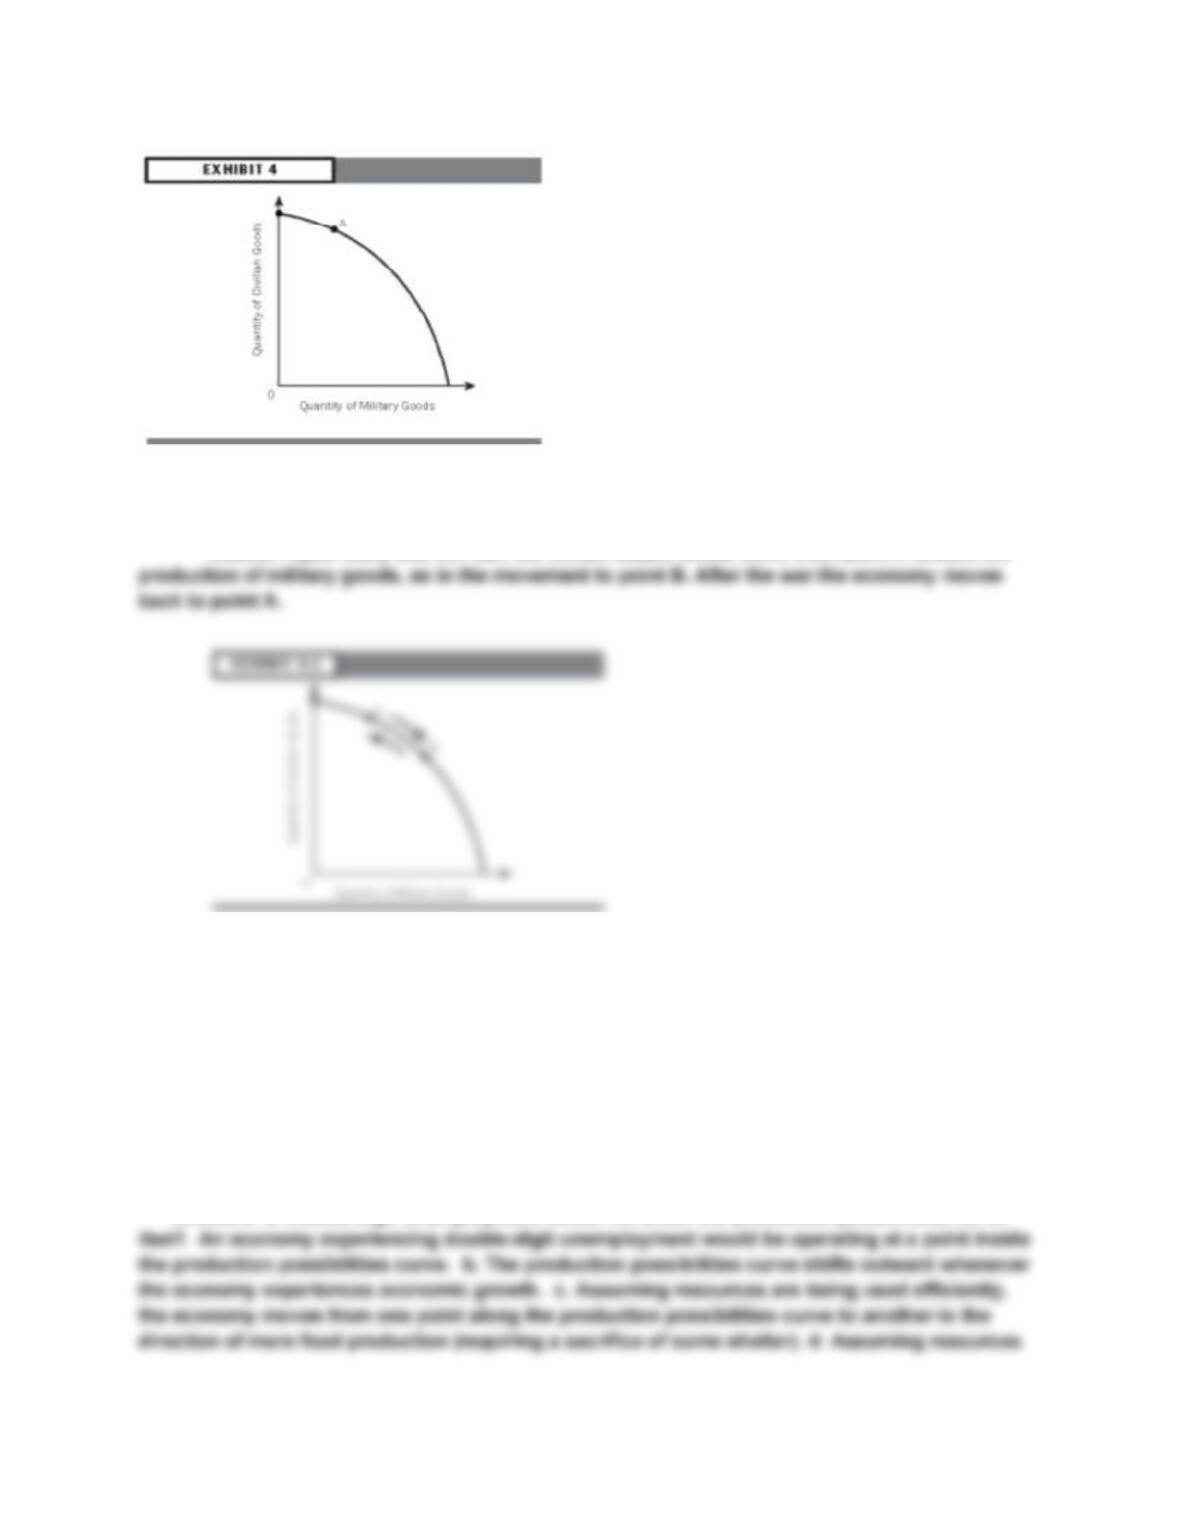
Answer: Upon entry into the war, the United States would move from point A toward the
8. How would the following events be shown using a production possibilities curve for shelter and food?
a. The economy is experiencing double-digit unemployment.
b. Economic growth is increasing at more than 5 percent per year.
c. Society decides it wants less shelter and more food.
d. Society decides it wants more shelter and less food.
Answers: a. Double digit unemployment would not affect the production possibilities curve
9. In A Bend in the River, Nobel prize winner V. S. Naipaul describes an underdeveloped country in
cause entrepreneurs to become demoralized and unresponsive to economic opportunities. Could this be
a case of idle or unemployed entrepreneurs? How can tax laws and rules governing property affect
Answer: People respond to incentives. If government policies do not provide proper
10. Using the following table, answer the questions:
a. What are the assumptions for a given production possibilities curve?
b. What is the opportunity cost of one gun when moving from point B to point C? When moving from point
D to point E?
c. Do these combinations demonstrate constant or increasing opportunity costs?
Answers: a. A production possibilities curve, which applies to a specific period of time, is
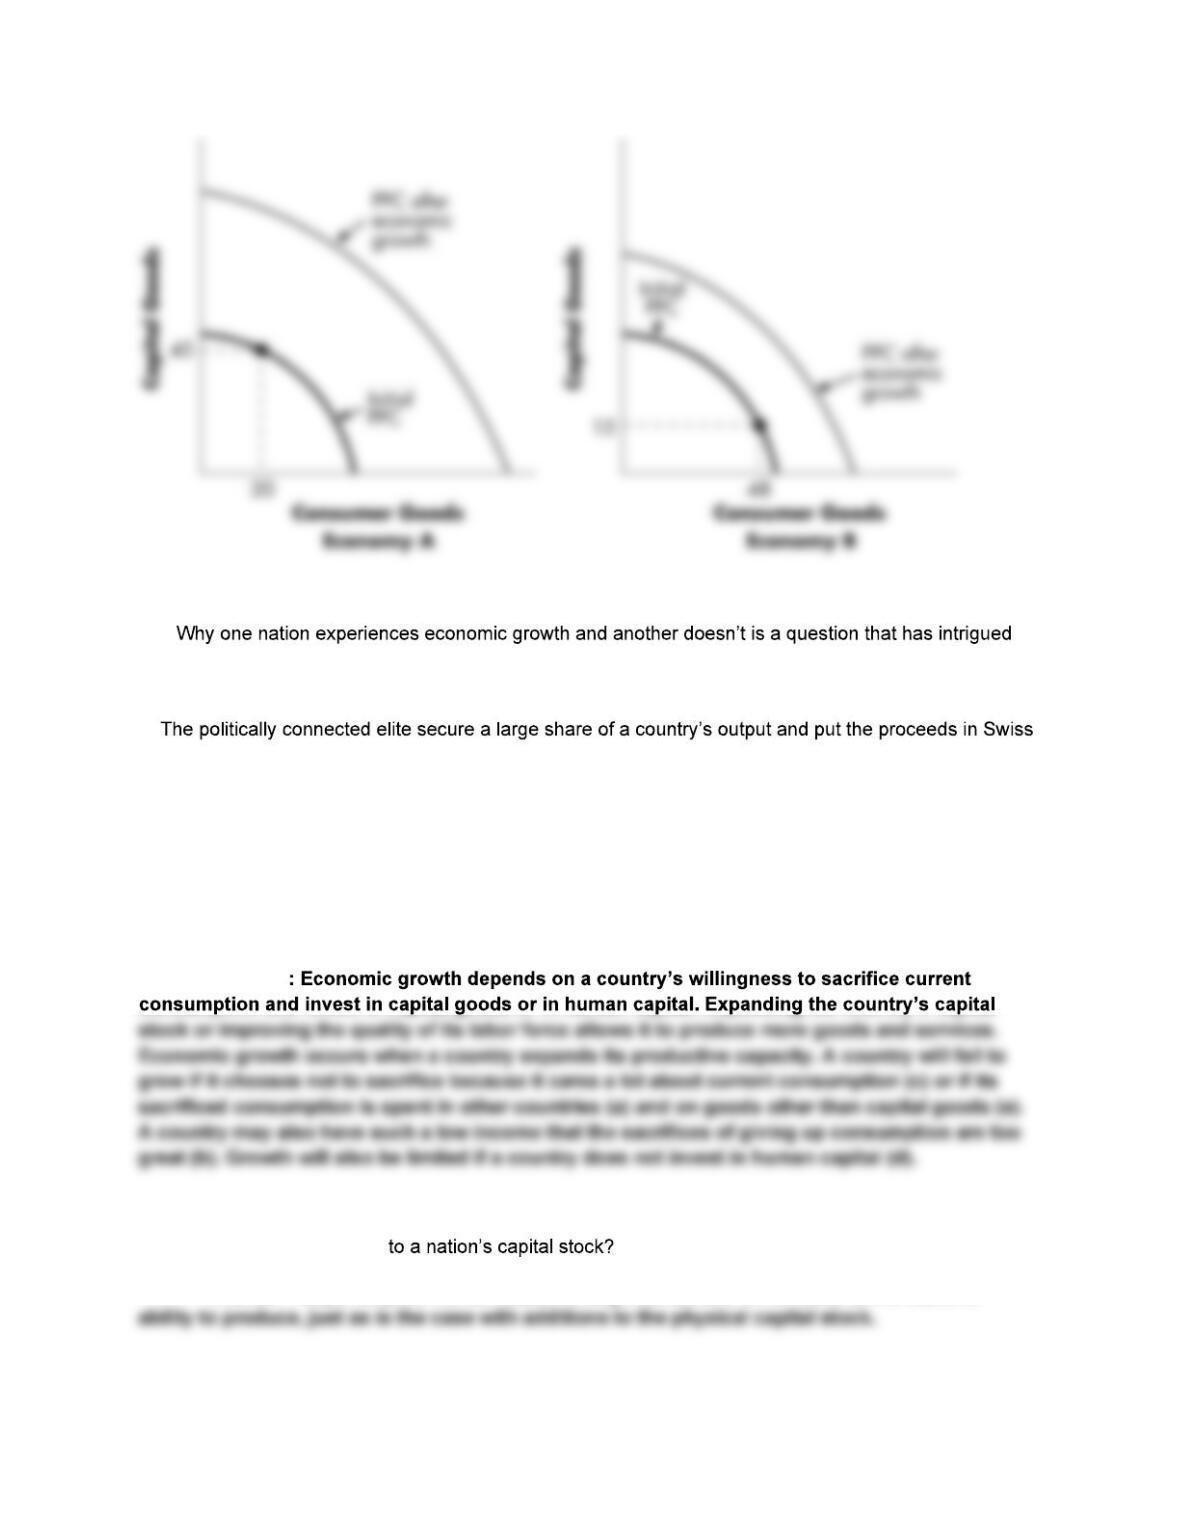
11. Economy A produces more capital goods and fewer consumer goods than Economy B. Which
economy will grow more rapidly? Draw two production possibilities curves, one for Economy A and one
for Economy B. Demonstrate graphically how one economy can grow more rapidly than the other.
Answer: Investment in capital goods increases the future productive potential of an
12.
economists since Adam Smith wrote An Inquiry into the Nature and Causes of the Wealth of Nations in
1776. Explain why each of the following would limit economic growth.
a.
banks.
b. A country has a very low output per person.
c. The national philosophy is live for the moment and forget about tomorrow.
d. The government closes all of the schools so more people will be available for work.
e. The country fears military invasion and spends half of its income on military goods.
Answers
13. How does education add
Answer: People acquire human capital though education, which adds to the nation’s

14. A politician running for president of the United States promises to build new schools and new space
stations during the next four years without sacrificing any other goods and services. Using a production
possibilities curve between schools and space stations, explain under what conditions the politician would
be able to keep his promise.
Answer: The politician would be able to keep his promise if the economy is currently