CHAPTER 3
(MACRO CHAPTER 3; MICRO CHAPTER 3)
Markets, Demand and Supply, and the Price
System
FUNDAMENTAL QUESTIONS
1. How do we decide who gets the scarce goods and services?
2. What is demand?
OVERVIEW AND OBJECTIVES
The primary purpose of this chapter is to develop the concepts of demand and supply and explain how
they combine to produce equilibrium prices and quantities.
After reading and reviewing this chapter, the student should be able to:
1. Describe a market system.
2. Explain how money facilitates the exchange process.
3. Distinguish between demand and quantity demanded and supply and quantity supplied.
7. Distinguish between a change in supply and a change in quantity supplied.
8. List factors that cause shifts in demand and supply curves.
Chapter 3: Markets, Demand and Supply, and the Price System 13
KEY TERM REVIEW
market
barter
double coincidence of wants
demand
normal goods
inferior goods
substitute goods
complementary goods
supply
quantity supplied
law of supply
LECTURE OUTLINE AND TEACHING STRATEGIES
I. How Do We Decide Who Gets the Scarce Goods and Resources?
An allocation system is the process of determining who gets the goods and services and who
doesn’t.
A. Fairness: Scarcity means that someone gets left out.
14 Chapter 3: Markets, Demand and Supply, and the Price System
C. The market process: Arbitrage: In a market system, buyers and sellers determine what is
II. Markets and Money
A. Barter and money exchanges: Barter is the exchange of goods and services directly without
III. Demand
A. The law of demand: The quantity of a well-defined good or service that people are willing
and able to purchase during a particular period of time decreases as the price of that good
rises, ceteris paribus.
B. The demand schedule: This is a list of the quantities of a good that consumers demand at
different prices, ceteris paribus.
Teaching Strategy: Try asking students who would purchase laptop computers at different
prices. Then, from their responses, generate a demand schedule.
D. From individual demand curves to a market curve: A market curve is the horizontal
summation of all individual demand curves.
E. Changes in demand and changes in quantity demanded: Compare a movement along a
demand curve to a shift in the entire curve. The determinants of demand are income, tastes,
prices of related goods, expectations, and number of buyers.
Teaching Strategy: Ask your students to redraw their demand curves after they receive
$1,000 in lottery winnings.
1. Income: Normal goods are goods that people buy more of when income increases.
Chapter 3: Markets, Demand and Supply, and the Price System 15
5. Number of buyers: The more individuals there are with income to spend, the greater
the market demand is likely to be.
IV. Supply
A. The law of supply: The quantity of a good or service that producers will sell is positively
related to price, ceteris paribus.
Teaching Strategy: Try focusing the law of supply around the profit motive of producers,
that is, rational self-interest (covered in Chapter 1).
B. The supply schedule and supply curve: The supply curve is composed of all the
Teaching Strategy: Try to show how higher wages obtained by the United Auto Workers
(UAW) will cause the supply curve for automobiles to shift to the left. Refer to Figure 10(a)
in the text.
1. Prices of resources: The higher cost of resources causes a decrease in supply.
2. Technology and productivity: More efficient use of resources shifts the supply curve
to the right.
V. Equilibrium: Putting Demand and Supply Together
A. Determination of equilibrium: Quantity demanded equals quantity supplied at a set price.
Teaching Strategy: Try polling your class in terms of demand for automobiles and then
draw the demand curve. Then draw a market supply curve; generate quantity demanded and
quantity supplied at different prices; and show surpluses, shortages, and equilibrium.
16 Chapter 3: Markets, Demand and Supply, and the Price System
Teaching Strategy: Demonstrate to your class how the size of a shortage from a price
ceiling and the size of the surplus from a price floor depend on the slopes of the supply and
demand curves.
1. Market interference: Price ceilings and price floors: Situations where the price is not
OPPORTUNITIES FOR DISCUSSION
1. Why does the demand curve slope down? Why does the supply curve slope up?
2. How do disequilibria appear in a market? How are disequilibria eliminated?
ANSWERS TO EXERCISES
1.
a. Demand curve shifts in.
2.
a. F. An increase in quantity demanded is represented by a move up the demand curve.
3.
Equilibrium price = $5
;
equilibrium quantity = 300
. At a price of $10, the quantity supplied is
Chapter 3: Markets, Demand and Supply, and the Price System 17
5. An effective price ceiling is one that is below equilibrium price. Thus, the price would have to be
fixed at some level below $5 to be an effective price ceiling. At an effective price ceiling, there
6. The price could change from minute to minute to ensure there are no lift lines. However, such a
7. The opportunity cost of using barter is higher than it is with currency. The use of currency would
reduce the cost of transaction.
8. California and Florida citrus are substitutes. Thus, as the quantity of California citrus declines, the
9. People who buy the Polo line are also buying the prestige that comes with it. The prestige rises as
the price rises. Thus, in our demand and supply curves, we would look at the Polo brand and the
10. No. The price of trees rises because the demand curve shifts out as the demand for trees rises.
13. In November 1992, it took 124 yen to purchase one dollar. Suppose that a bushel of oranges is
priced at $20 in the United States. The price in terms of yen is ¥2,480. The exchange rate between
the yen and the dollar means that ¥2,480 converts to $20 (
¥2,480 = $20 ¥124/$
). Suppose the
15. The desired combination depends on society’s preferences. The market defines where on the PPC
the society will locate. The PPC does not show which combination will be produced.
ANSWERS TO STUDY GUIDE HOMEWORK
1. Demand: as the price of a good increases, the quantity demanded decreases; as the price of a good
decreases, the quantity demanded increases.
18 Chapter 3: Markets, Demand and Supply, and the Price System
Supply: as the price of a good increases, the quantity supplied increases; as the price of a good
decreases, the quantity supplied decreases.
5.
a.
ACTIVE LEARNING EXERCISE
This exercise will explore the derivation of market demand using the class as the market of buyers for
soft drinks. Using the actual demand for two cans of soft drinks, you will be able to create a demand
schedule and a demand curve. Students should be able to see the relationship between demand and
supply and also discuss the concepts of shortages and surpluses.
1. How many will buy the soft drink at a price of 10 cents?
2. How many will buy the soft drink at a price of 50 cents?
S1
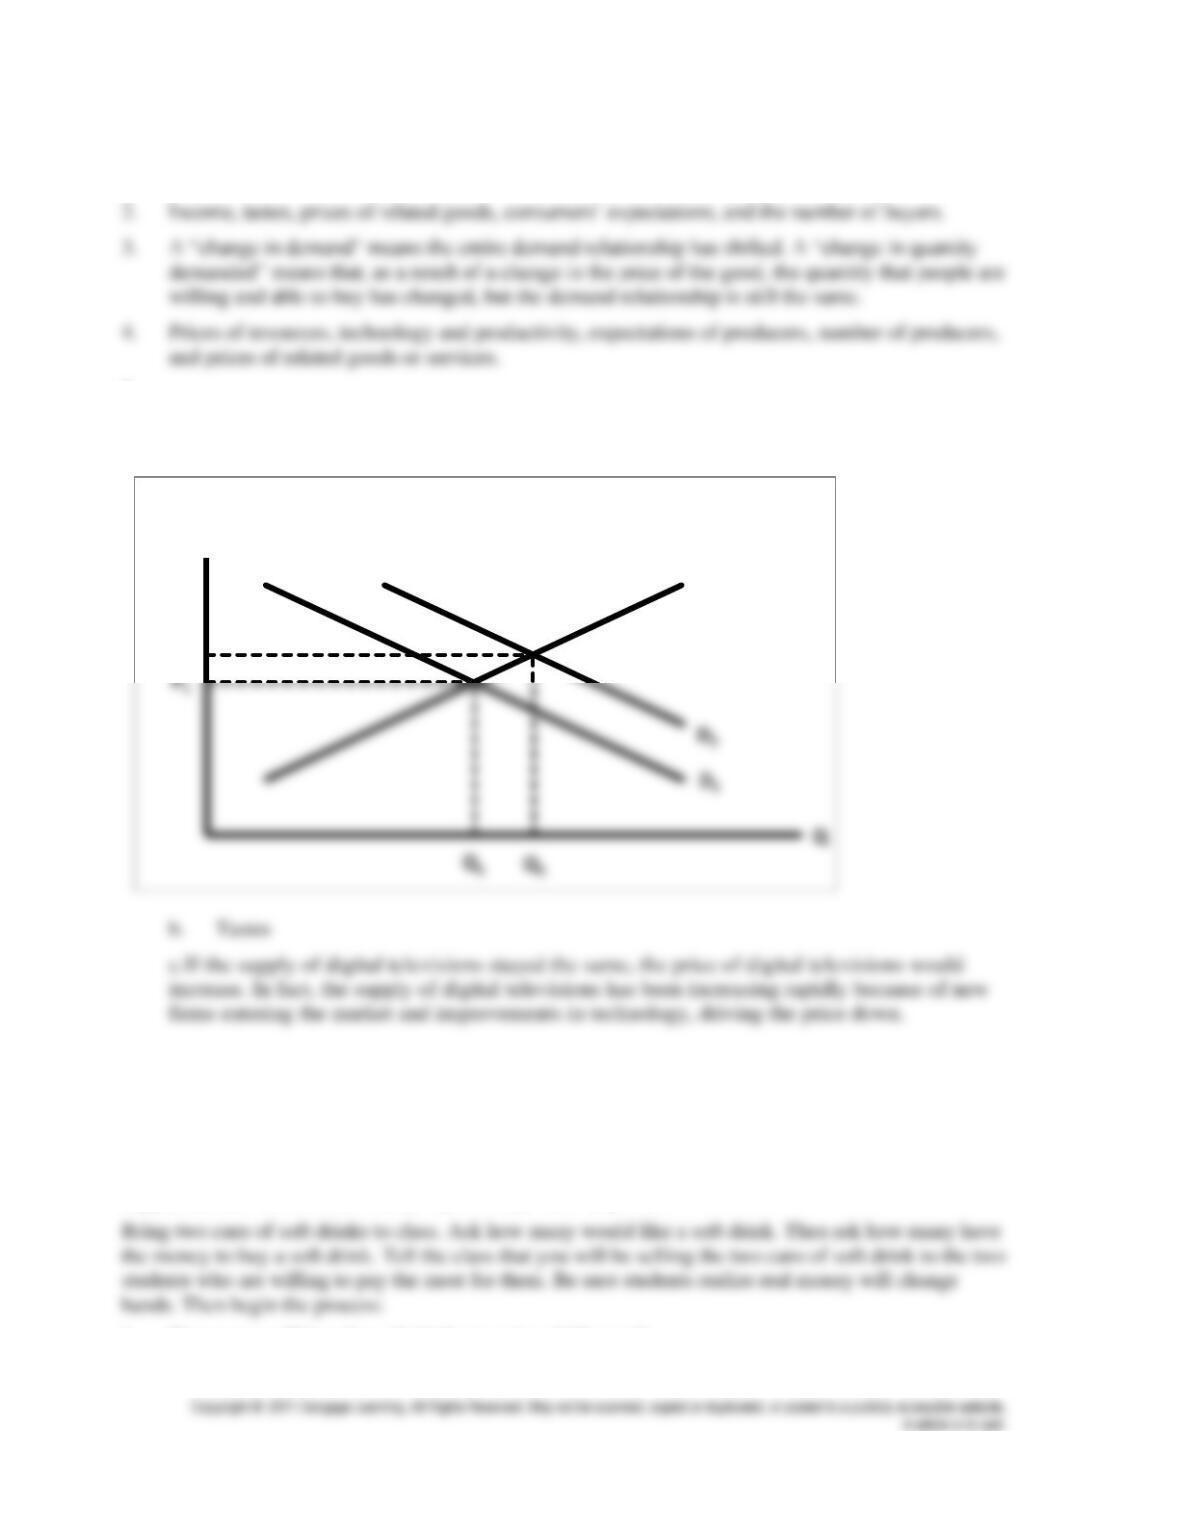
Market for Digital Televisions
P
P2
3. Etc.