
interactive activity
Chapter 3
Supply and Demand
1. A study conducted by Yahoo! revealed that chocolate is the most popular
flavor of ice cream in America. For each of the following, indicate the possible
effects on demand, supply, or both as well as equilibrium price and quantity
of chocolate ice cream.
a. A severe drought in the Midwest causes dairy farmers to reduce the number
of milk-producing cattle in their herds by a third. These dairy farmers supply
cream that is used to manufacture chocolate ice cream.
1. a. By reducing their herds, dairy farmers reduce the supply of cream, a leftward
shift of the supply curve for cream. As a result, the market price of cream
b. Consumers will now demand more chocolate ice cream at any given price,
represented by a rightward shift of the demand curve. As a result, both equi-
librium price and quantity rise.
c. The price of a substitute (vanilla ice cream) has fallen, leading consumers
to substitute it for chocolate ice cream. The demand for chocolate ice cream
2. In a supply and demand diagram, draw the shift of the demand curve for
hamburgers in your hometown due to the following events. In each case, show
the effect on equilibrium price and quantity.
Solution
S-30 Chapter 3 Supply and demand
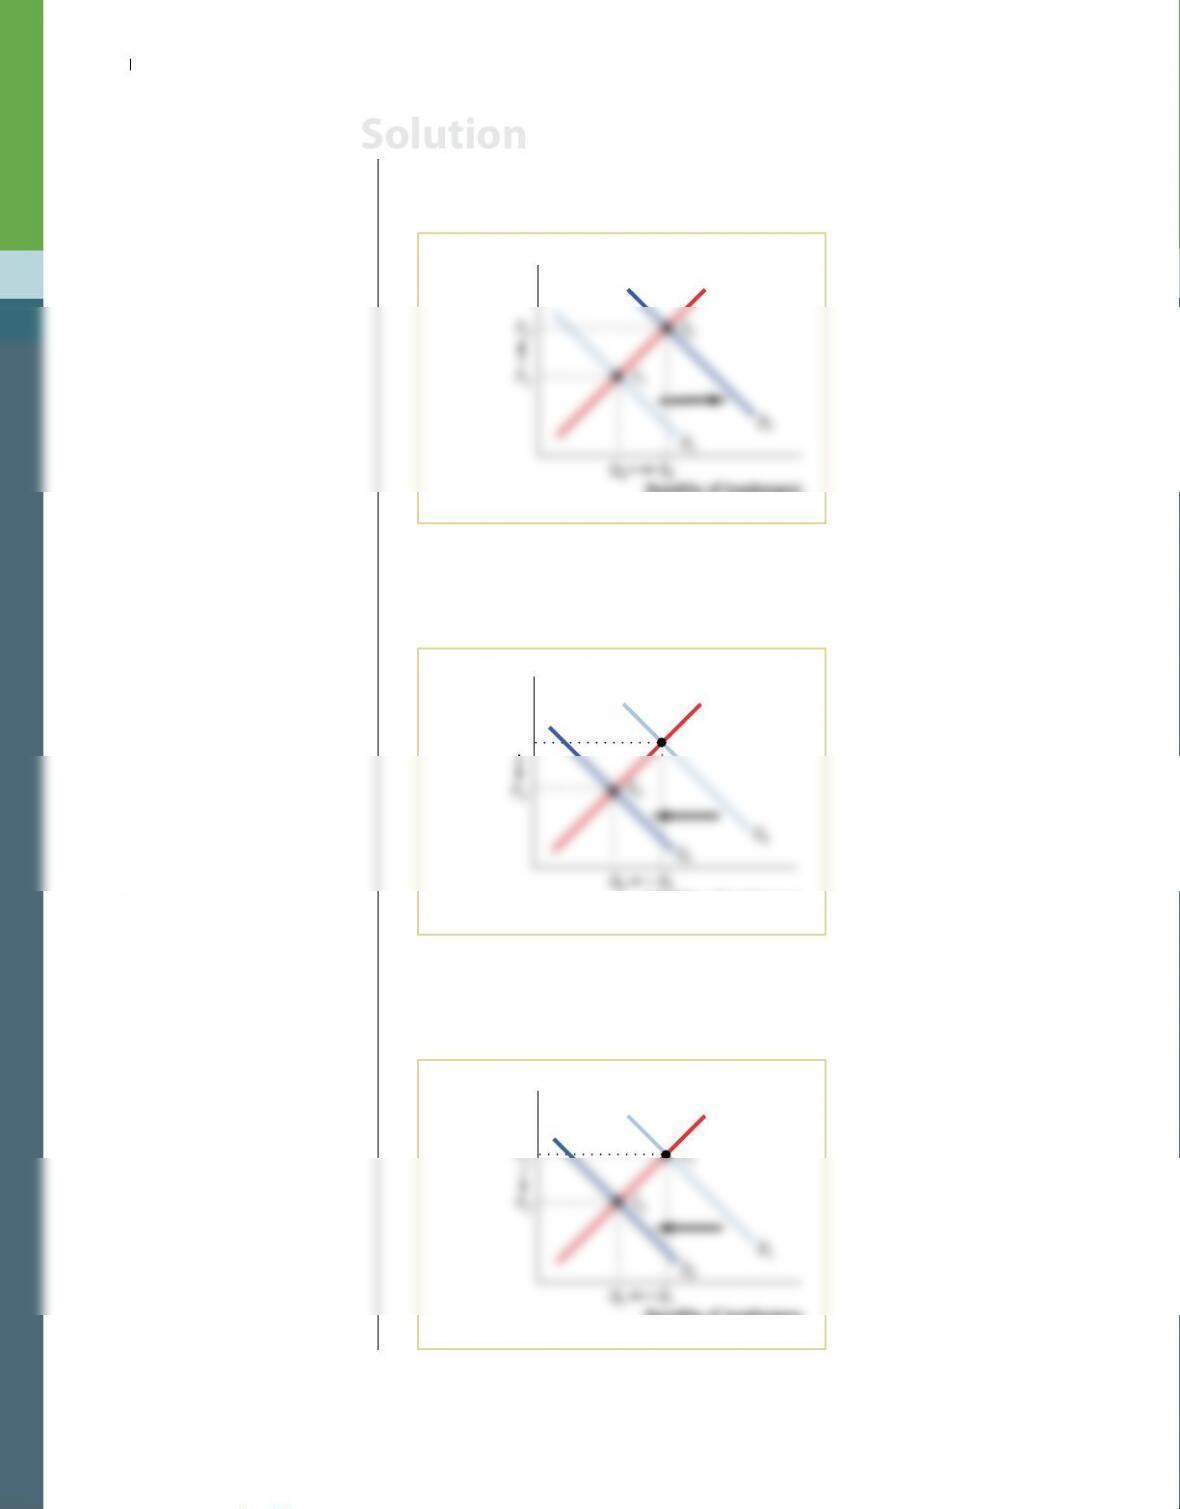
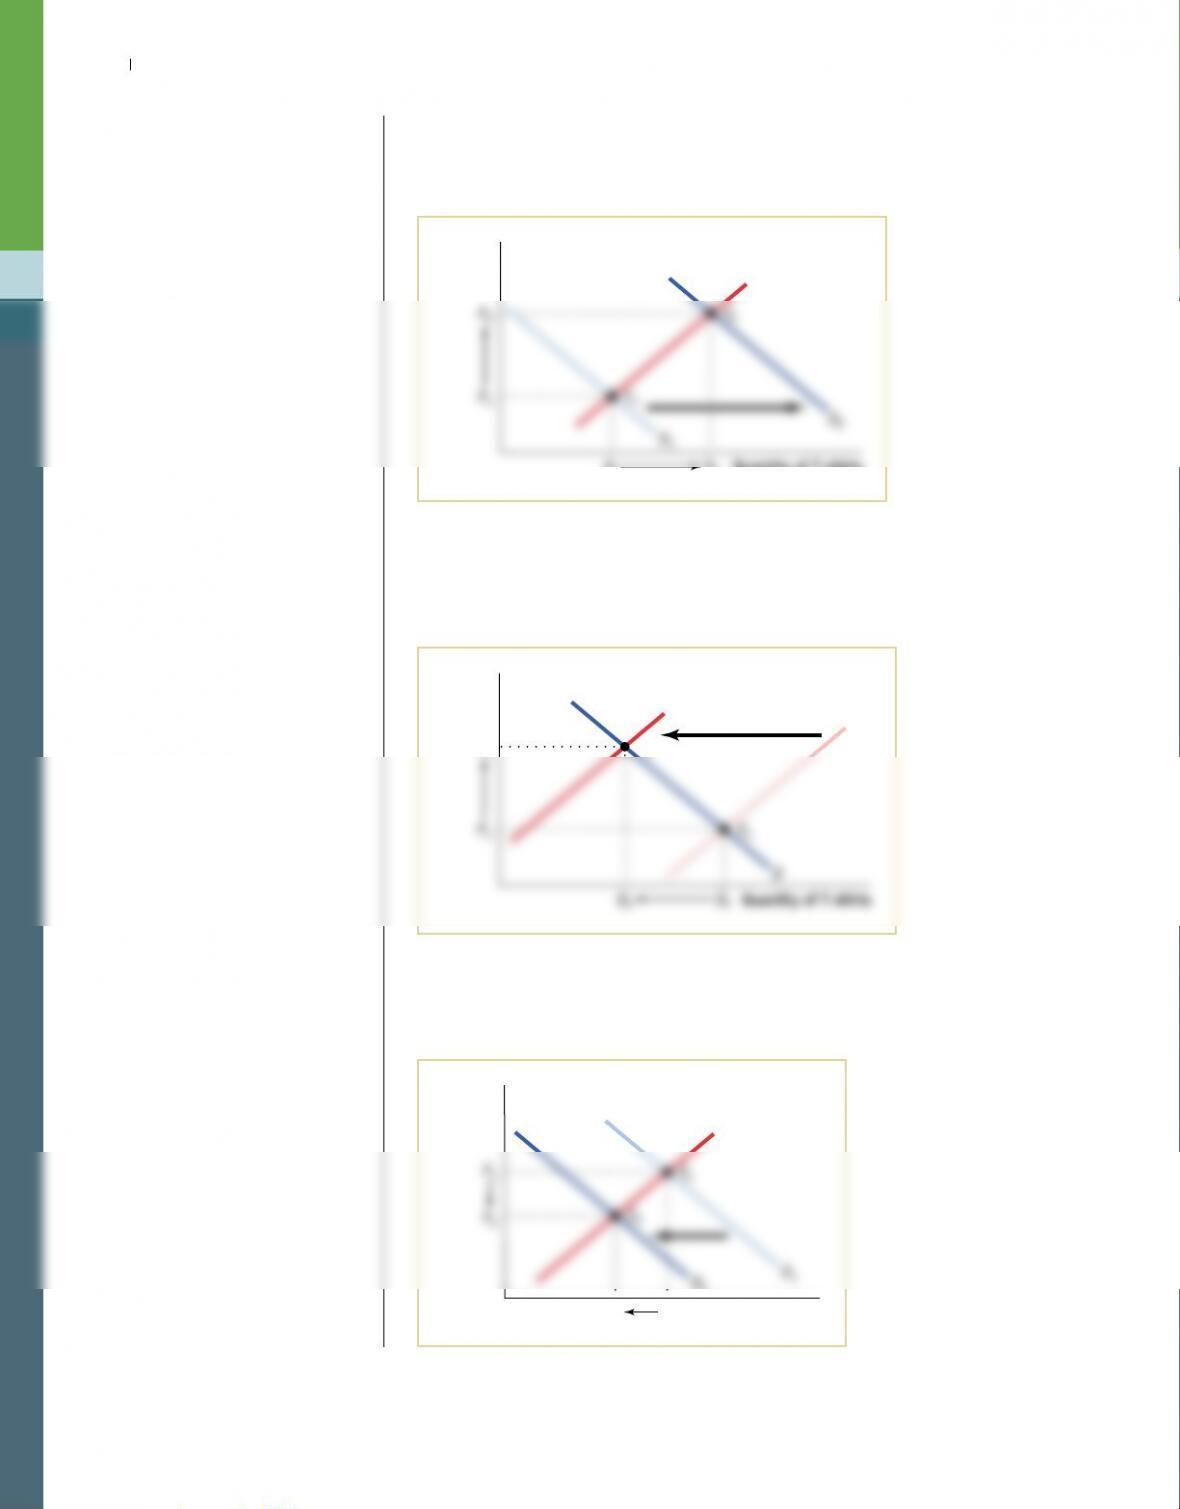
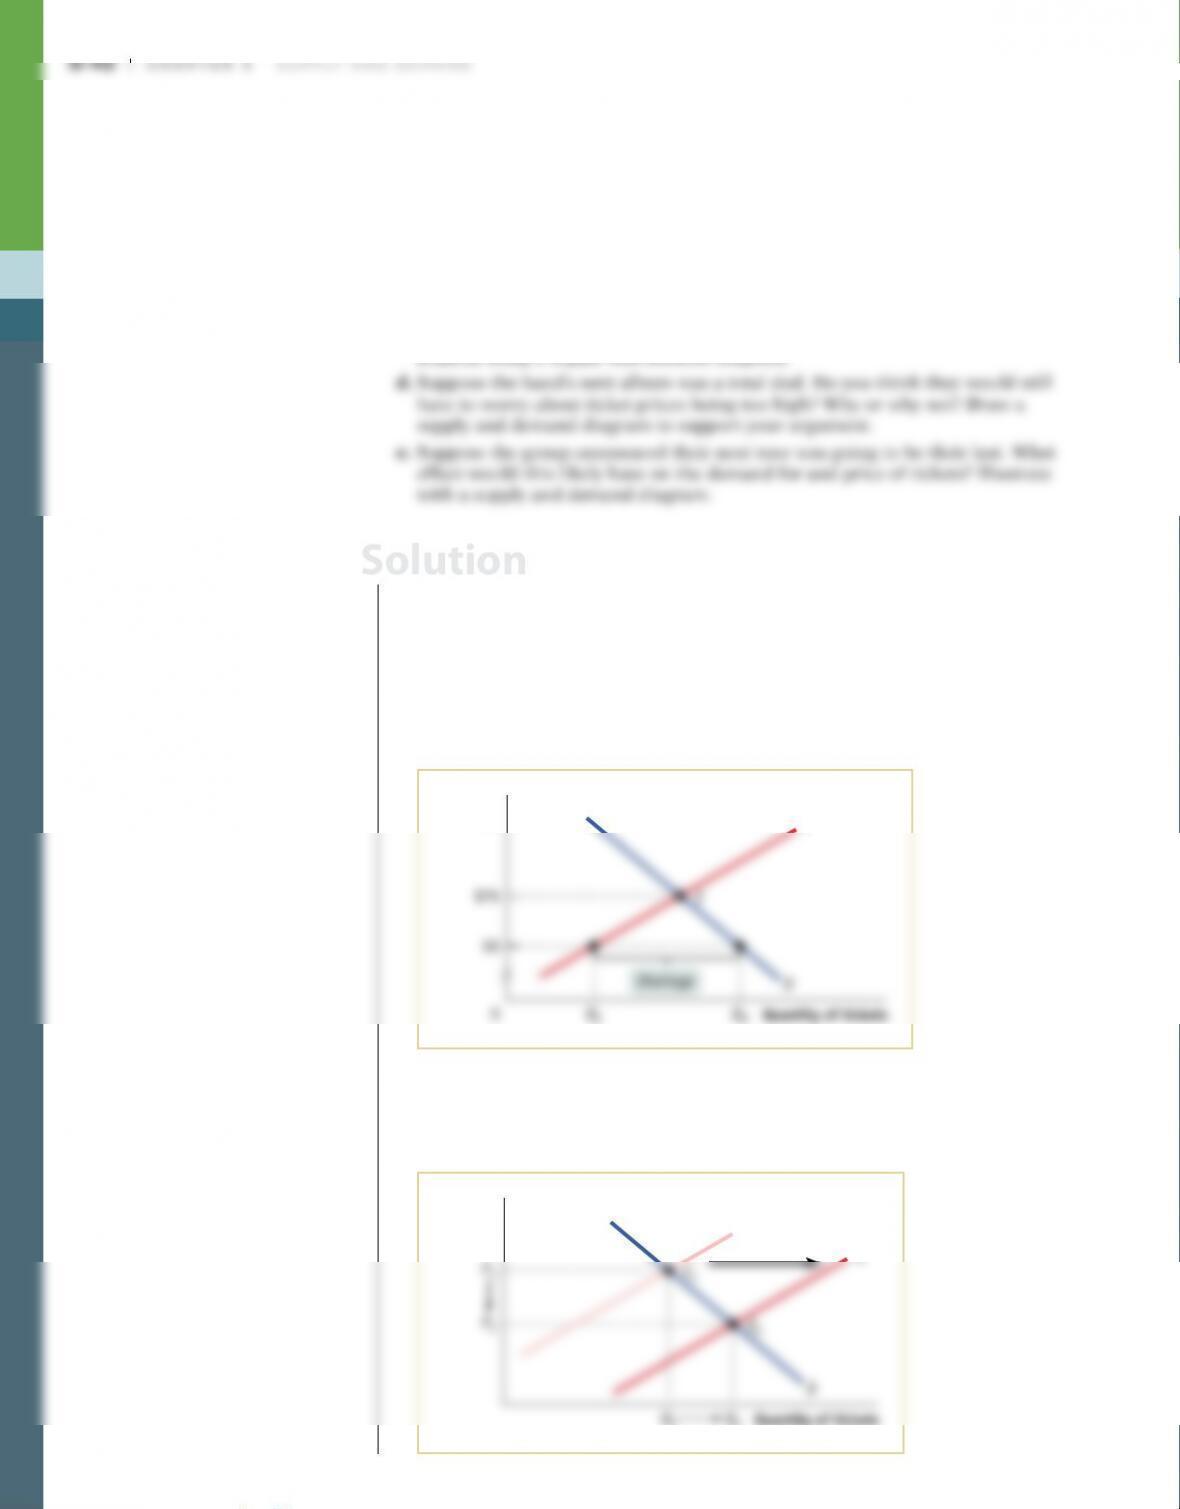
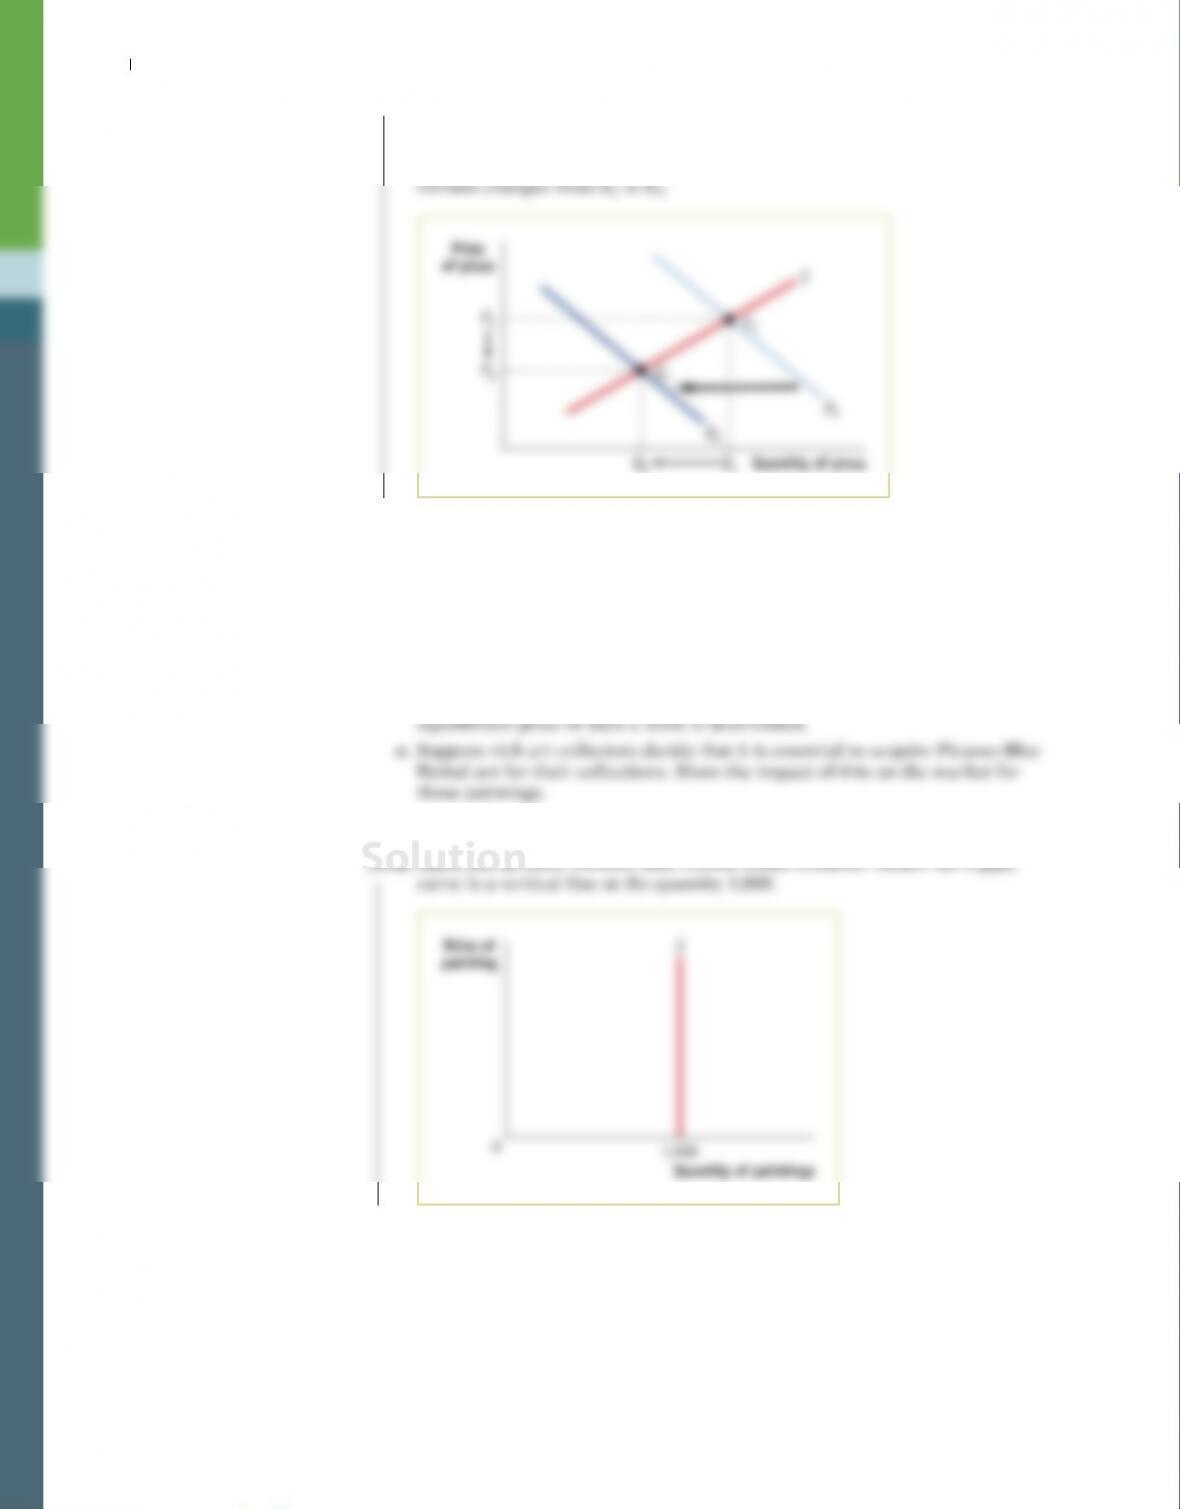
2. a. A rise in the price of a substitute (tacos) causes the demand for hamburgers to
increase. This represents a rightward shift of the demand curve from D1 to D2
and results in a rise in the equilibrium price and quantity as the equilibrium
changes from E1 to E2.
P1
D1
Quantity of hamburgers
Price
of
hamburger
S
E1
D2
b. A rise in the price of a complement (french fries) causes the demand for ham–
burgers to decrease. This represents a leftward shift of the demand curve from
D1 to D2 and results in a fall in the equilibrium price and quantity as the equi-
librium changes from E1 to E2.
P1
Price
of hamburger
Quantity of hamburgers
E1
S
c. A fall in income causes the demand for a normal good (hamburgers) to
de crease. This represents a leftward shift of the demand curve from D1 to D2
and results in a fall in the equilibrium price and quantity as the equilibrium
changes from E1 to E2.
D2
Price
of hamburger
Quantity of hamburgers
S
Solution
Chapter 3 Supply and demand S-31
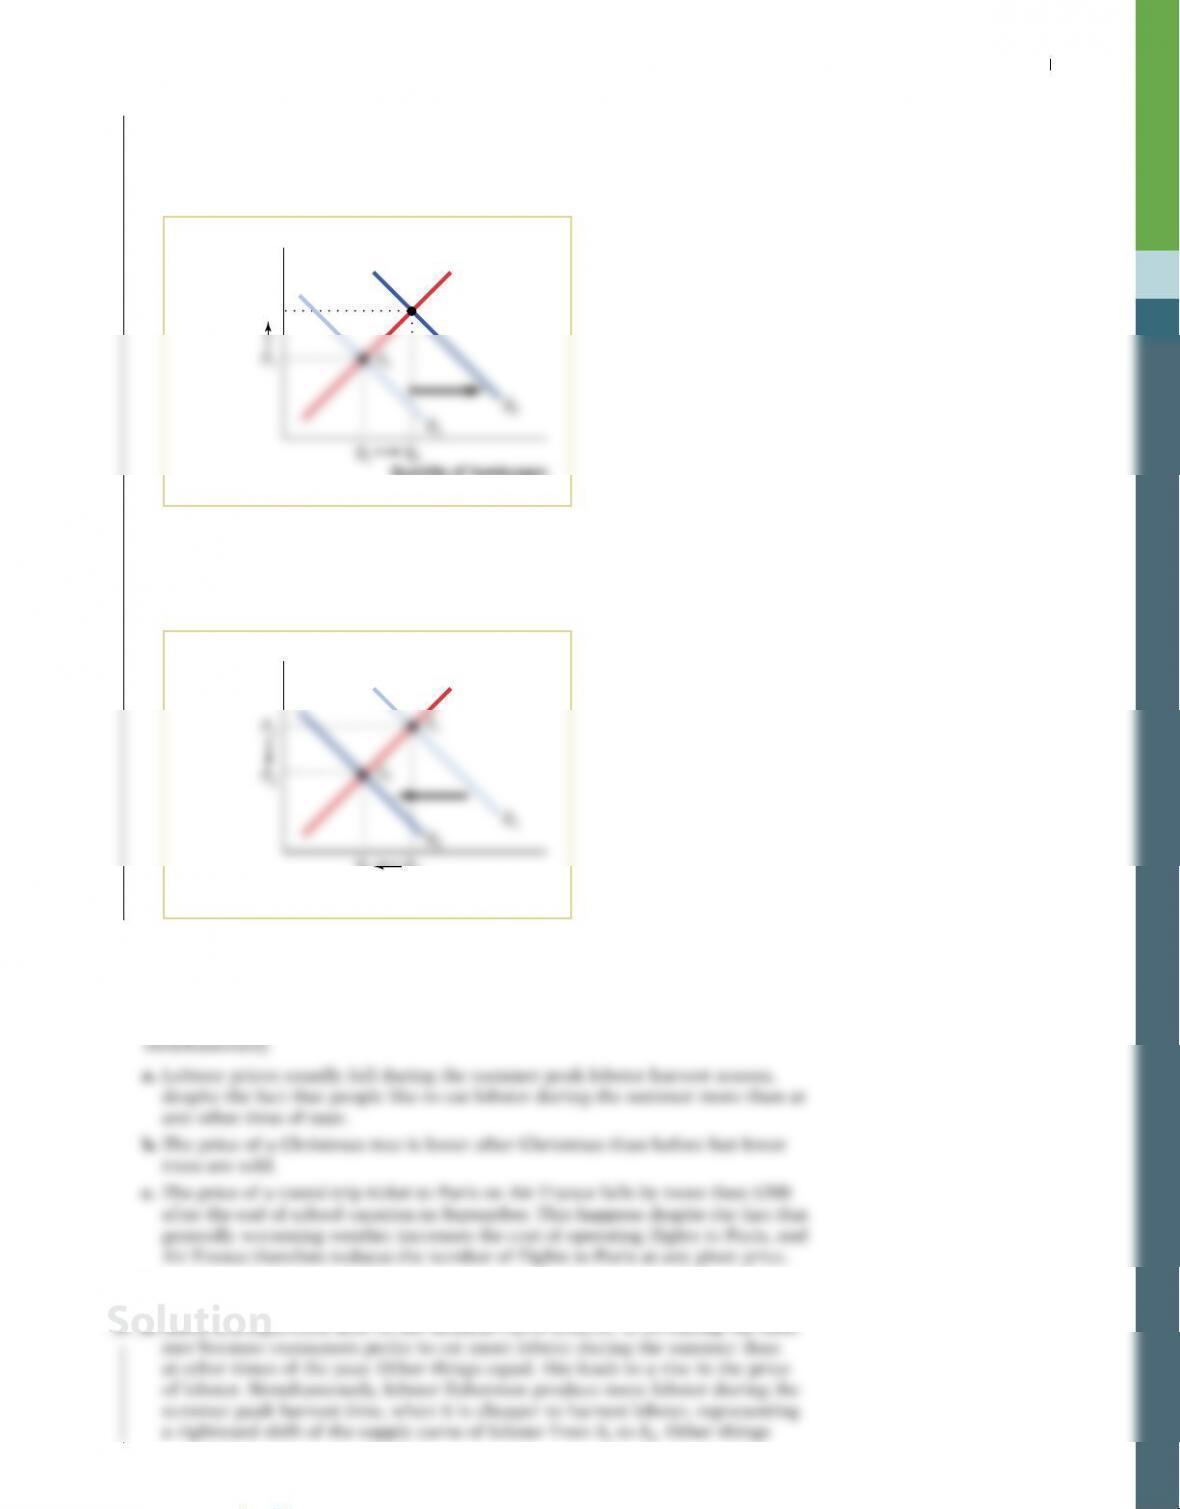
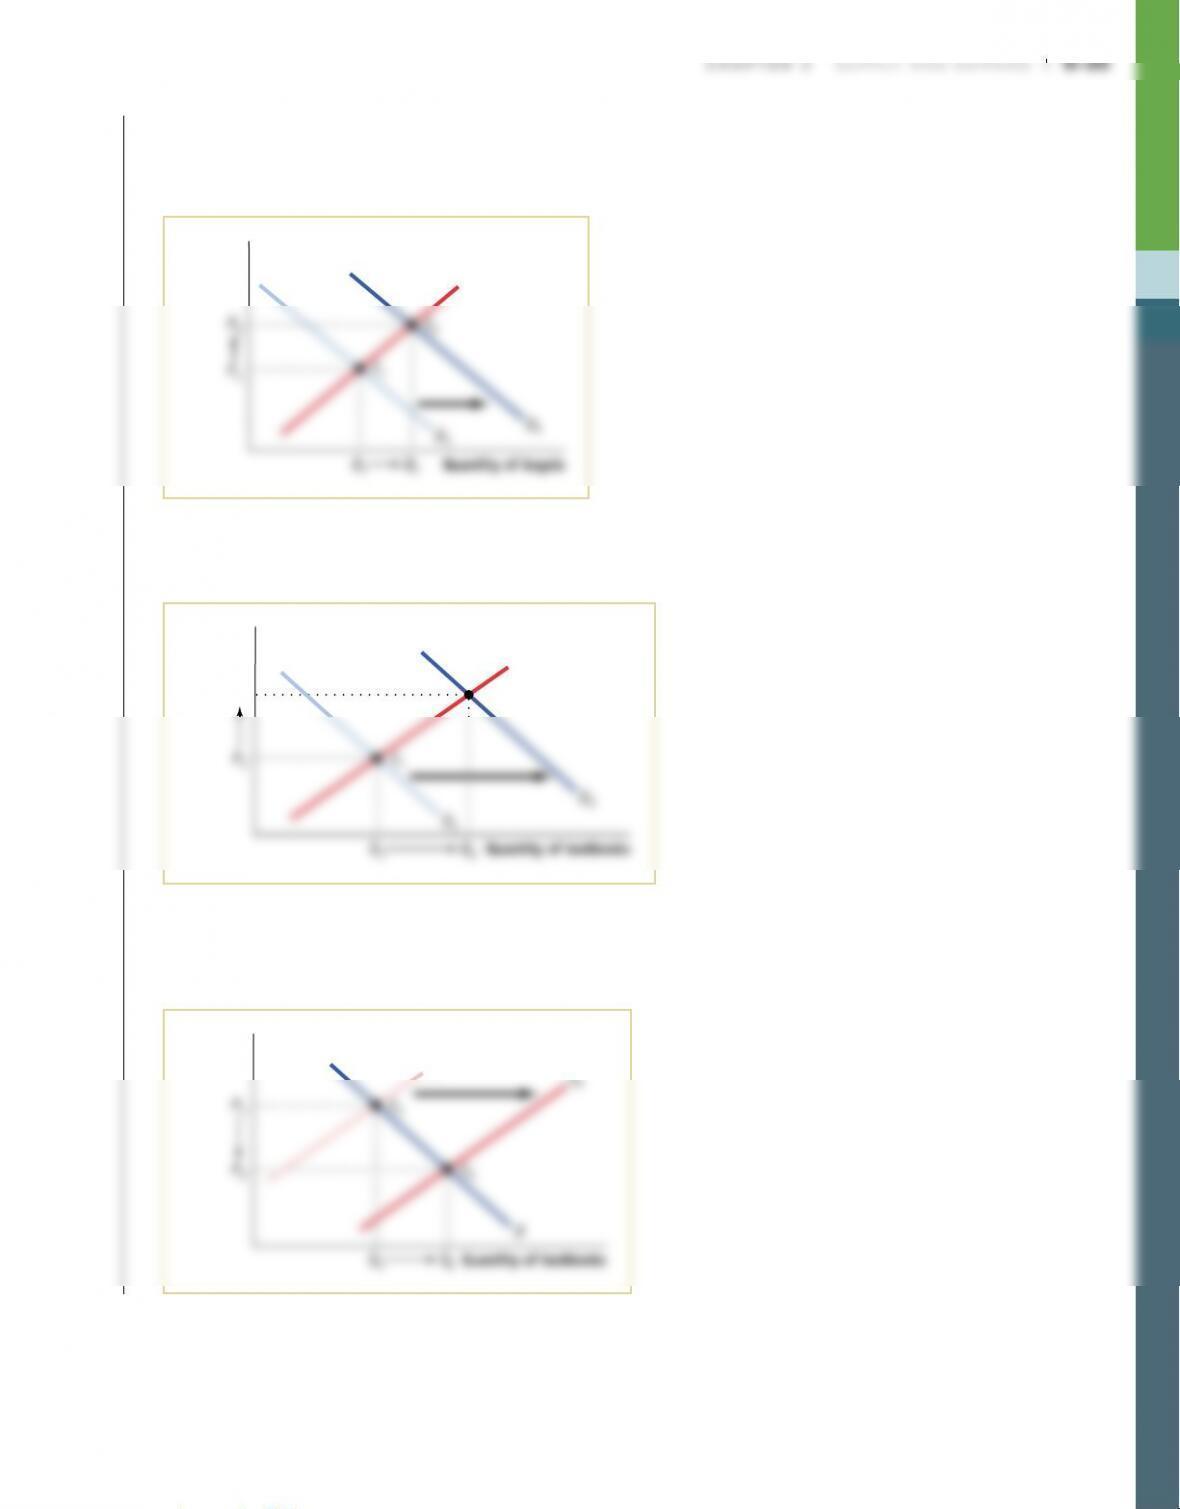
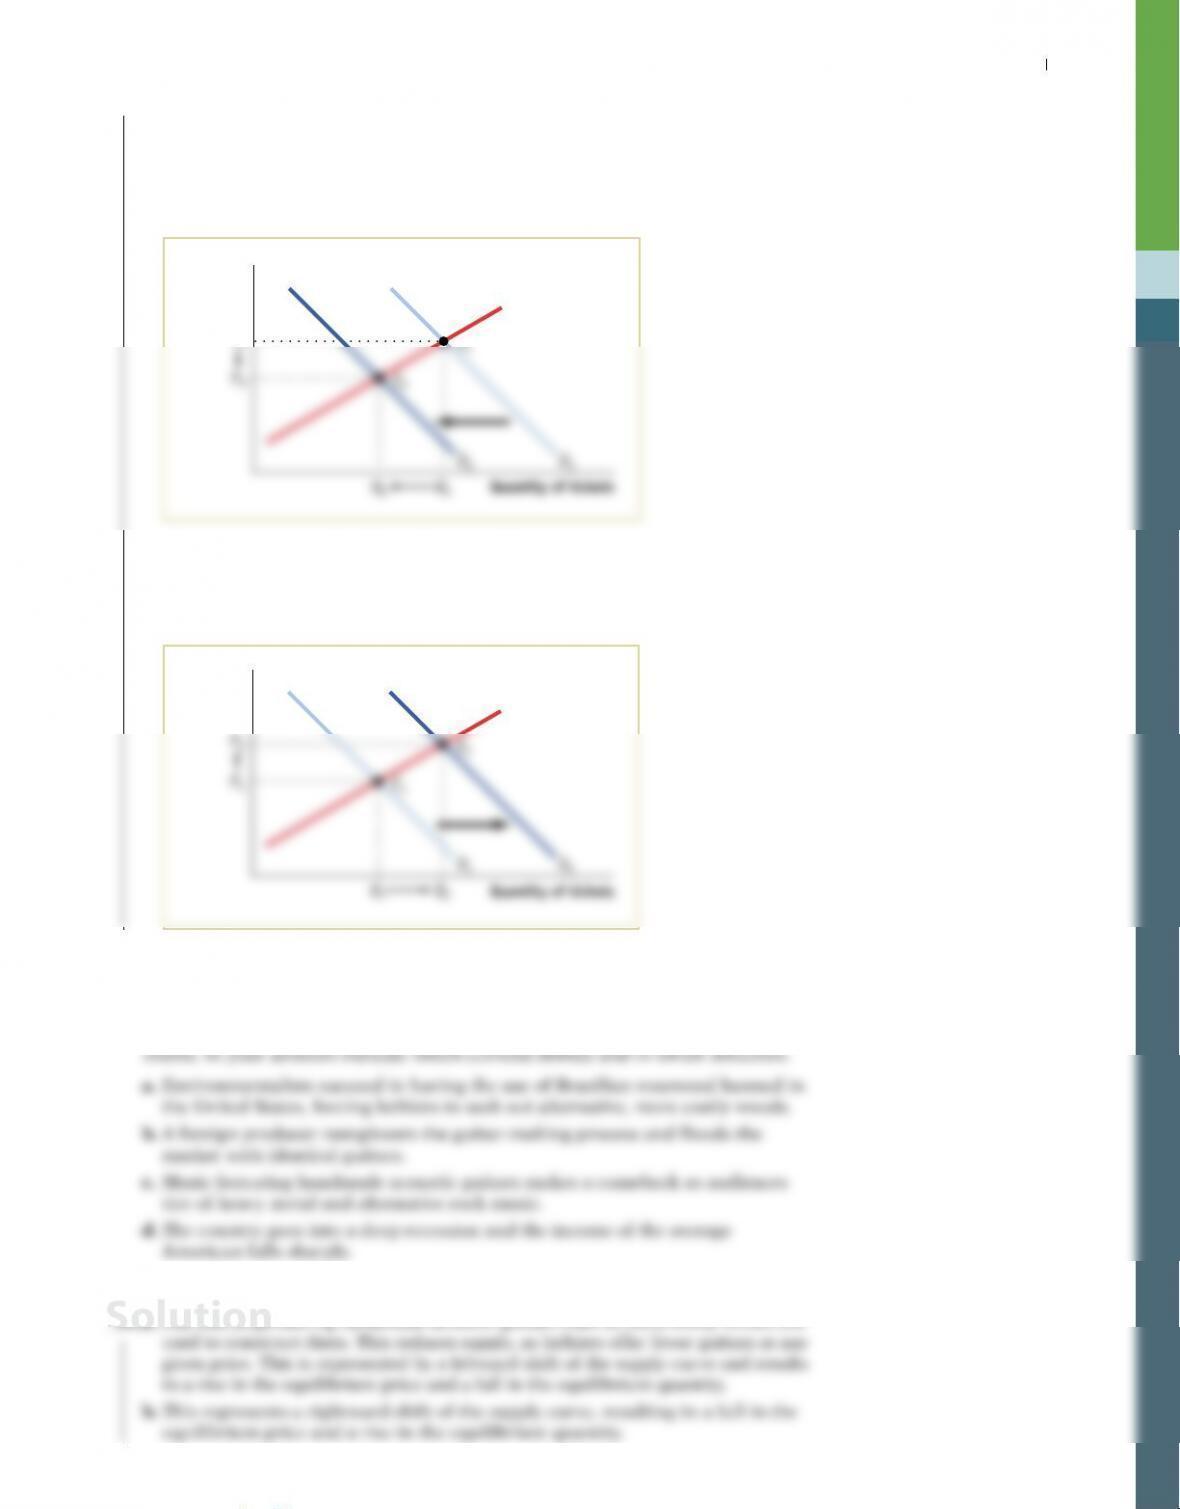
d. A fall in income causes the demand for an inferior good (hamburgers) to
increase. This represents a rightward shift of the demand curve from D1 to D2
and results in a rise in the equilibrium price and quantity as the equilibrium
changes from E1 to E2.
P2
Price
of hamburger
E2
S
Quantity of hamburgers
e. A fall in the price of a substitute (hot dogs) causes demand for hamburgers to
decrease. This is represented by a leftward shift of the demand curve from D1
to D2 and results in a fall in the equilibrium price and quantity as the equilib–
rium changes from E1 to E2.
Q1
Q2
Price
of
hamburger
Quantity of hamburgers
S
3. The market for many goods changes in predictable ways according to the time
of year, in response to events such as holidays, vacation times, seasonal changes
in production, and so on. Using supply and demand, explain the change in
price in each of the following cases. Note that supply and demand may shift
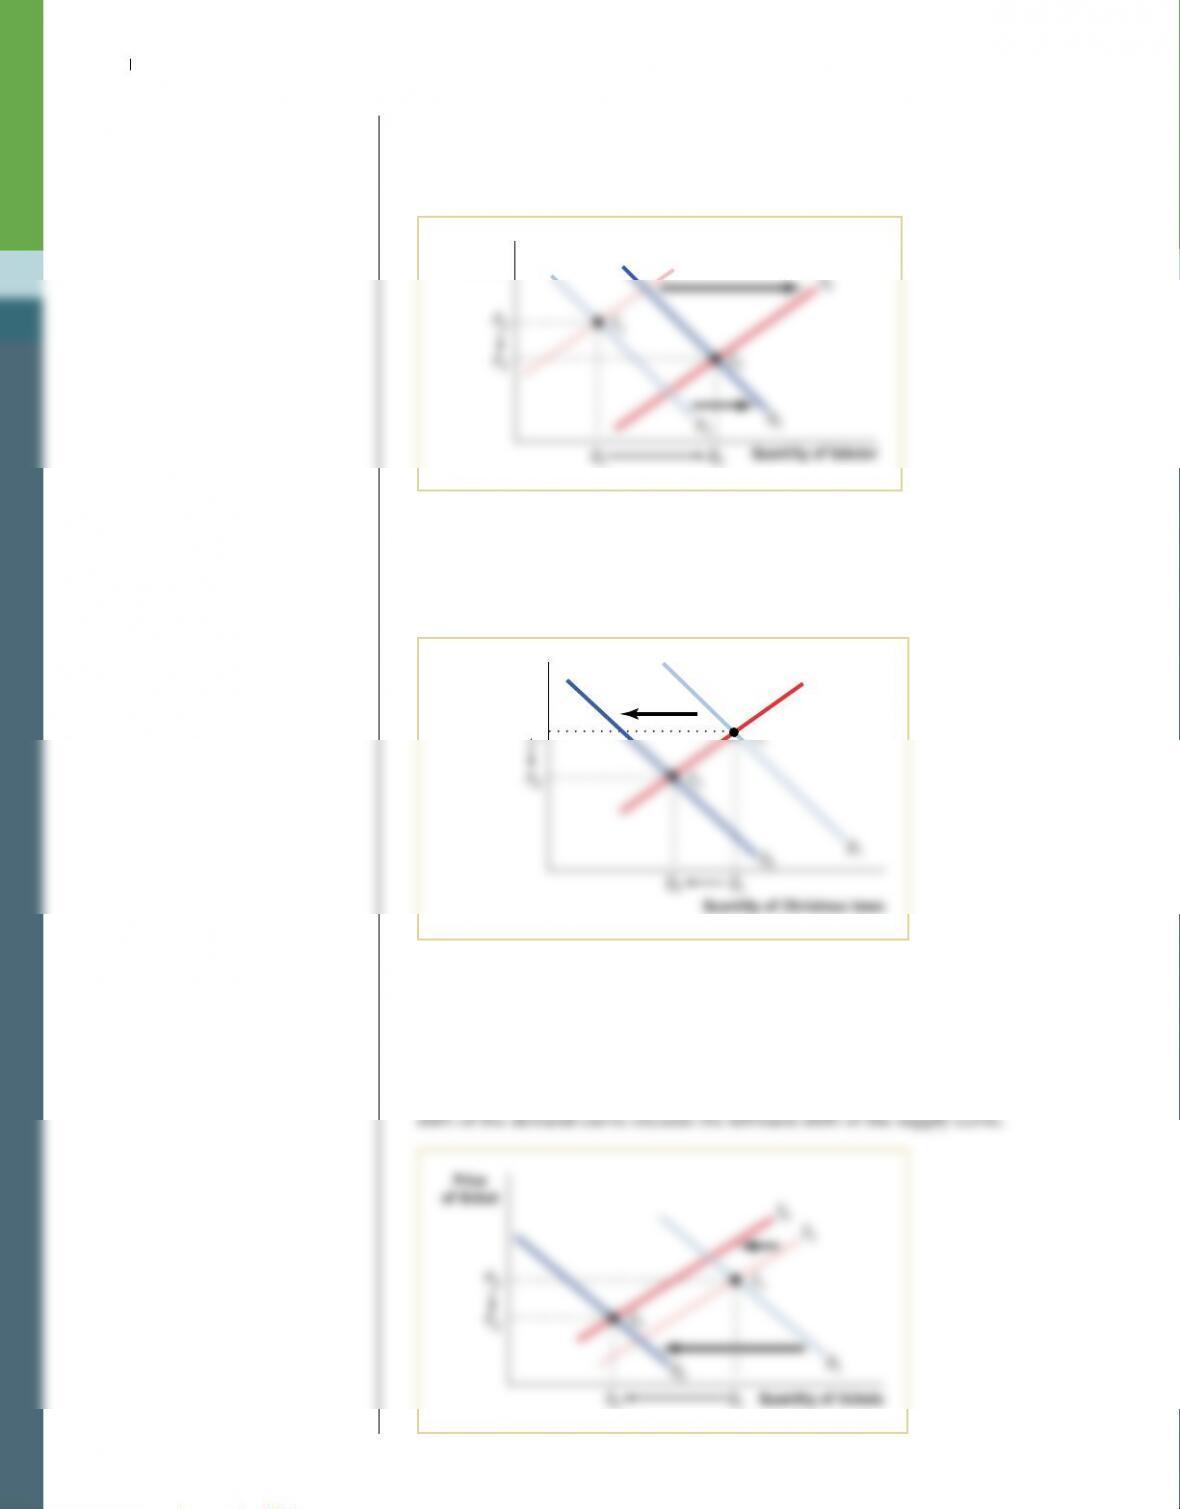
3. a. There is a rightward shift of the demand curve from D1 to D2 during the sum–
Solution
S-32 Chapter 3 Supply and demand
equal, this leads to a fall in the price of lobster. Given the simultaneous right-
ward shifts of both the demand and supply curves, the equilibrium changes
from E1 to E2. The fall in price indicates that the rightward shift of the supply
curve exceeds the rightward shift of the demand curve.
P2
P1E1
S1
Price
of
lobster
E2
S2
4. Show in a diagram the effect on the demand curve, the supply curve, the
equilibrium price, and the equilibrium quantity of each of the following events.
a. The market for newspapers in your town
Case 2: There is a big news event in your town, which is reported in the
newspapers.
b. The market for Seattle Seahawks cotton T-shirts
d. The market for the Krugman and Wells economics textbook
Case 1: Your professor makes it required reading for all of his or her students.
4. a. Case 1: Journalists are an input in the production of newspapers; an increase
in their salaries will cause newspaper publishers to reduce the quantity sup–
plied at any given price. This represents a leftward shift of the supply curve
from S1 to S2 and results in a rise in the equilibrium price and a fall in the
equilibrium quantity as the equilibrium changes from E1 to E2.
Q2
P2
S1
Q1Quantity of newspapers
E2
S2
Price of
newspaper
Case 2: Townspeople will wish to purchase more newspapers at any given
price. This represents a rightward shift of the demand curve from D1 to D2
and leads to a rise in both the equilibrium price and quantity as the equilib–
rium changes from E1 to E2.
Q1
P1
P2
E1
S
D1
D2
Q2Quantity of newspapers
E2
Price of
newspaper
Solution
S-34 Chapter 3 Supply and demand
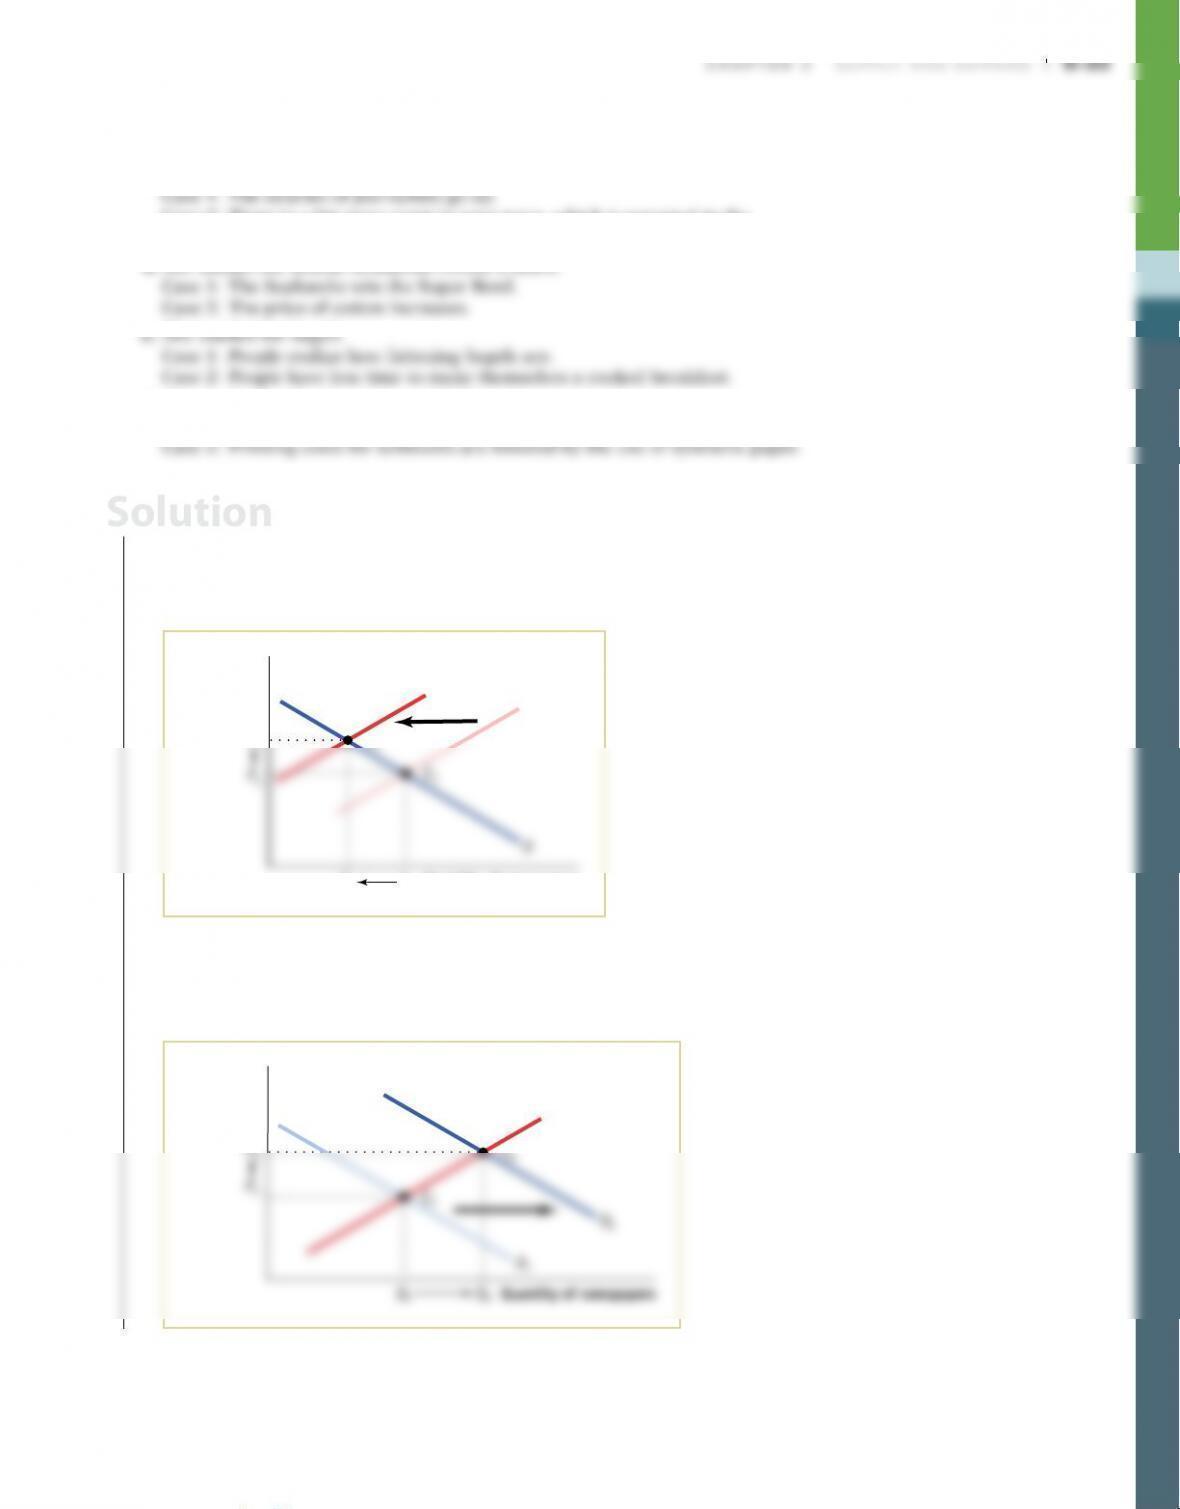
b. Case 1: Fans will demand more Seattle Seahawks memorabilia at any given
price. This represents a rightward shift of the demand curve from D1 to D2
and leads to a rise in both the equilibrium price and quantity as the equilib–
rium changes from E1 to E2.
Q1
S
Q2Quantity of T-shirts
Price of
T-shirt
Case 2: Cotton is an input into T-shirts; an increase in its price will cause
T-shirt manufacturers to reduce the quantity supplied at any given price, rep–
resenting a leftward shift of the supply curve from S1 to S2. This leads to a rise
in the equilibrium price and a fall in the equilibrium quantity as the equilib–
rium changes from E1 to E2.
Q2
P2
S1
Q1Quantity of T-shirts
E2
S2
Price of
T-shirt
c. Case 1: Consumers will demand fewer bagels at any given price. This
represents a leftward shift of the demand curve from D1 to D2 and leads to
a fall in both the equilibrium price and quantity as the equilibrium changes
from E1 to E2.
Q1
P1E1
S
Q2Quantity of bagels
Price
of bagel
Case 2: Consumers will demand more bagels (a substitute for cooked break-
fasts) at any given price. This represents a rightward shift of the demand curve
from D1 to D2 and leads to a rise in both the equilibrium price and quantity as
the equilibrium changes from E1 to E2.
Q2
P1
P2E2
S
D1
Q1Quantity of bagels
E1
D2
Price
of bagel
d. Case 1: A greater quantity of textbooks will be demanded at any given price,
representing a rightward shift of the demand curve from D1 to D2. Equilibrium
price and quantity will rise as the equilibrium changes from E1 to E2.
P2
S
E2
Price of
textbook
S-36 Chapter 3 Supply and demand
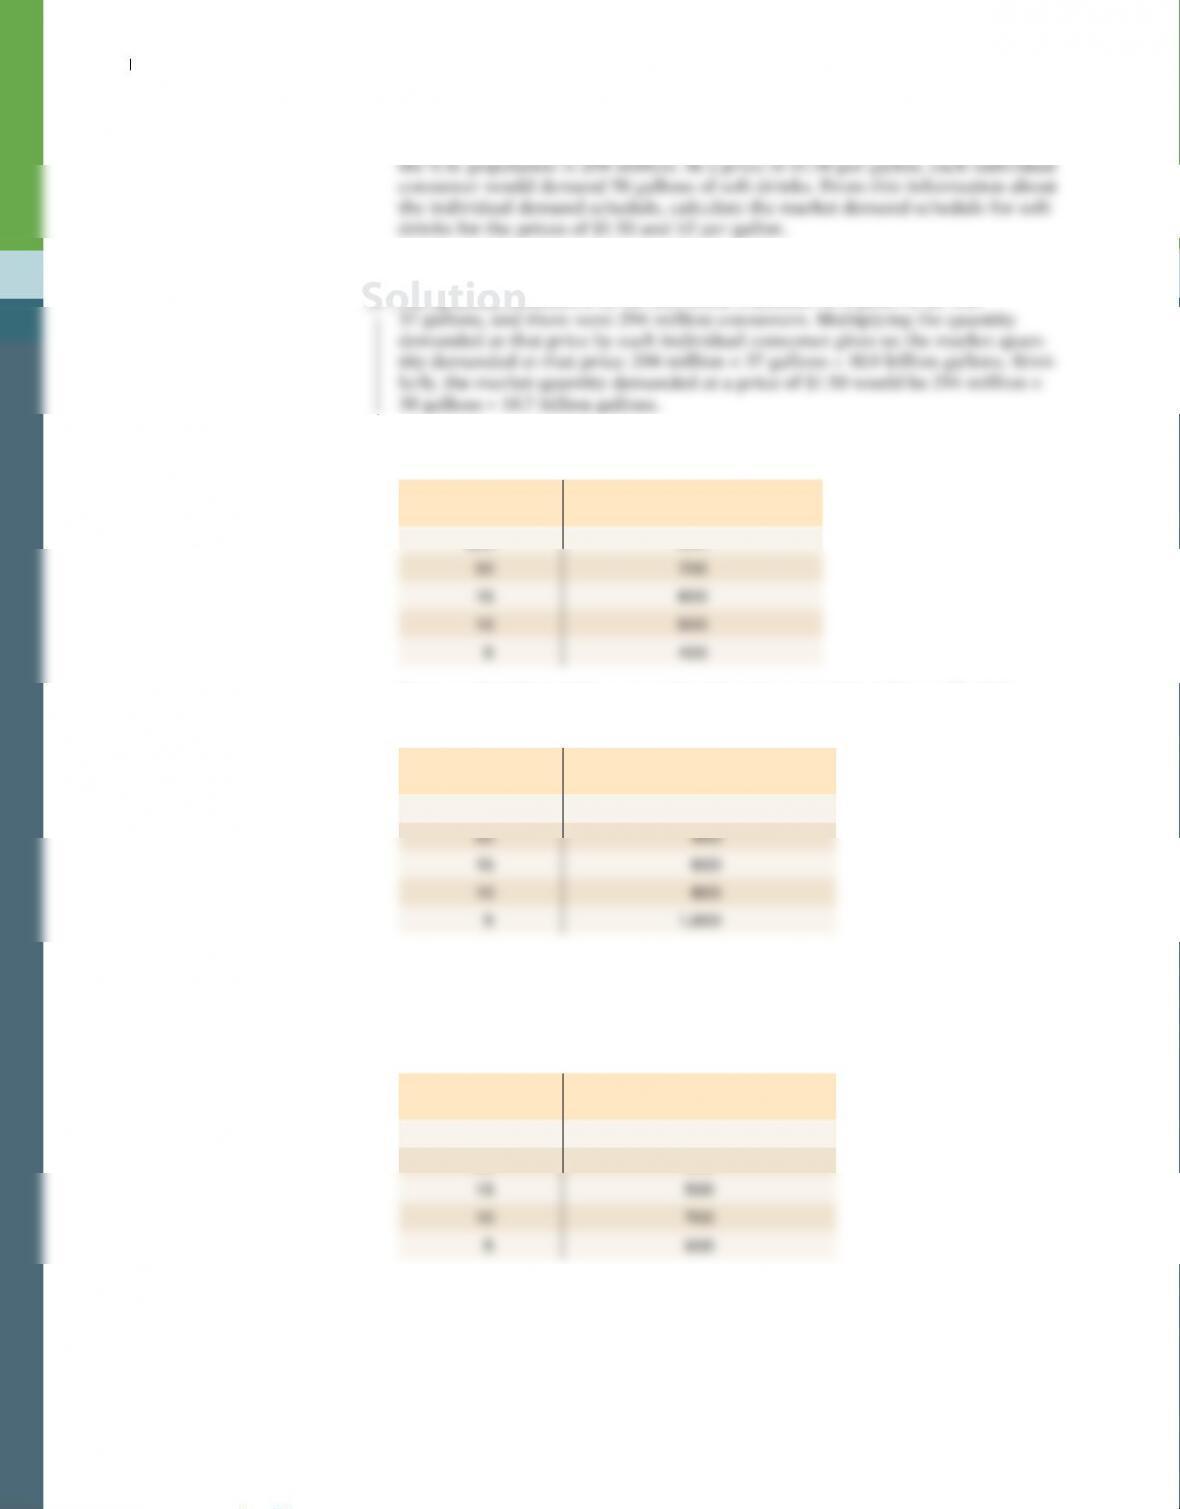
5. Let’s assume that each person in the United States consumes an average of
37 gallons of soft drinks (nondiet) at an average price of $2 per gallon and that
5. The quantity demanded by an individual consumer at a price of $2 was
6. Suppose that the supply schedule of Maine lobsters is as follows:
Price of lobster
(per pound)
Quantity of lobster supplied
(pounds)
$25 800
Suppose that Maine lobsters can be sold only in the United States. The U.S.
demand schedule for Maine lobsters is as follows:
Price of lobster
(per pound)
Quantity of lobster demanded
(pounds)
$25 200
a. Draw the demand curve and the supply curve for Maine lobsters. What are the
equilibrium price and quantity of lobsters?
Now suppose that Maine lobsters can be sold in France. The French demand
schedule for Maine lobsters is as follows:
Price of lobster
(per pound)
Quantity of lobster demanded
(pounds)
$25 100
20 300
b. What is the demand schedule for Maine lobsters now that French consumers
can also buy them? Draw a supply and demand diagram that illustrates the
new equilibrium price and quantity of lobsters. What will happen to the price
at which fishermen can sell lobster? What will happen to the price paid by U.S.
consumers? What will happen to the quantity consumed by U.S. consumers?
Solution
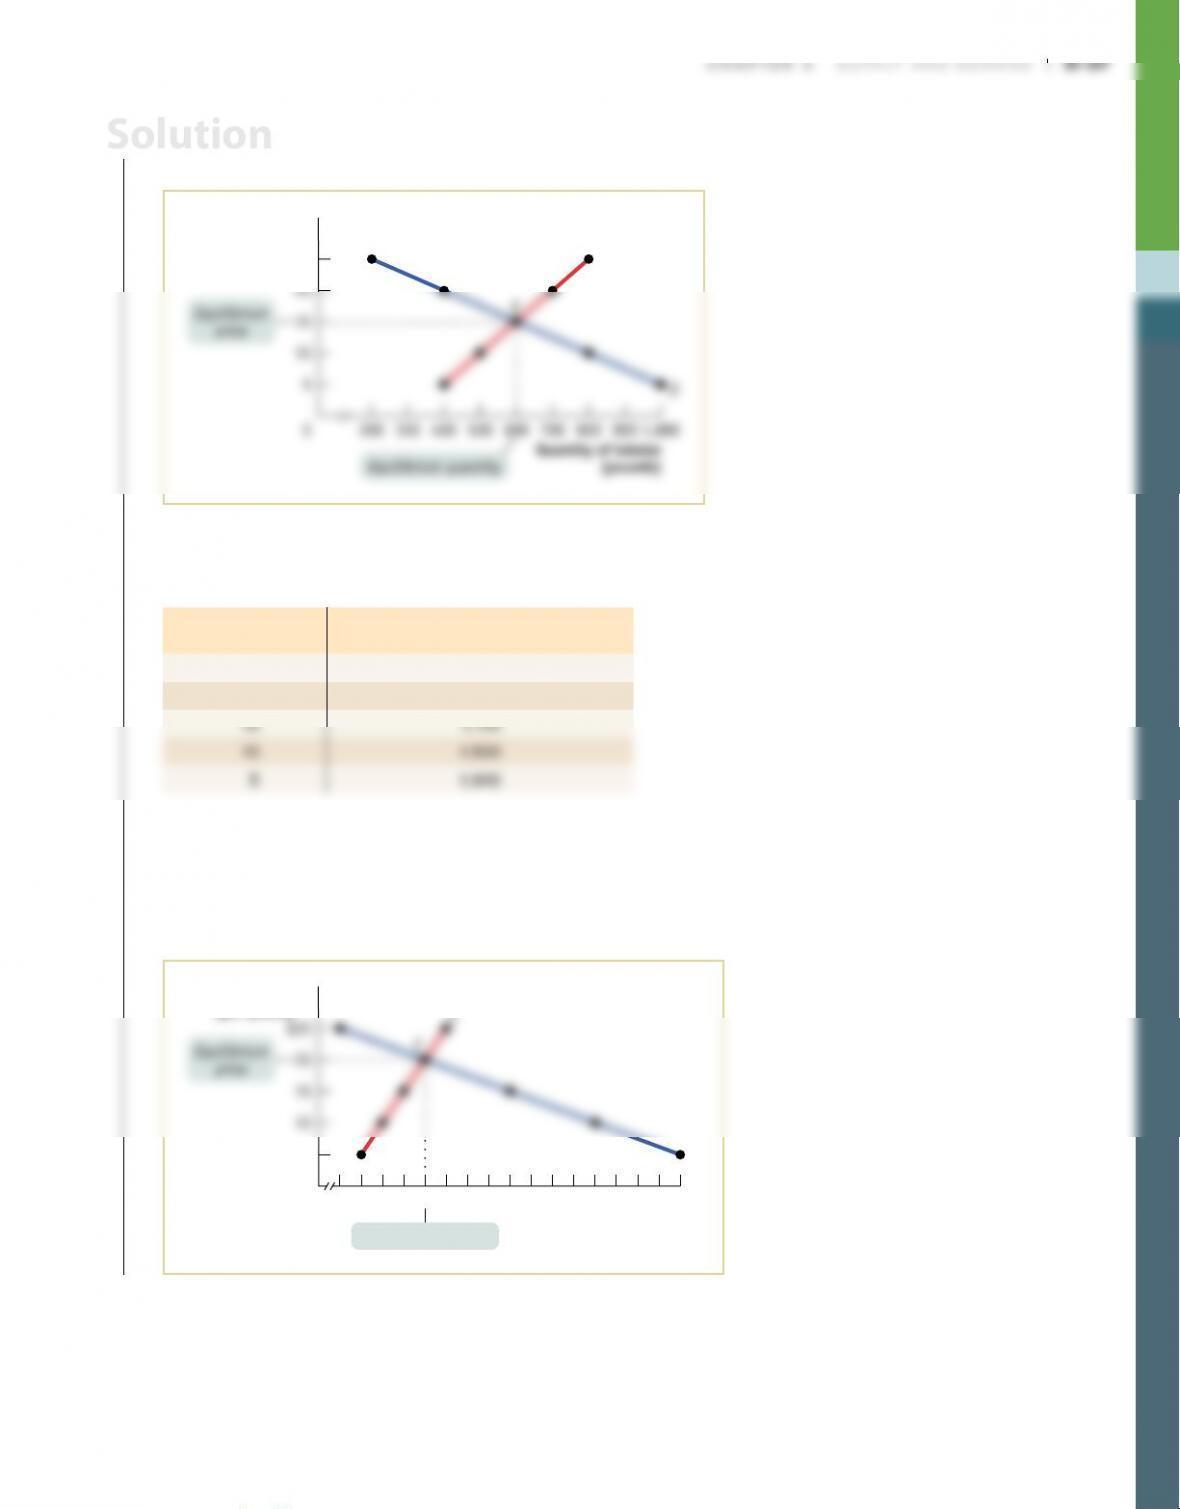
6. a. The equilibrium price of lobster is $15 per pound and the equilibrium quantity
is 600 pounds, point E in the accompanying diagram.
S
$25
Price of lobster
(per pound)
Quantity of lobster
(pounds)
Equilibrium quantity
b. The new demand schedule is obtained by adding together, at any given price,
the quantity demanded by American consumers and the quantity demanded
by French consumers, as shown in the accompanying table.
Price of lobster
(per pound)
Quantity of lobster demanded
(U.S. pounds plus French pounds)
$25 300
20 700
The new equilibrium price of lobster is $20 per pound and the new equilibrium
quantity is 700 pounds, point E in the accompanying diagram. The opportunity
to sell to French consumers makes Maine fishermen better off: they sell more
lobster and at a higher price than before. U.S. consumers, however, are made
worse off: they must pay a higher price for lobster ($20 versus $15 per pound)
and, as a result, consume less lobster (400 versus 600 pounds).
D
5
0
Price of lobster
(per pound)
Quantity of lobster
(pounds)
300 700 1,100 1,500
1,900
Equilibrium quantity
Solution
7. Find the flaws in reasoning in the following statements, paying particular attention
to the distinction between shifts of and movements along the supply and demand
curves. Draw a diagram to illustrate what actually happens in each situation.
a. “A technological innovation that lowers the cost of producing a good might
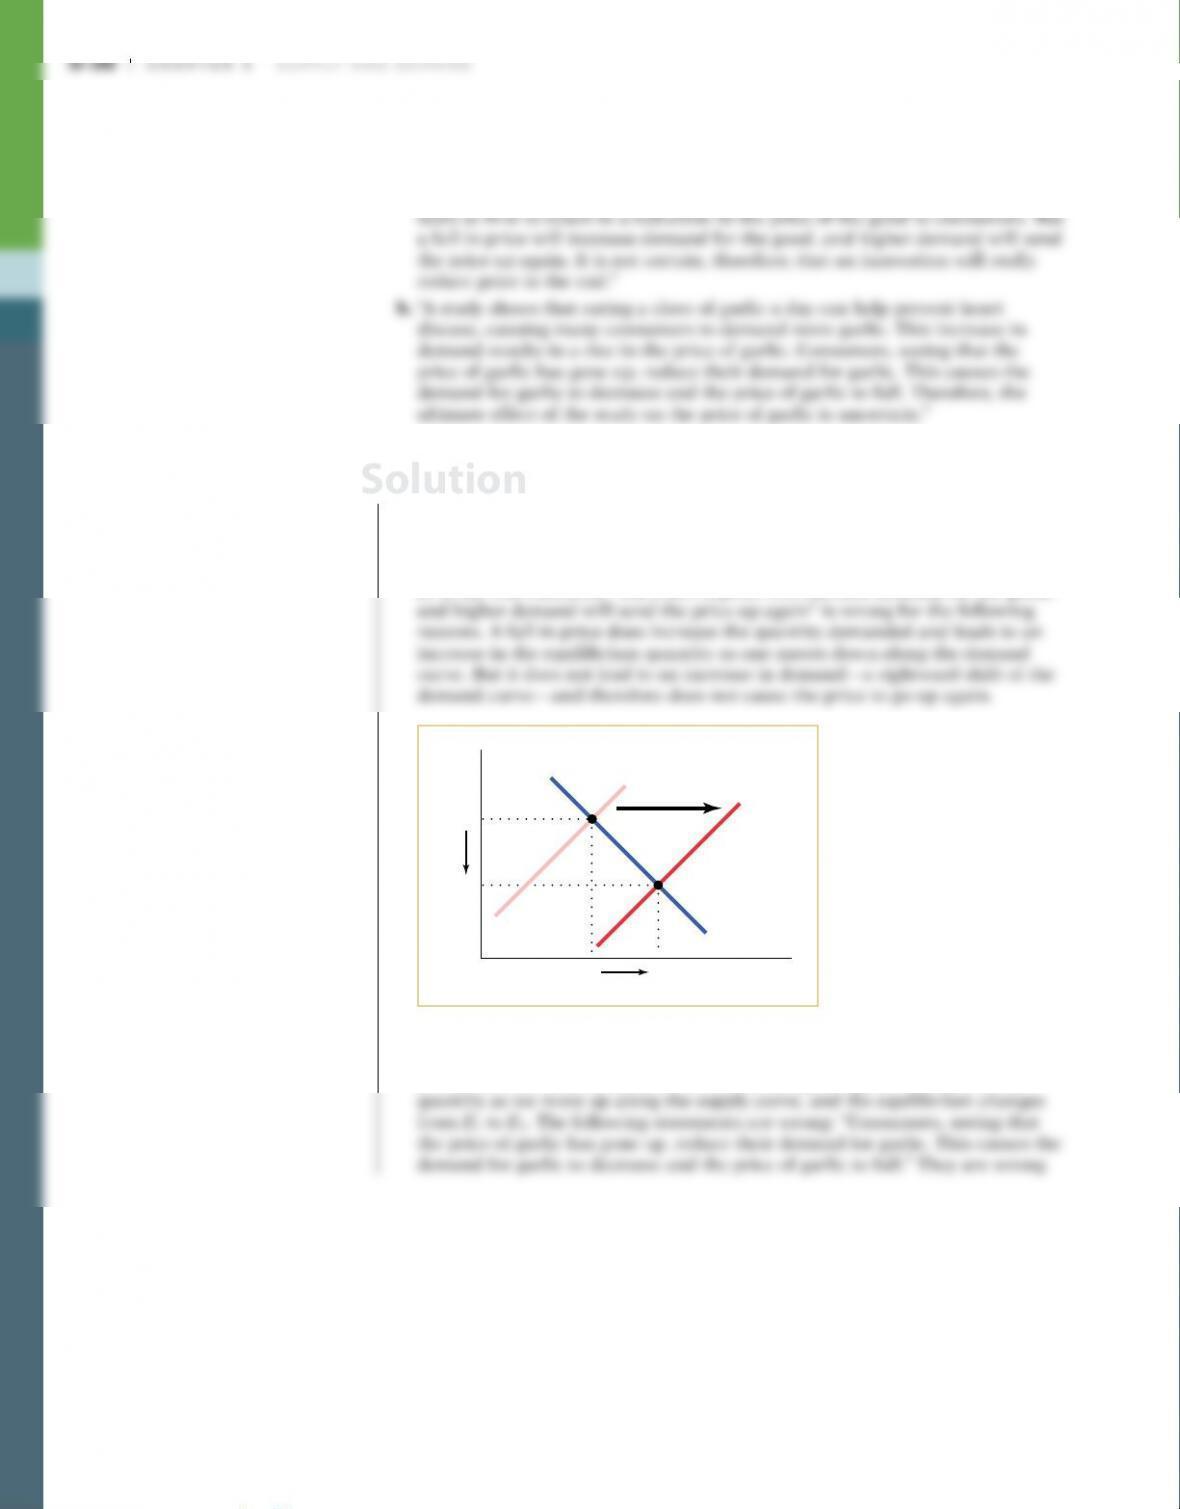
7. a. This statement confuses a shift of a curve with a movement along a curve. A
technological innovation lowers the cost of producing the good, leading pro–
ducers to offer more of the good at any given price. This is represented by a
rightward shift of the supply curve from S1 to S2. As a result, the equilibrium
price falls and the equilibrium quantity rises, as shown by the change from
E1 to E2. The statement “but a fall in price will increase demand for the good,
Q2
P2
P1
D
S1
Q1Quantity
E1
E2
Price
S2
b. This statement also confuses a shift of a curve with a movement along a curve.
The health report generates an increase in demand—a rightward shift of the
demand curve from D1 to D2. This leads to a higher equilibrium price and
Solution
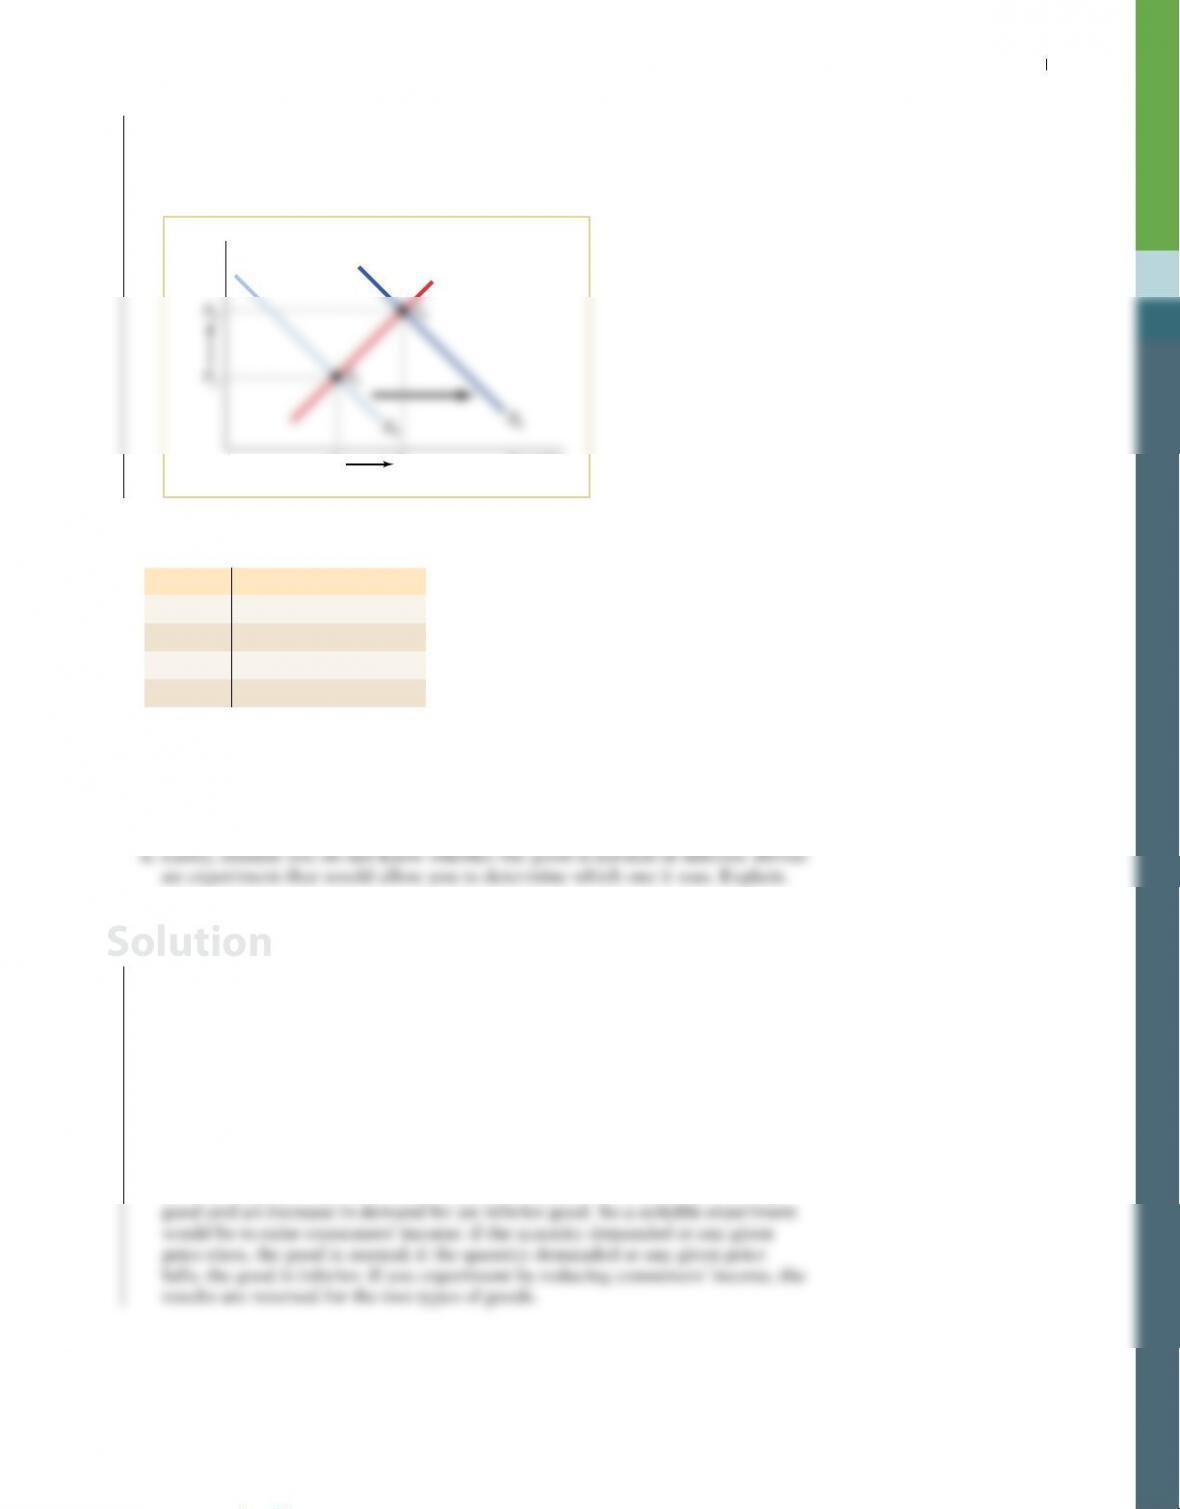
Chapter 3 Supply and demand S-39
because they imply that the rise in the equilibrium price causes the demand
for garlic to decrease—a leftward shift of the demand curve. But a rise in the
equilibrium price via a movement along the supply curve does not cause the
demand curve to shift leftward.
Q2
S
Q1Quantity
Price
8. The following table shows a demand schedule for a normal good.
Price Quantity demanded
$23 70
21 90
19 110
17 130
a. Do you think that the increase in quantity demanded (say, from 90 to 110 in
the table) when price decreases (from $21 to $19) is due to a rise in consumers’
income? Explain clearly (and briefly) why or why not.
b. Now suppose that the good is an inferior good. Would the demand schedule
still be valid for an inferior good?
8. a. The increase in quantity demanded from 90 to 110 when the price declines
from $21 to $19 is not due to a rise in consumers’ income. Rather, it represents
a movement along the demand curve as the price falls. In contrast, a rise in
consumers’ income causes the demand curve to shift rightward for a normal
good; as a result, the quantity demanded will increase at any given price.
b. This demand schedule is valid for an inferior good because inferior goods
obey the law of demand: a rise in the price leads to a fall in the quantity
demanded, other things equal.
c. You can determine whether a good is normal or inferior only by examining
what happens to the demand after consumers’ income changes. A rise in income
leads to an increase in demand for a normal good and a decrease in demand for
an inferior good. A fall in income leads to a decrease in demand for a normal
Solution
S-40 Chapter 3 Supply and demand
9. In recent years, the number of car producers in China has increased rapidly. In
fact, China now has more car brands than the United States. In addition, car
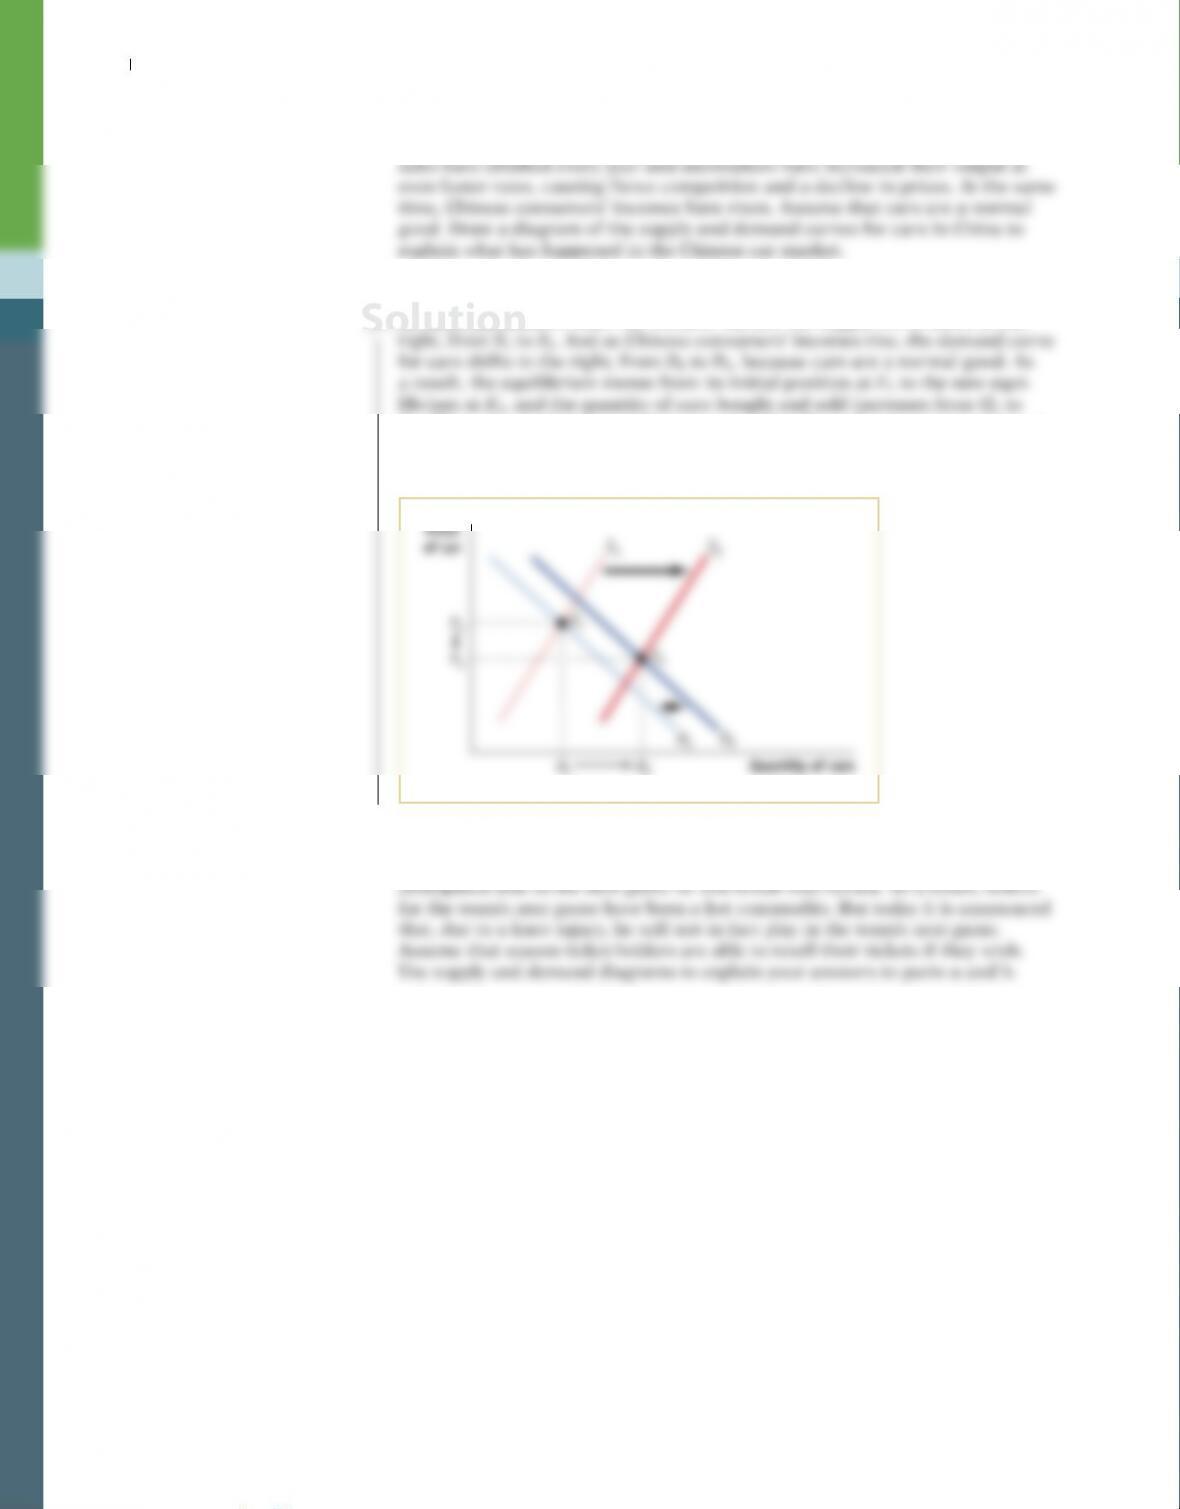
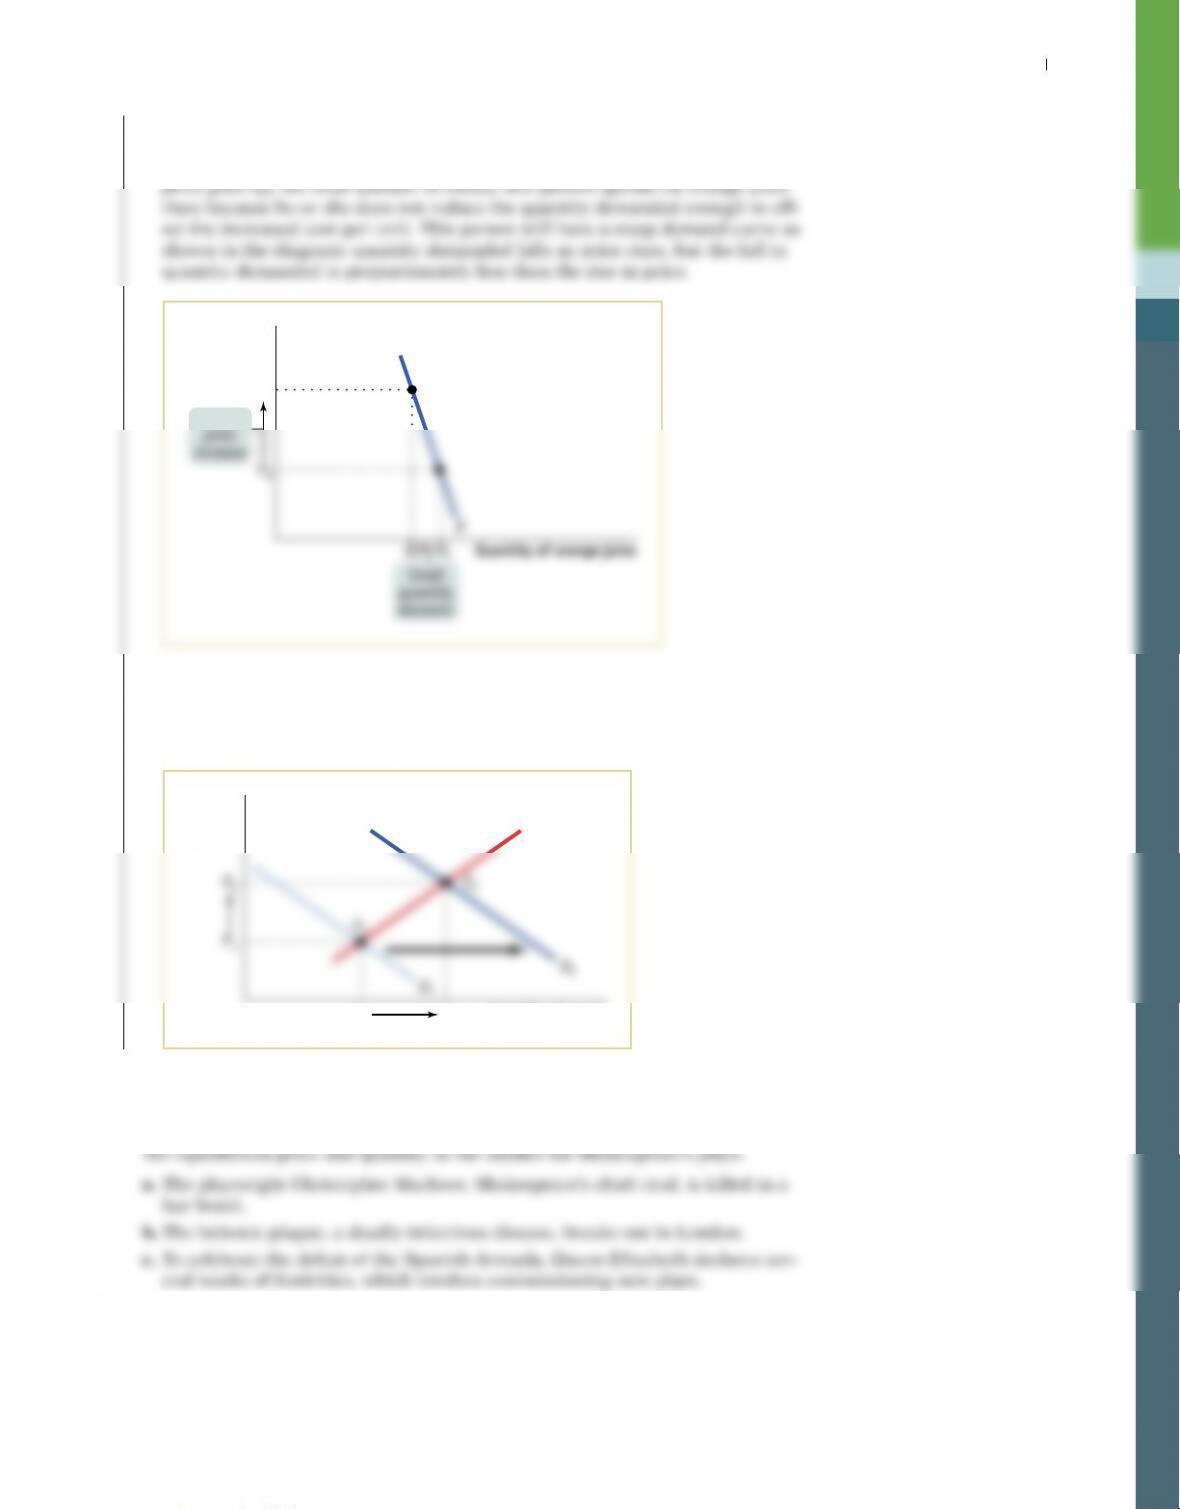
9. As more automakers enter the Chinese market, the supply curve shifts to the
Q2. This accounts for the rapid increase in sales. Since the question mentions a
decline in prices, the rightward shift of the supply curve must have been greater
than the rightward shift of the demand curve.
P1
E2
E1
P2
S2
S1
D2
D1
Price
of car
Solution
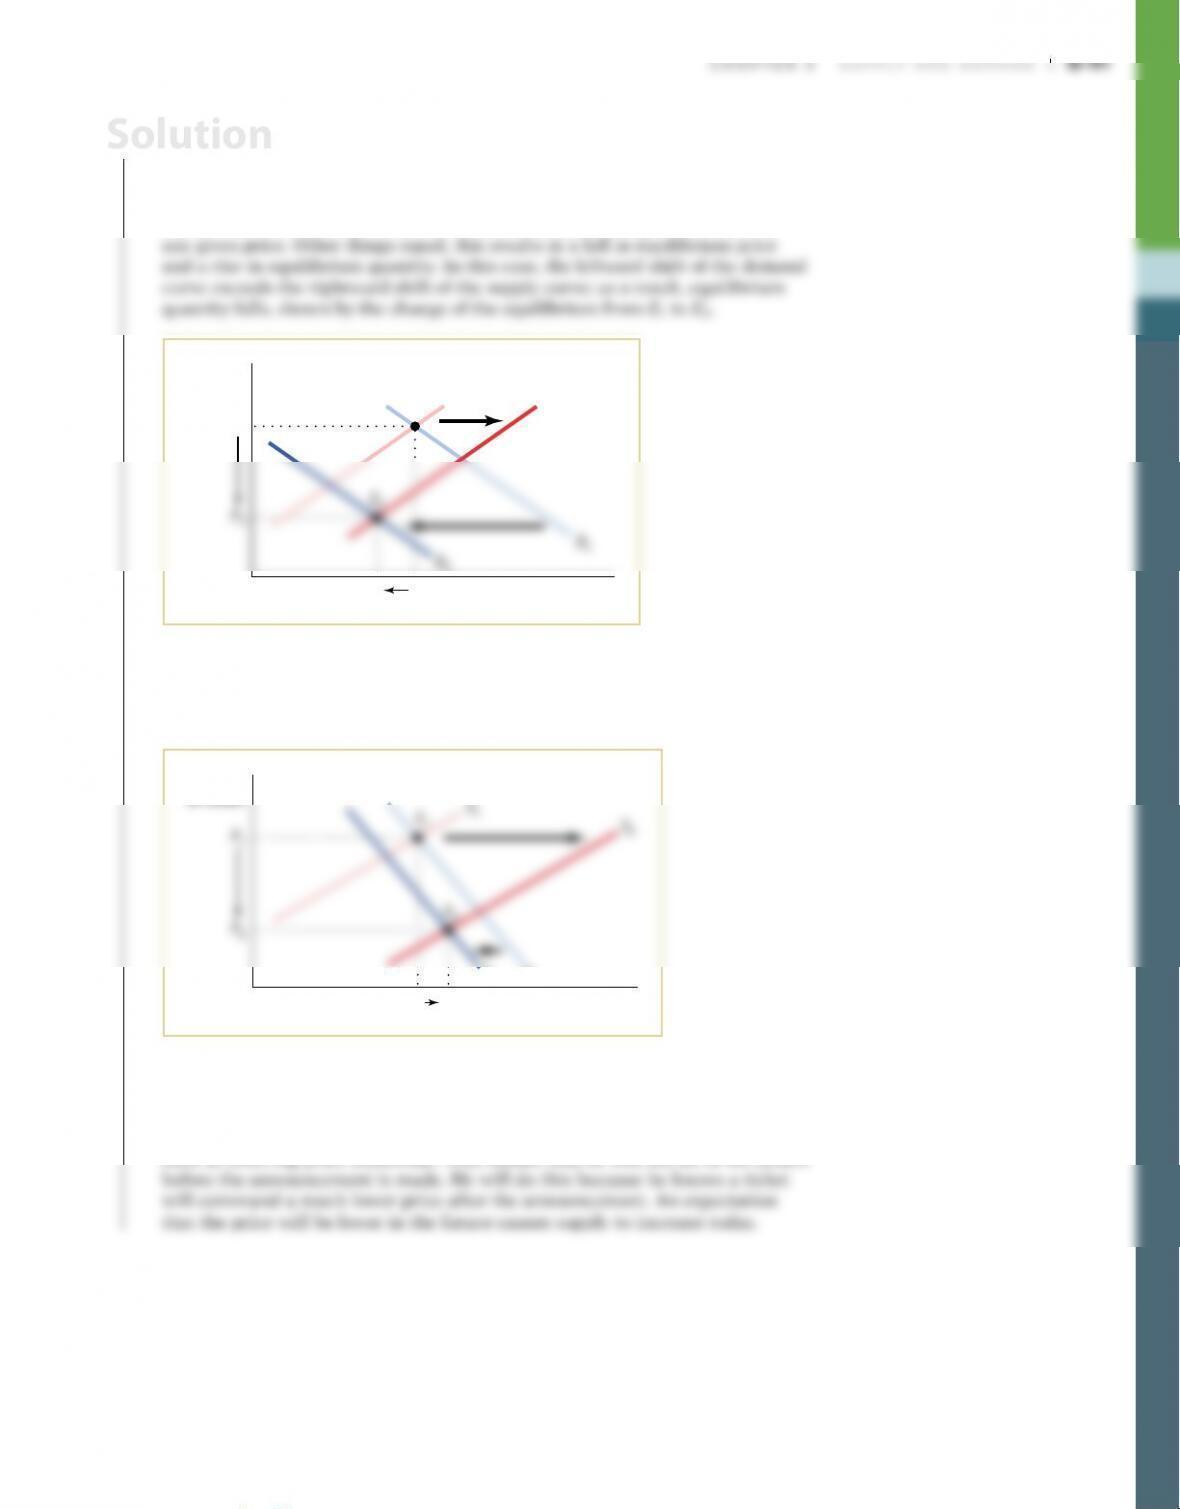
10. a. Fewer fans want to attend the next game after the announcement is made. As a
result, the demand curve will shift leftward from D1 to D2, as fewer tickets are
demanded at any given price; other things equal, this results in a fall in both
equilibrium price and quantity. In addition, the supply curve will shift right–
ward from S1 to S2, as more season ticket-holders are willing to sell tickets at
Q1
P1
Q2Quantity of tickets
E1
Price
of ticket
S1S2
b. The supply and demand curves shift in the same manner as in part a, but in
this case the rightward shift of the supply curve exceeds the leftward shift of
the demand curve. Consequently, equilibrium quantity rises, shown by the
change of the equilibrium from E1 to E2.
Q2
P2
P1
D2
D1
Q1Quantity of tickets
Price
of ticket
c. Case a (equilibrium quantity falls) occurs because the decrease in demand
exceeds the increase in supply. Case b (equilibrium quantity rises) occurs
because the increase in supply exceeds the decrease in demand.
d. A scalper who learns about the announcement secretly should take actions—
such as lowering price somewhat—that ensure that he will sell all of his tickets
Solution
11. Fans of music often bemoan the high price of concert tickets. One rock superstar
has argued that it isn’t worth hundreds, even thousands, of dollars to hear him
and his band play. Let’s assume this star sold out arenas around the country at
an average ticket price of $75.
a. How would you evaluate the argument that ticket prices are too high?
b. Suppose that due to this star’s protests, ticket prices were lowered to $50. In
what sense is this price too low? Draw a diagram using supply and demand
curves to support your argument.
c. Suppose the superstar really wanted to bring down ticket prices. Since he and
his band control the supply of their services, what do you recommend they do?
Explain using a supply and demand diagram.
11. a. If markets are competitive, the ticket price is simply the equilibrium price:
the price at which quantity supplied is equal to quantity demanded. No one
is “made” to pay $75 to go to a concert: a potential concert-goer will pay $75
if going to the concert seems worth that amount and will choose to do some–
thing else if it isn’t.
b. At $50 each, the quantity of tickets demanded exceeds the quantity of tickets
supplied. There is a shortage of tickets at this price, shown by the difference
between the quantity demanded at this price, QD, and the quantity supplied at
this price, QS.
QD
0
S
QSQuantity of tickets
Price
of ticket
c. The band can lower the average price of a ticket by increasing supply: give
more concerts. This is shown as a rightward shift of the supply curve from S1
to S2, resulting in a lower equilibrium price and a higher equilibrium quantity,
shown by the change of the equilibrium from E1 to E2.
Q2
D
S1
Q1Quantity of tickets
Price
of ticket
S2
Solution
Chapter 3 Supply and demand S-43
d. If the band’s album is a total dud, the demand for concert tickets is likely to
decrease. This represents a leftward shift of the demand curve from D1 to D2,
resulting in a lower equilibrium price and quantity as the equilibrium changes
from E1 to E2. This is likely to eliminate the worry that ticket prices are “too
high.”
P1
S
Price
of ticket
S-44 Chapter 3 Supply and demand
c. As more people demand music played on acoustic guitars, the demand for
these guitars by musicians increases as well. (Acoustic guitars are an input
13. Demand twisters: Sketch and explain the demand relationship in each of the
following statements.
a. I would never buy a Taylor Swift album! You couldn’t even give me one for
nothing.
b. I generally buy a bit more coffee as the price falls. But once the price falls to
$2 per pound, I’ll buy out the entire stock of the supermarket.
c. I spend more on orange juice even as the price rises. (Does this mean that I
must be violating the law of demand?)
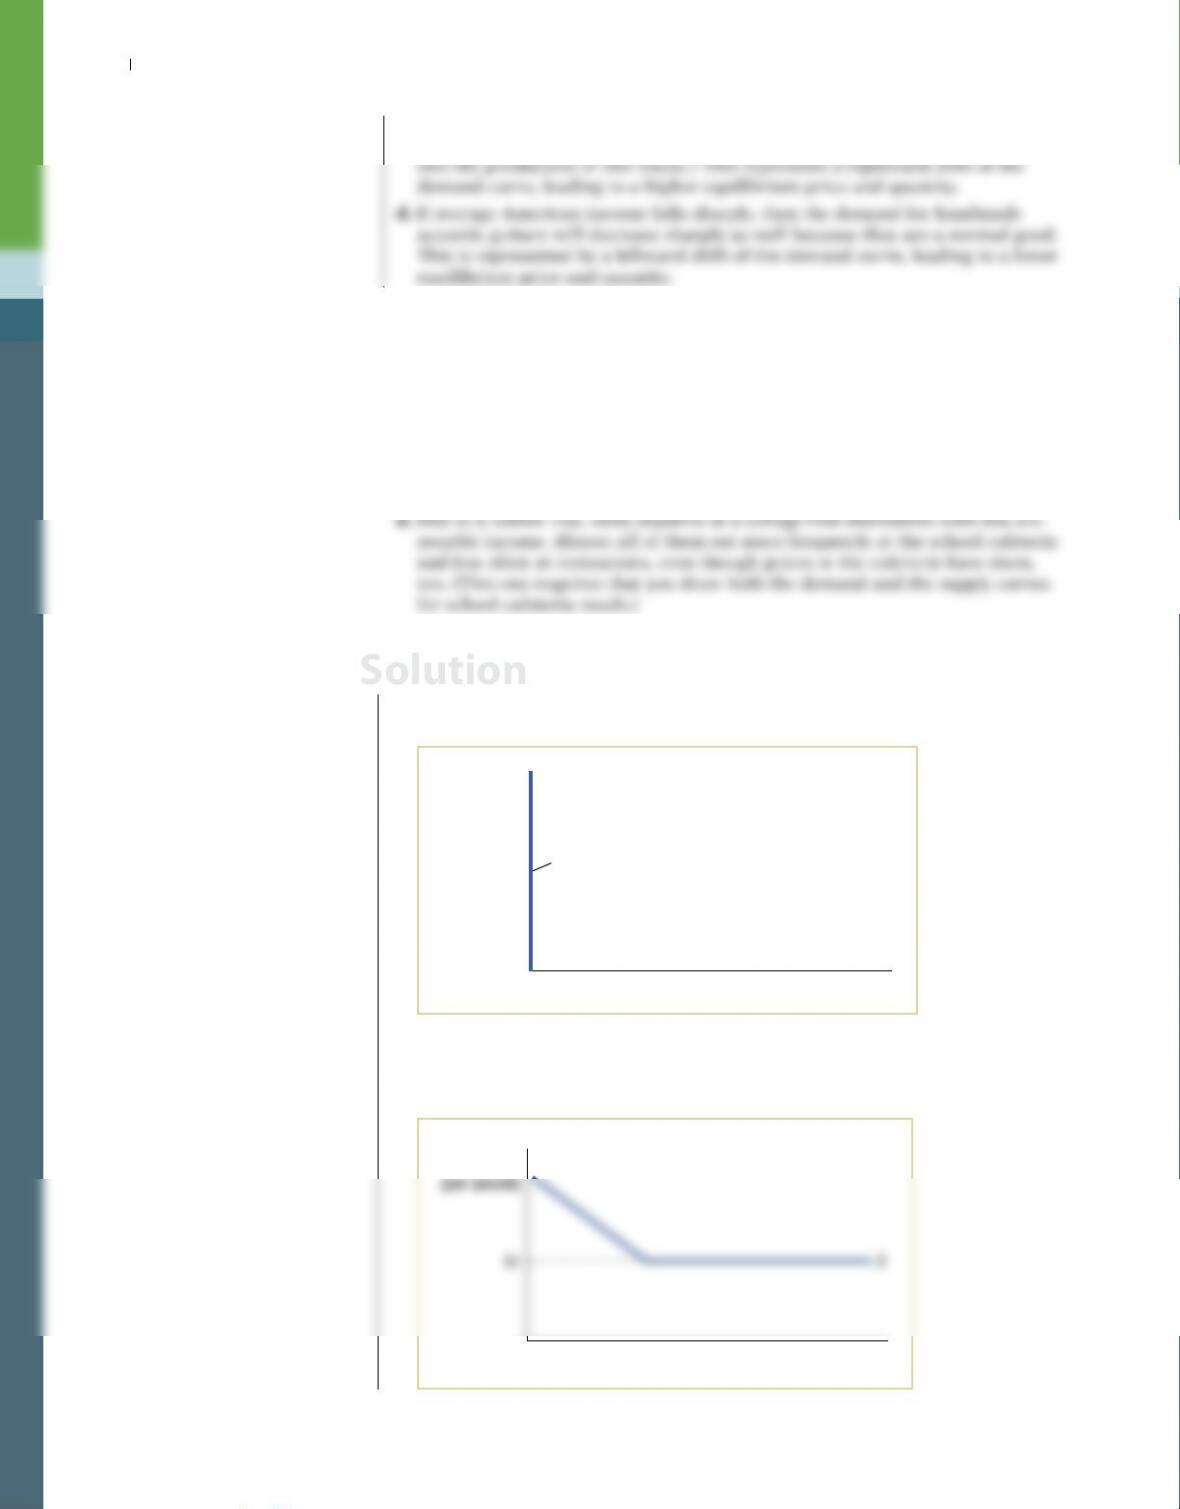
13. a. In this case, the quantity demanded is zero regardless of the price. So this
person’s demand curve for Taylor Swift albums is a vertical line at the quan–
tity of zero—that is, a vertical line that lies on top of the vertical axis.
D
Price of
T
aylor Swift
album
Quantity of Taylor Swift albums
0
b. The person here has the typical downward-sloping demand curve for coffee
until it reaches the price of $2 per pound, at which point it becomes horizon-
tal, showing that he or she would buy a very large quantity at that price.
Price
of coffee
(per pound)
Quantity of coffee (pounds)
0
Solution
Chapter 3 Supply and demand S-45
c. This person does not necessarily violate the law of demand: the quantity of
orange juice demanded may in fact fall as price goes up. The likely explana-
tion is the following: spending is price times the quantity demanded. Although
S-46 Chapter 3 Supply and demand
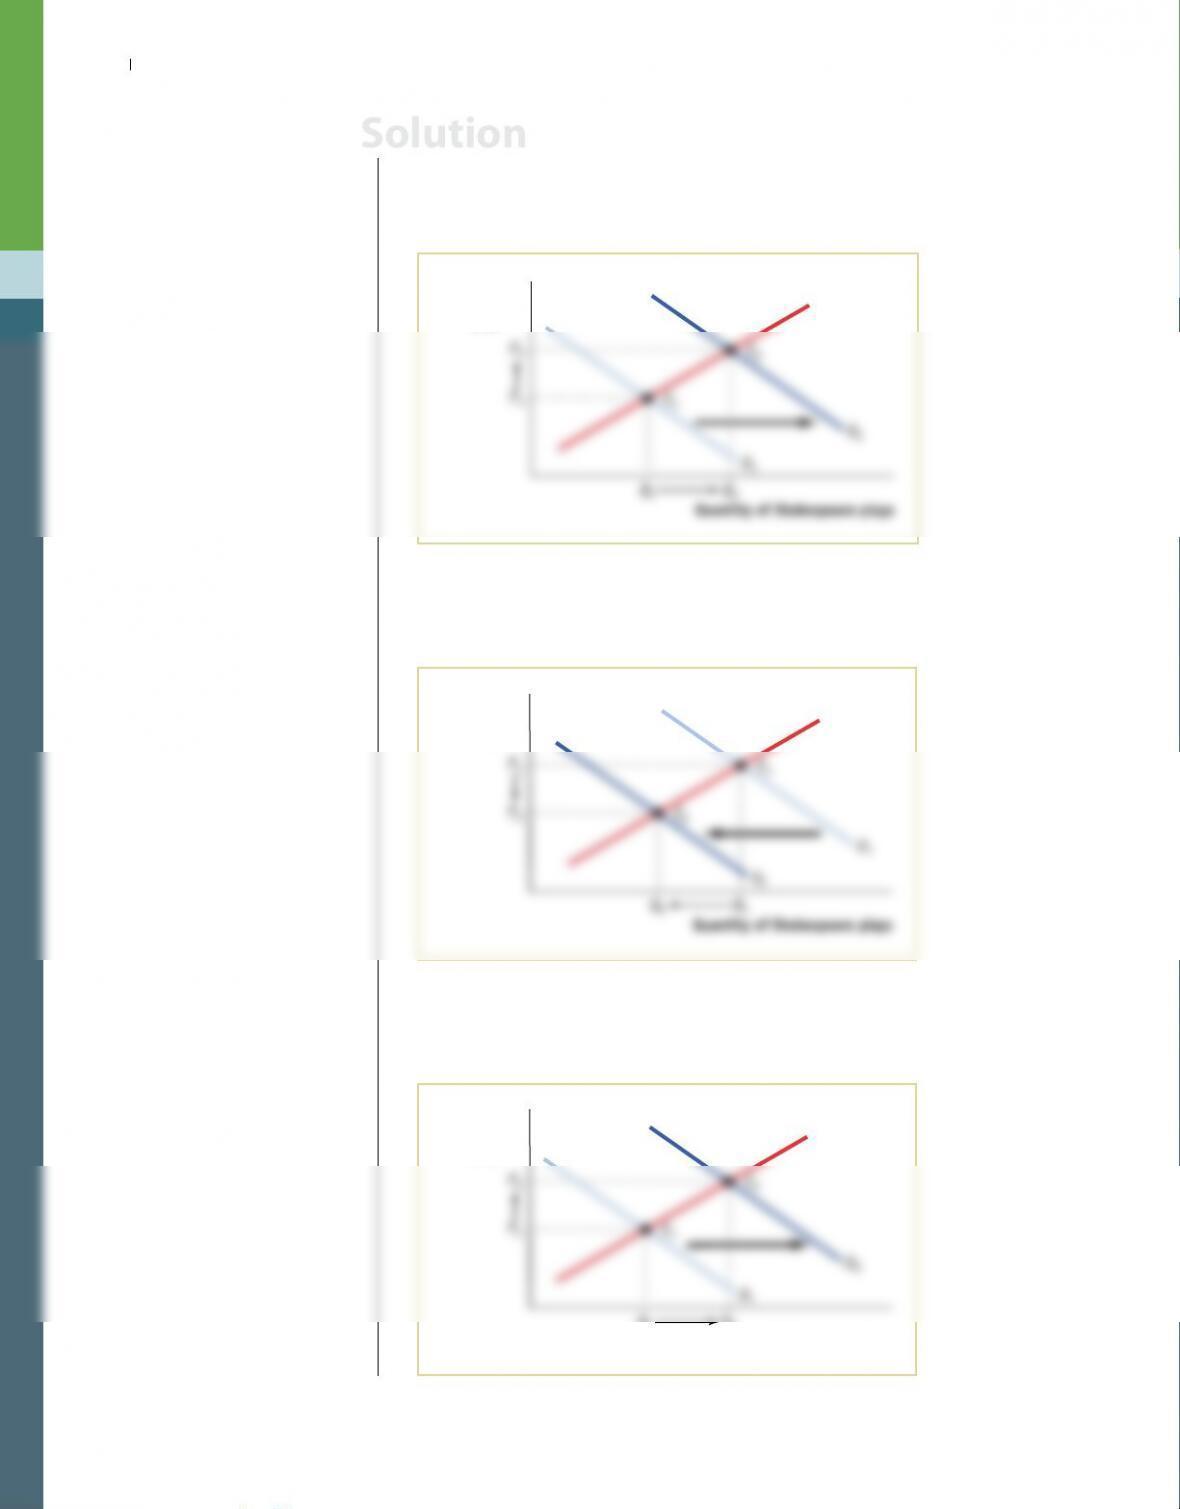
14. a. The death of Marlowe means that the supply of a substitute good (Marlowe’s
plays) has decreased. As a result, the demand for Shakespeare’s plays will
increase, inducing a rightward shift of the demand curve in the market for
Shakespeare’s plays from D1 to D2. As a result, equilibrium price and quantity
will rise as the equilibrium changes from E1 to E2.
Q1
P1
P2
Q2
Quantity of Shakespeare plays
E1
E2
Price of
Shak
espeare
play
S
b. After the outbreak of the plague, fewer Londoners will wish to see Shakespeare’s
plays to avoid contracting the illness, inducing a leftward shift of the demand
curve from D1 to D2. Equilibrium price and quantity will fall as the equilibrium
changes from E1 to E2.
Q2
P2
P1
Q1
Quantity of Shakespeare plays
E2
E1
Price of
Shak
espeare
play
S
c. Queen Elizabeth’s commissions result in a greater quantity of Shakespeare’s
plays demanded at any given price. This represents a rightward shift of the
demand curve from D1 to D2, resulting in a higher equilibrium price and
quantity as the equilibrium changes from E1 to E2.
Q1
P1
P2
Q2
Quantity of Shakespeare plays
E1
E2
Price of
Shak
espeare
play
S
Solution
15. This year, the small town of Middling experiences a sudden doubling of the birth
rate. After three years, the birth rate returns to normal. Use a diagram to illus–
trate the effect of these events on the following.
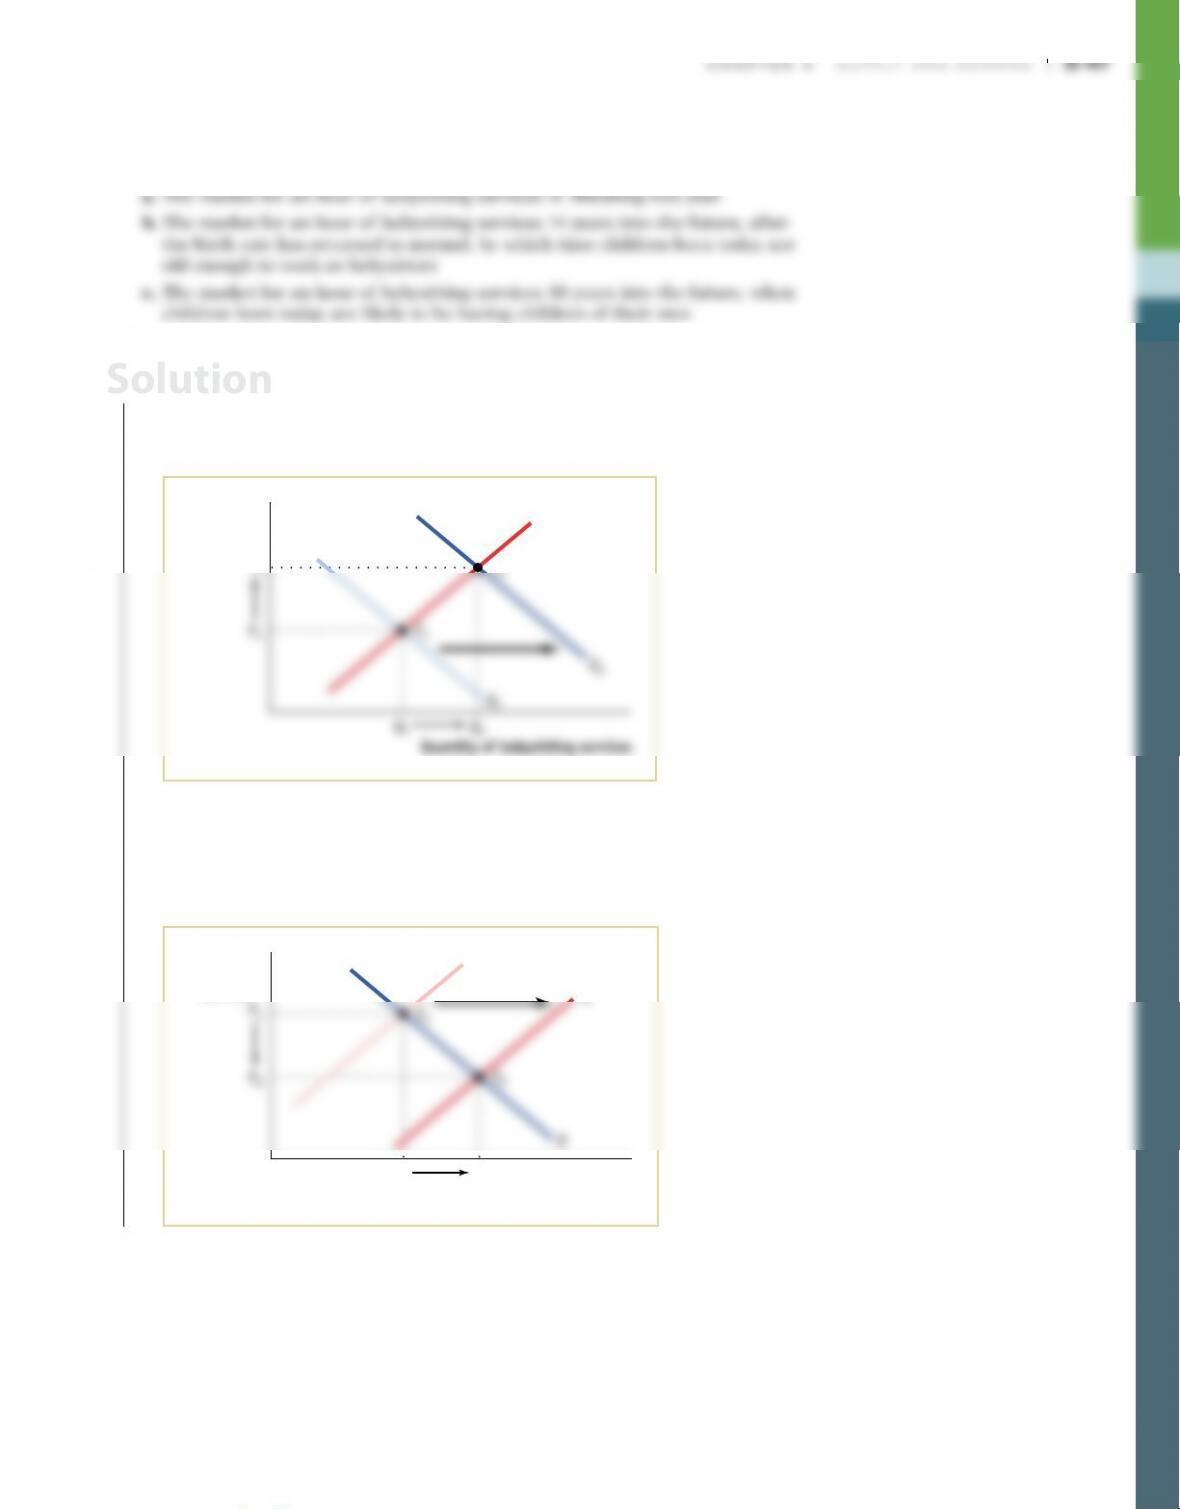
15. a. There are more babies today, so the demand for an hour of babysitting ser-
vices has increased. This produces a rightward shift of the demand curve for
babysitting services from D1 to D2, resulting in a rise in the equilibrium price
and quantity as the equilibrium changes from E1 to E2.
P2
D1
D2
S
E2
Price of
babysitting
services
Solution
S-48 Chapter 3 Supply and demand
c. It is likely that there will be an increase in the number of babies born 30 years
from now. Therefore, there will be an increase in the demand for babysitting
services, shifting the demand curve rightward from D1 to D2. This will result
Q1
P1
P2
D1
D2
Q2
Quantity of babysitting services
E2
E1
16. Use a diagram to illustrate how each of the following events affects the
equilibrium price and quantity of pizza.
Chapter 3 Supply and demand S-49
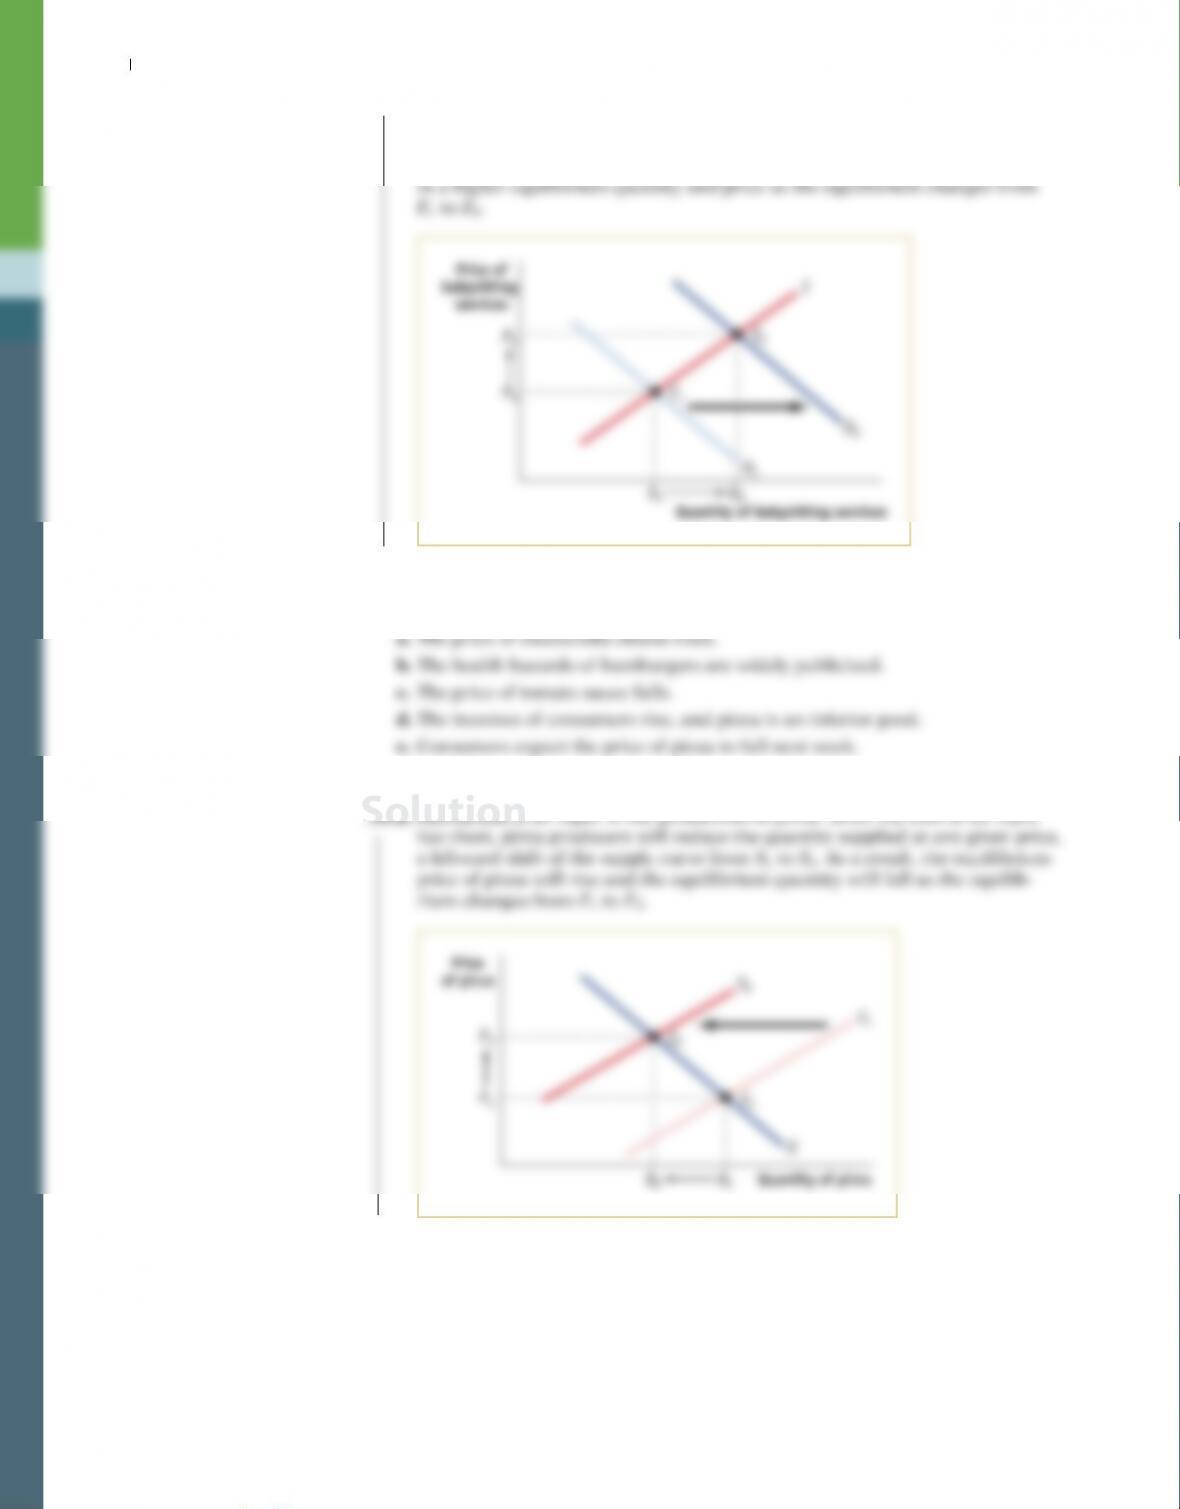
b. Consumers will substitute pizza in place of hamburgers, resulting in an
increased demand for pizza at any given price. This generates a rightward
shift of the demand curve from D1 to D2, leading to a rise in the equilibrium
price and quantity as the equilibrium changes from E1 to E2.
Q1
P1
P2
D2
D1
S
Q2Quantity of pizza
E1
E2
Price
of pizza
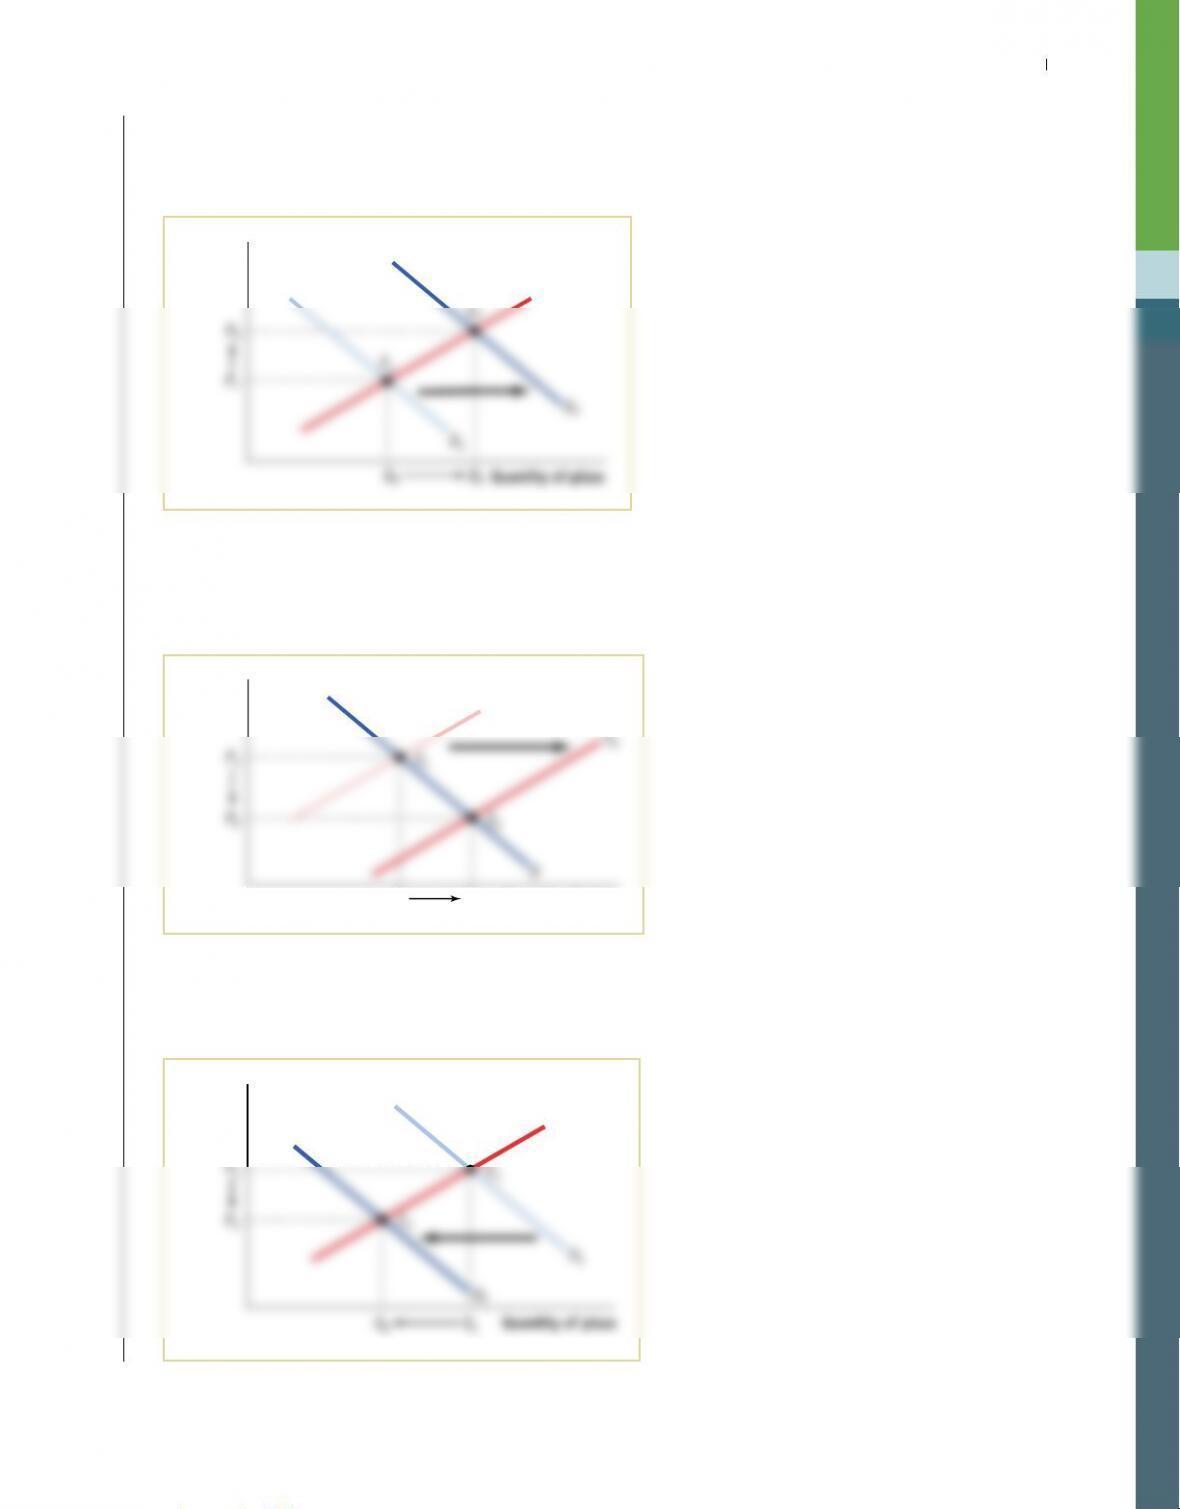
c. Tomato sauce is an input in the production of pizza. Since the cost of an input
has fallen, pizza producers will increase the quantity supplied at any given
price, a rightward shift of the supply curve from S1 to S2. As a result, the equi–
librium price of pizza will fall and the equilibrium quantity will rise as the
equilibrium changes from E1 to E2.
Q
1
S1
Q
2
Quantity of pizza
Price
of pizza
d. The demand for an inferior good decreases when the incomes of consumers
rise. So a rise in consumer incomes produces a leftward shift of the demand
curve from D1 to D2, resulting in a lower equilibrium price and quantity as the
equilibrium changes from E1 to E2.
Q
2
P2
P1
D1
D2
S
Q
1Quantity of pizza
E1
E2
Price
of pizza
S-50 Chapter 3 Supply and demand
e. Consumers will delay their purchases of pizza today in anticipation of con-
suming more pizza next week. As a result, the demand curve shifts leftward
from D1 to D2, resulting in a lower equilibrium price and quantity as the equi-
Q2
P2
P1
D1
D2
S
Q1Quantity of pizza
E1
E2
17. Although he was a prolific artist, Pablo Picasso painted only 1,000 canvases dur-
ing his “Blue Period.” Picasso is now dead, and all of his Blue Period works are
currently on display in museums and private galleries throughout Europe and
the United States.
a. Draw a supply curve for Picasso Blue Period works. Why is this supply curve
different from ones you have seen?
b. Given the supply curve from part a, the price of a Picasso Blue Period work
will be entirely dependent on what factor(s)? Draw a diagram showing how the
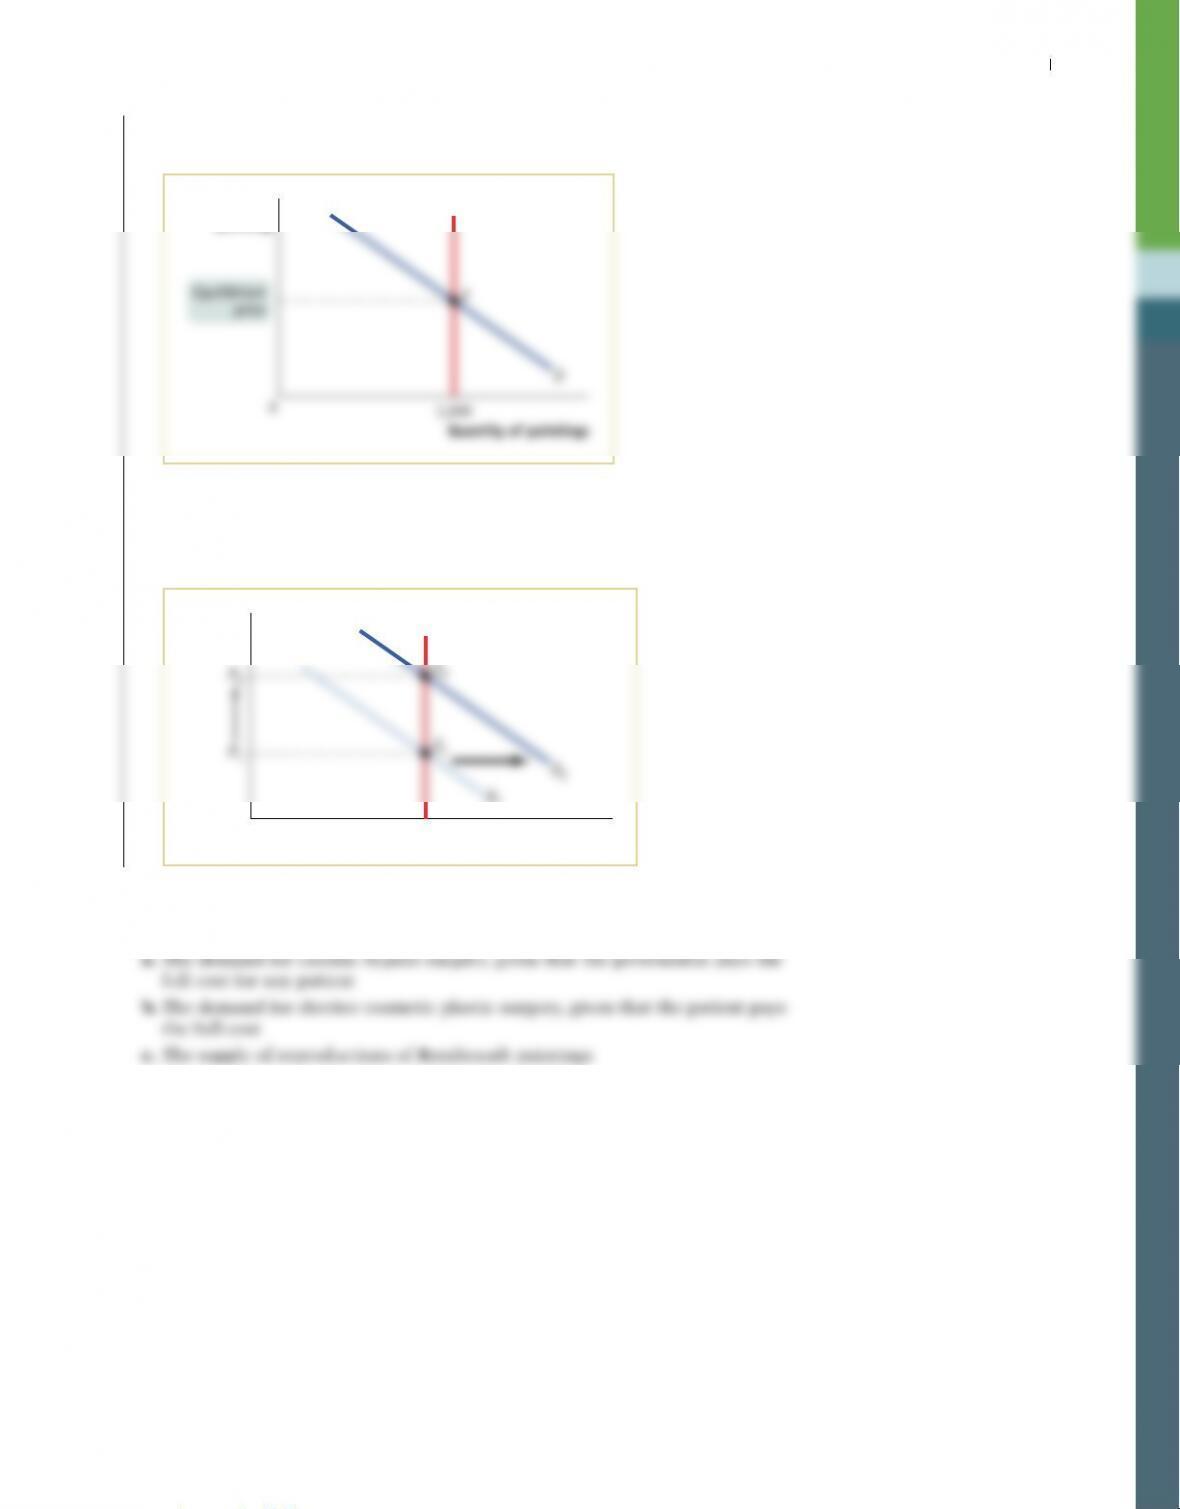
17. a . There are no more Picasso Blue Period works available. Hence the supply
Solution
Chapter 3 Supply and demand S-51
b. Since supply is fixed, the price of a Picasso Blue Period work is entirely deter–
mined by demand. Any change in demand is fully reflected in a change in price.
S
Price of
painting
D
E
Equilibrium
price
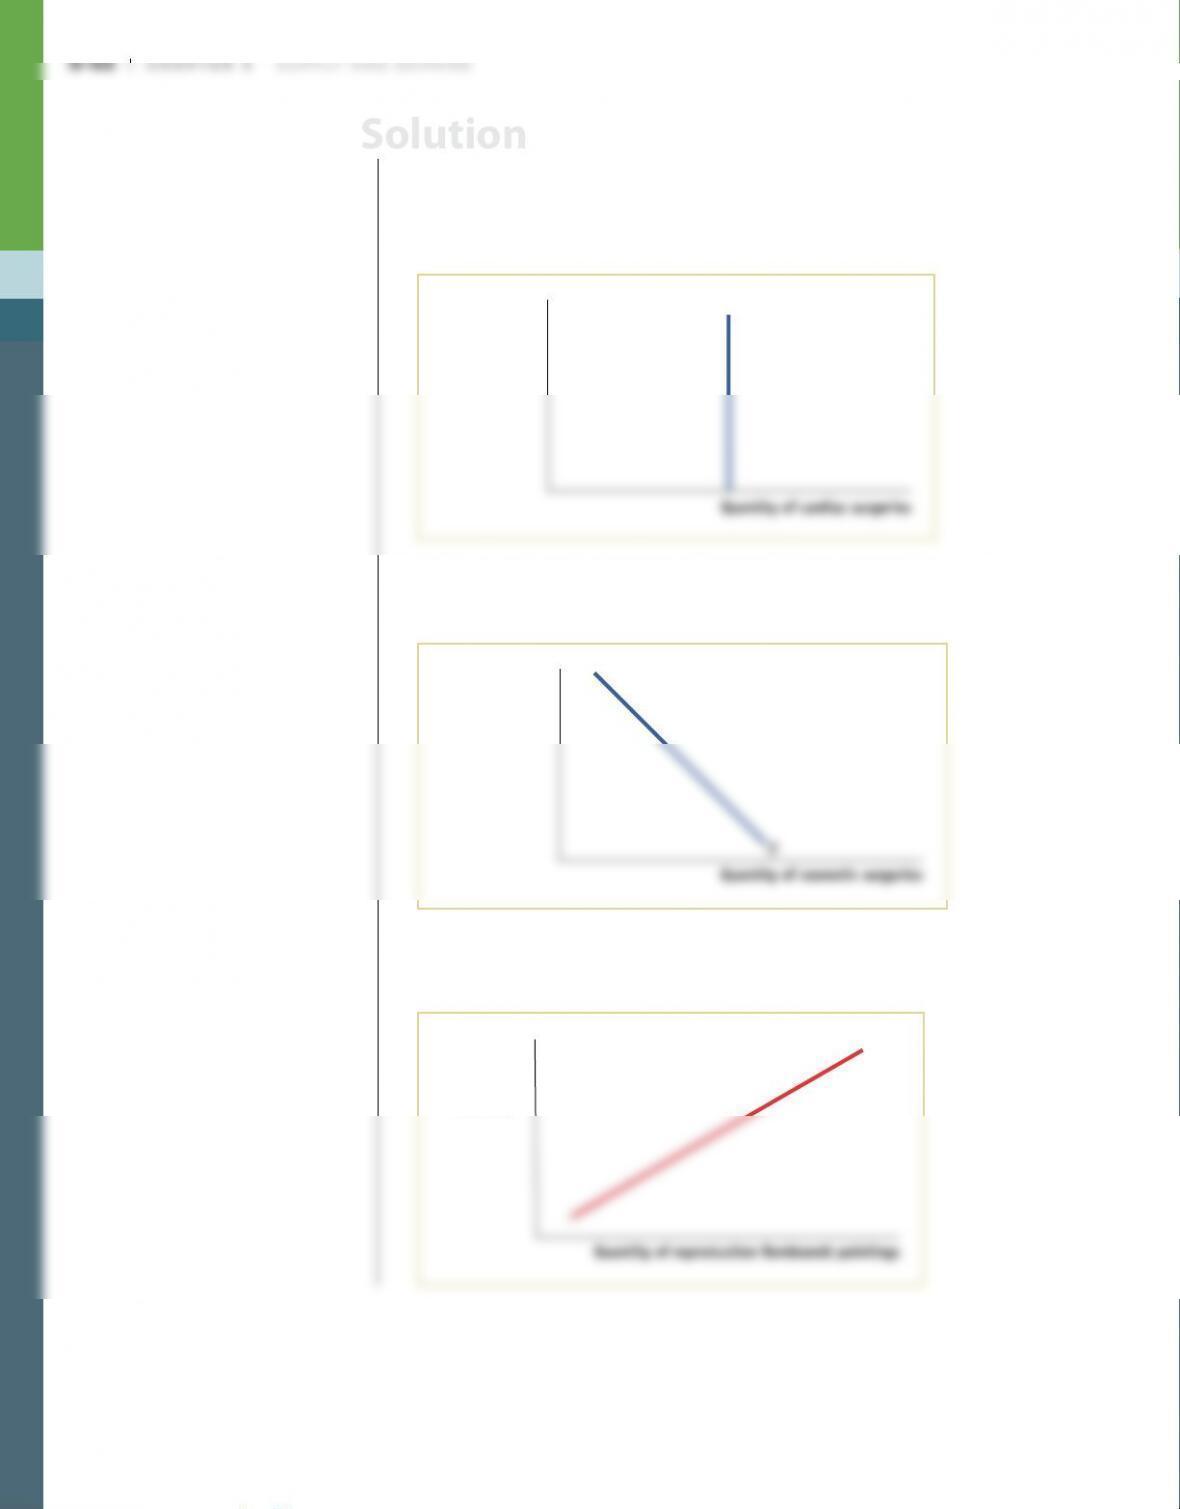
18. a. Since the government pays the full cost of cardiac bypass surgery, the price
paid by the patient is always zero. Consequently, the demand for surgery is
constant, regardless of the price actually paid by the government. The quantity
demanded is constant at the quantity that would be demanded by patients if the
government, not the patient, pays for surgery. That is, it is a vertical line at the
quantity that patients would demand if the price of surgery to them were zero.
D
Price of
car
diac surgery
Quantity of cardiac surgeries
b. In this case, the patient must pay the cost of the surgery, so the quantity
demanded is affected by price, and the demand curve has its usual downward–
sloping shape.
Price of
cosmetic sur
gery
Quantity of cosmetic surgeries
c. The supply of Rembrandt reproductions is not fixed because they can be cre–
ated by existing artists. So the supply curve of these reproductions has the
familiar upward-sloping shape.
S
Price of
r
eproduction
Rembrandt
painting
Quantity of reproduction Rembrandt paintings
Solution
19. In each of the following, what is the mistake that underlies the statement? Explain
the mistake in terms of supply and demand and the factors that influence them.
a. Consumers are illogical because they are buying more Starbucks beverages in
19. a. This statement ignores the possibility that consumers are buying more Star-
bucks beverages despite higher prices because (i) their incomes went up; or
b. This statement ignores the fact that consumers are likely to consider items at
Cost-U-Less Warehouse Superstore as inferior goods, so will purchase fewer
items there when their incomes rise.
c. This statement is based on the erroneous assumption that an iPhone 5 is a
20. In 2016 the price of oil fell to a 12-year low. For drivers, the cost of driving fell
significantly as gasoline prices plunged. For the airline industry, the cost of
operation also fell significantly because jet fuel is a major expense.
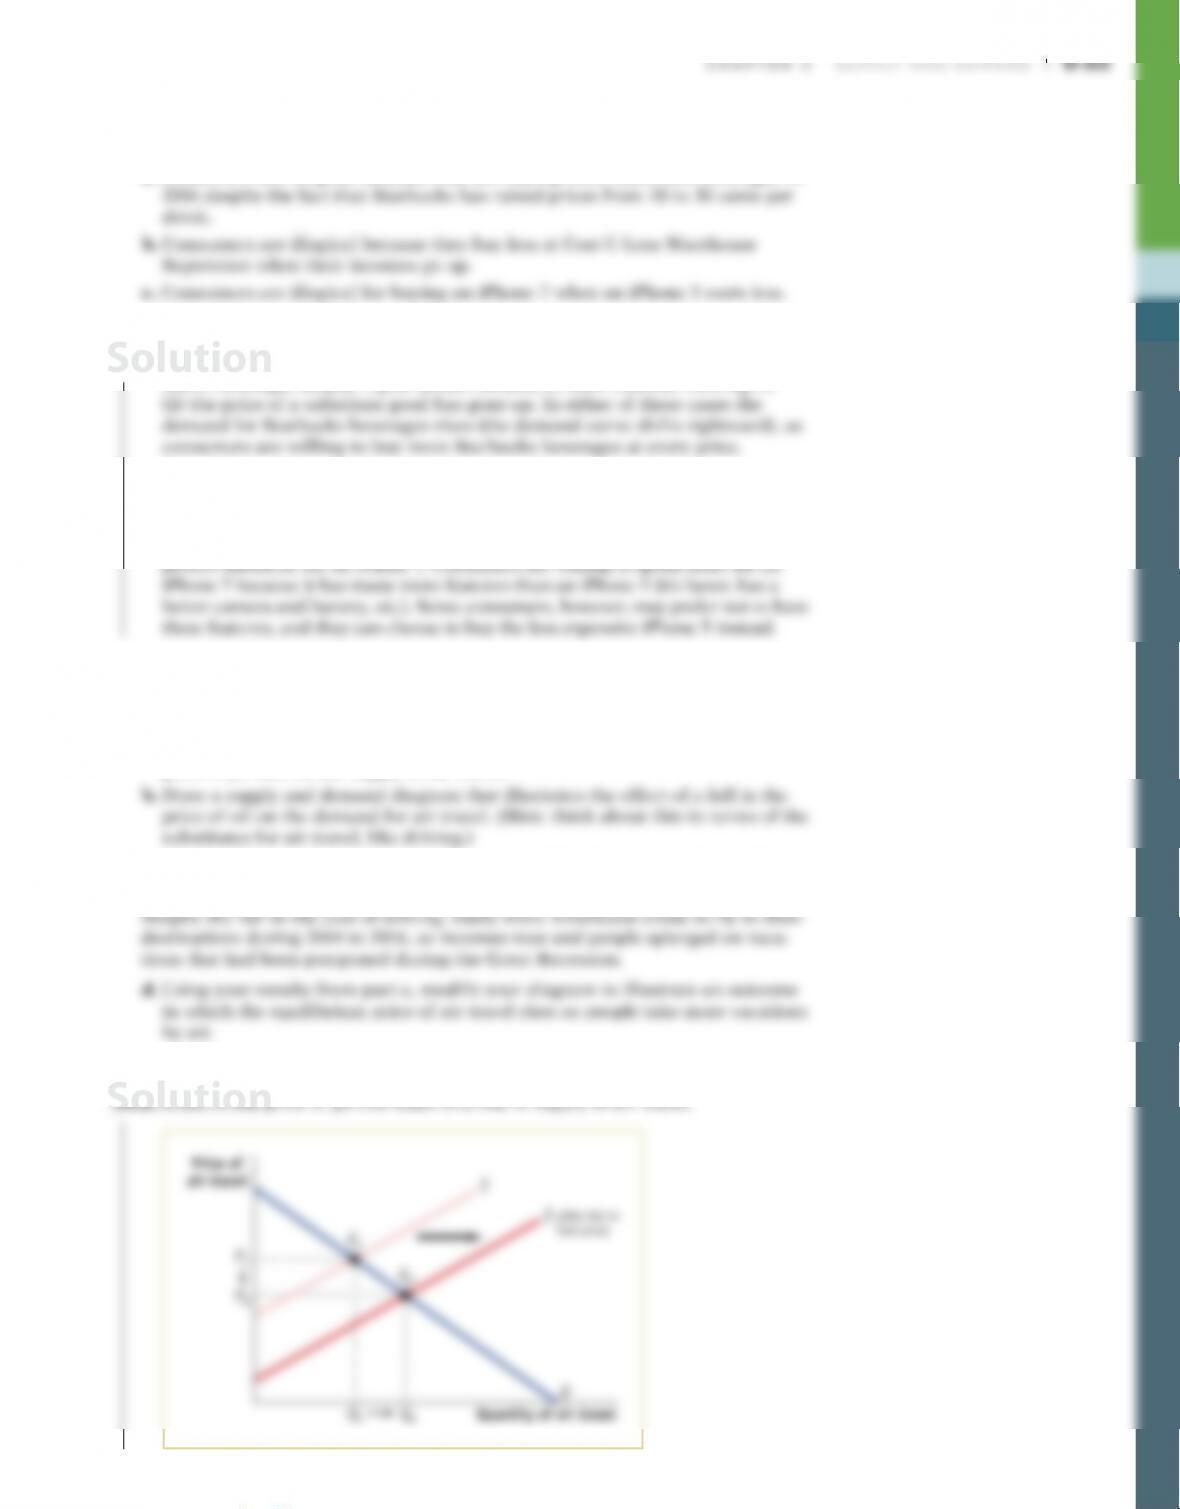
a. Draw a supply and demand diagram that illustrates the effect of a fall in the
price of jet fuel on the supply of air travel.
c. Put the diagrams from parts a and b together. What happens to the equilib–
rium price and quantity of air travel?
Solution
S-54 Chapter 3 Supply and demand
b. A fall in the price of oil means that the price of a substitute good, travel by car,
has fallen. As a result, the demand for air travel falls.
S
Price of
air tr
avel
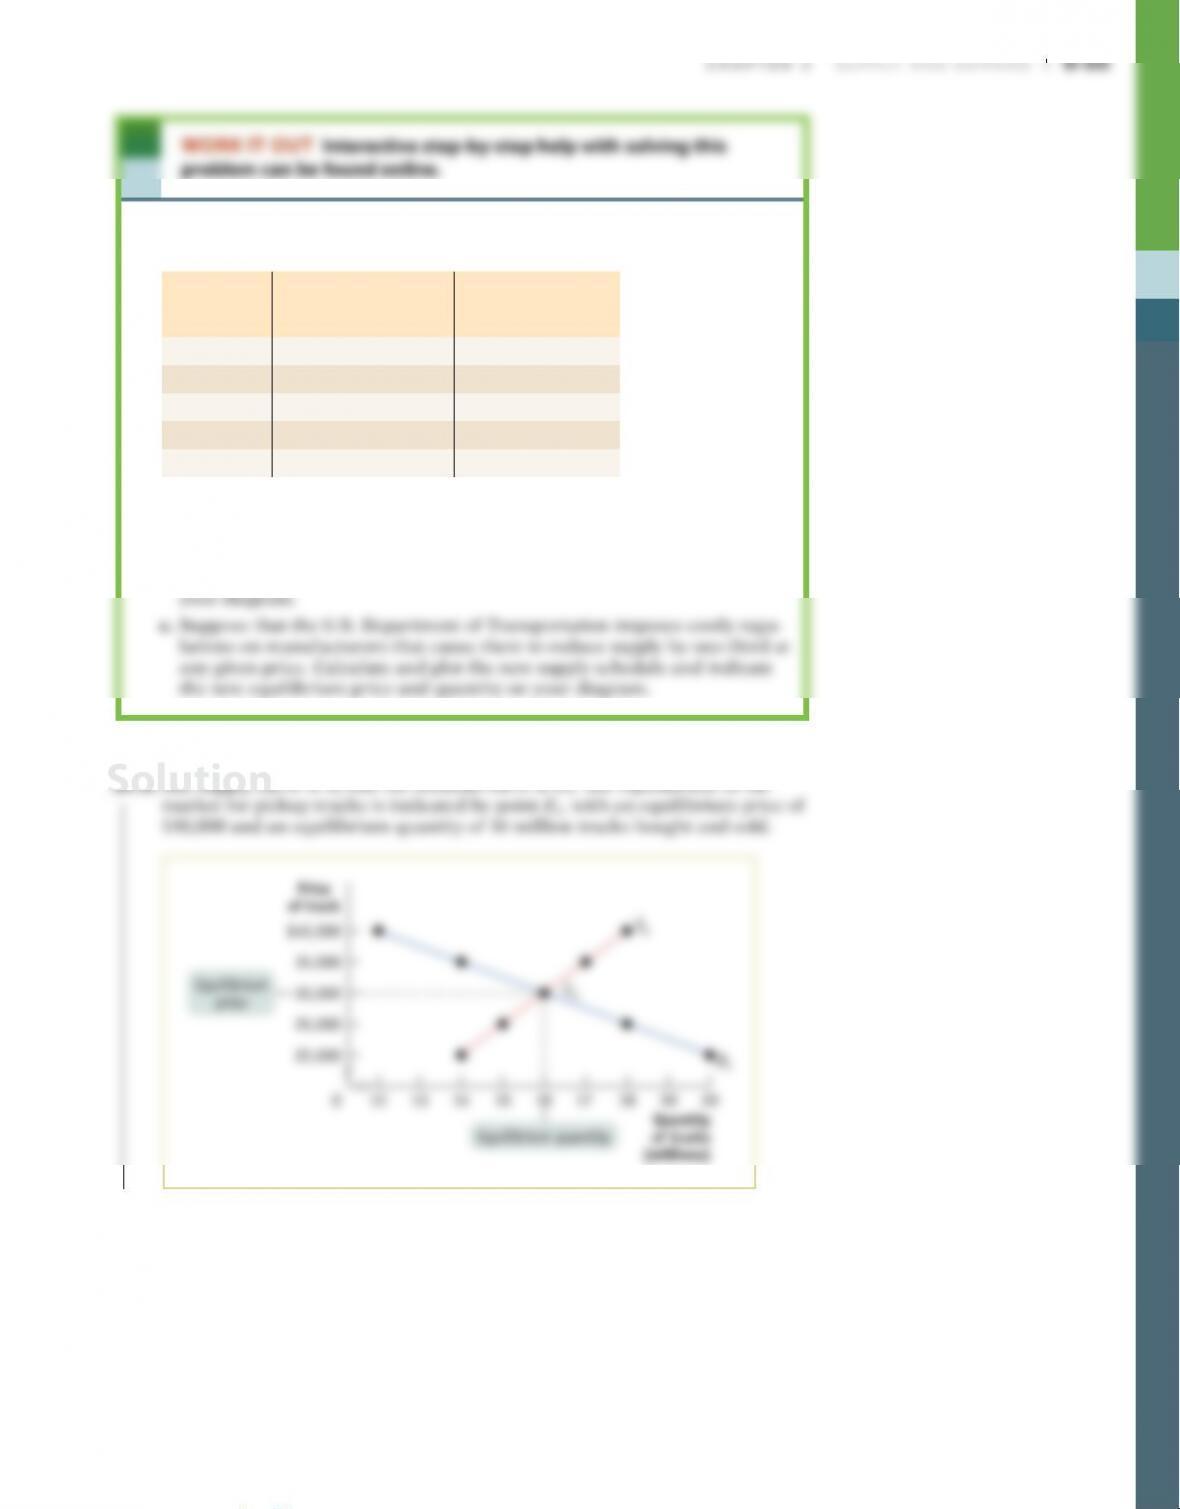
21. The accompanying table gives the annual U.S. demand and supply schedules
for pickup trucks.
Price of
truck
Quantity of
trucks demanded
(millions)
Quantity of
trucks supplied
(millions)
$20,000 20 14
25,000 18 15
30,000 16 16
35,000 14 17
40,000 12 18
a. Plot the demand and supply curves using these schedules. Indicate the
equilibrium price and quantity on your diagram.
b. Suppose the tires used on pickup trucks are found to be defective. What
would you expect to happen in the market for pickup trucks? Show this on
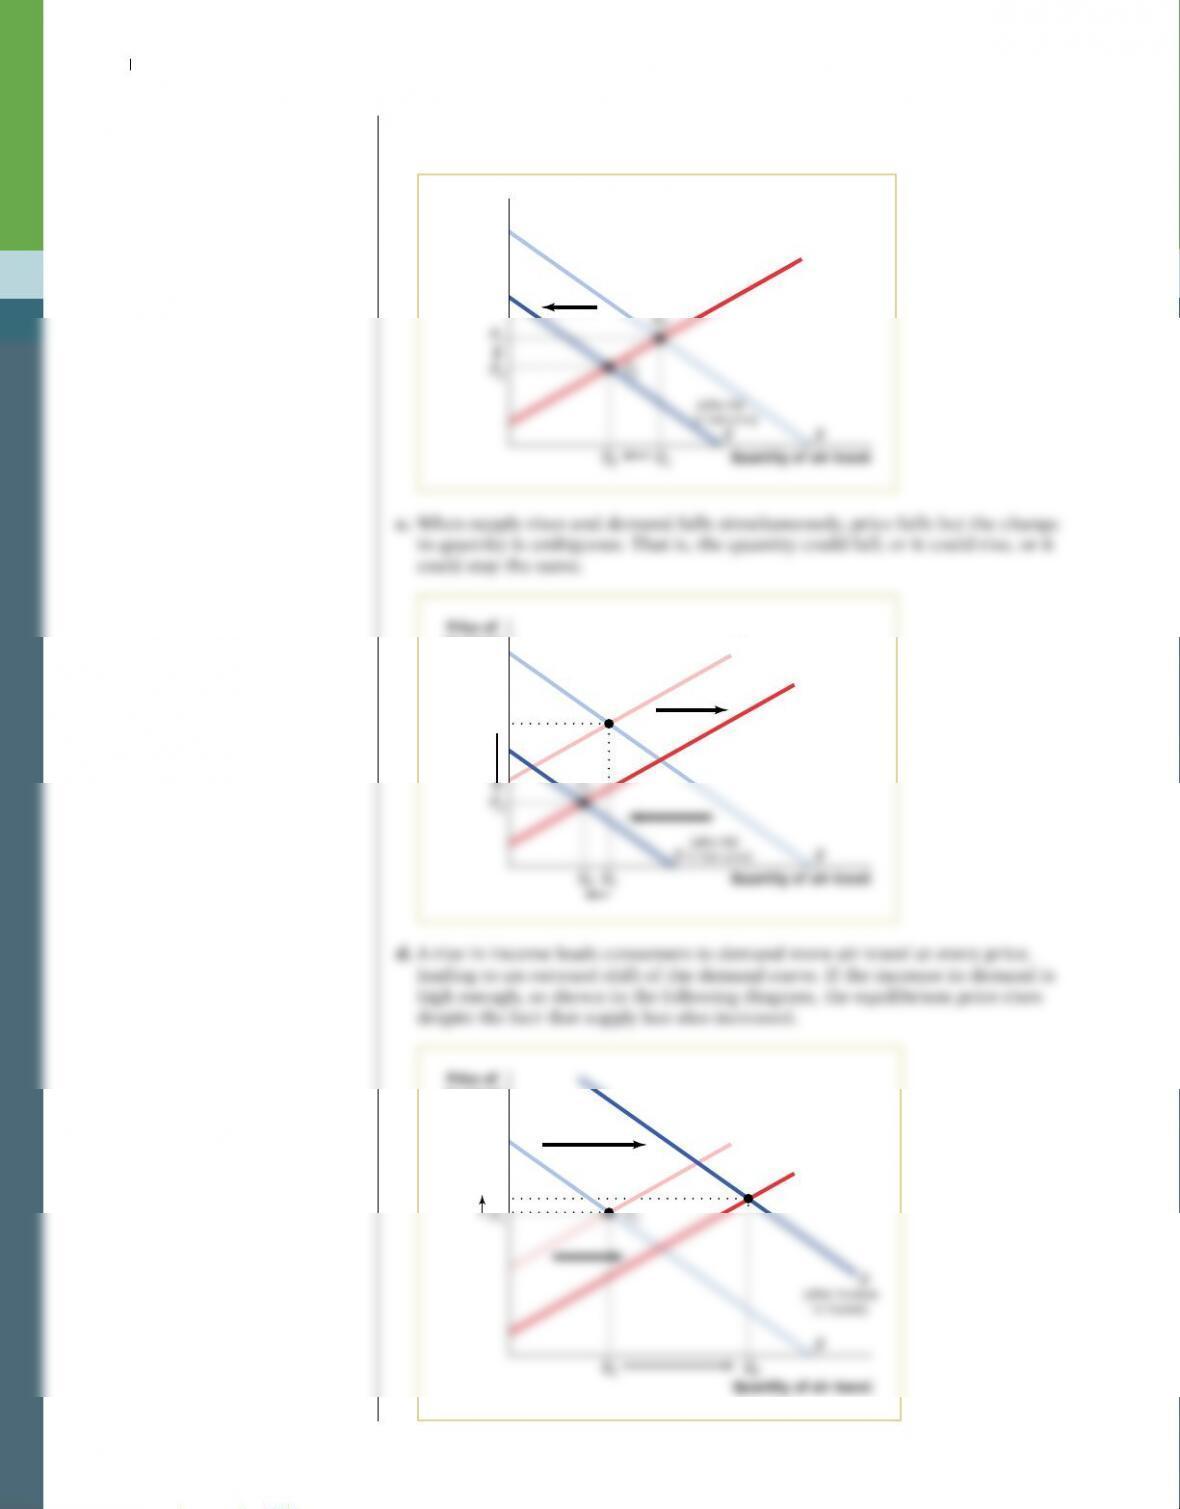
21. a. The supply curve is S1 and the demand curve is D1. The equilibrium in the
Solution
S-56 Chapter 3 Supply and demand
b. The announcement of a defect is likely to decrease the demand for pickup
trucks. This is represented by a leftward shift of the demand curve, as shown
by the shift from D1 to D2, and causes the equilibrium price and quantity to
fall as the equilibrium changes from E1 to E2.
Price
of truck
(millions)
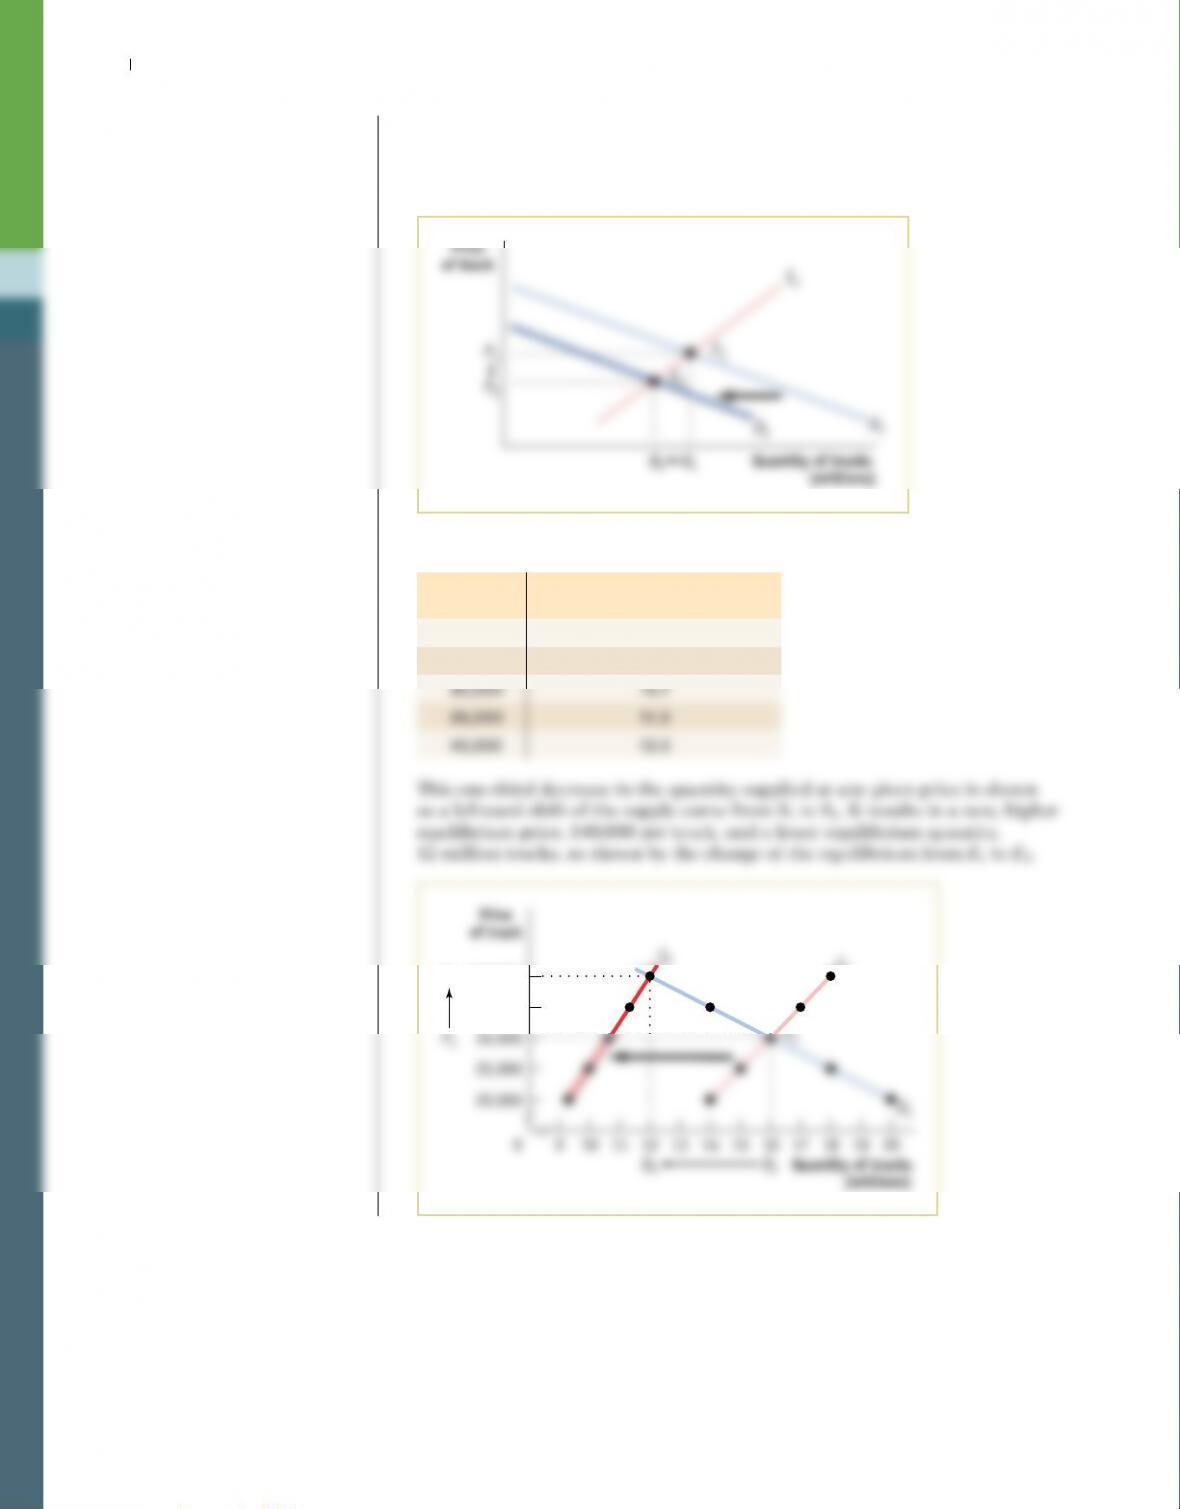
c. The new supply schedule is as follows.
Price
of truck
Quantity of trucks supplied
(millions)
$20,000 9.3
25,000 10.0
(millions)